Fig. A.1
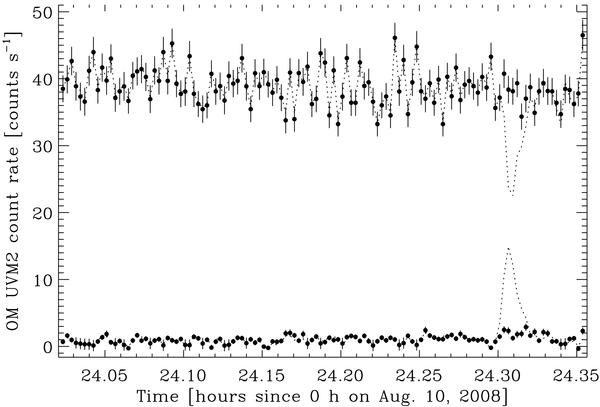
UV light curves for EX Lup (top, with the background subtracted) and for the background (bottom) during the S415 exposure of the OM in the fast mode. The dotted lines show the light curves obtained with the SAS script omfchain and no tracking history file. The data points show the corrected light curves using our spacecraft drift estimates. The interval of the time bin is 10 s.
Current usage metrics show cumulative count of Article Views (full-text article views including HTML views, PDF and ePub downloads, according to the available data) and Abstracts Views on Vision4Press platform.
Data correspond to usage on the plateform after 2015. The current usage metrics is available 48-96 hours after online publication and is updated daily on week days.
Initial download of the metrics may take a while.