Fig. 5
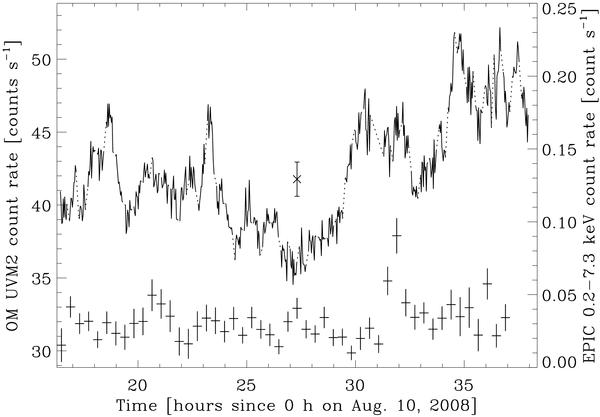
Simultaneous UV and X-ray light curves of EX Lup. The upper and lower curves are the OM light curve (left y-axis) and the EPIC light curve (right y-axis), respectively. The UV light curve obtained with the OM fast mode was rebinned to bin size of 120 s. In the figure center, the cross with error bar indicates the median value and median error of the UV photometry. To guide the eye, the dotted lines link consecutive OM exposures. The bin size of the X-ray light curve is 500 s.
Current usage metrics show cumulative count of Article Views (full-text article views including HTML views, PDF and ePub downloads, according to the available data) and Abstracts Views on Vision4Press platform.
Data correspond to usage on the plateform after 2015. The current usage metrics is available 48-96 hours after online publication and is updated daily on week days.
Initial download of the metrics may take a while.