Fig. 3
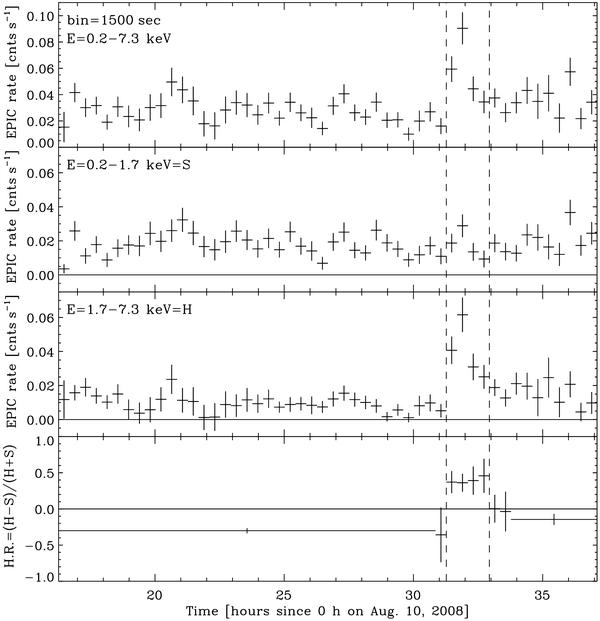
XMM-Newton/EPIC background-subtracted X-ray light curves of EX Lup. The top panel shows the EPIC (pn+MOS1+MOS2) X-ray light curve of EX Lup in the energy band from 0.2 to 7.3 keV. The middle panels show the soft (S = 0.2−1.7 keV) and hard (H = 1.7−7.3 keV) band X-ray light curves. The bin size of the X-ray light curves is 1500 s. The bottom panel shows the variation of the corresponding hardness ratio. The vertical dashed lines bracket the source flaring period.
Current usage metrics show cumulative count of Article Views (full-text article views including HTML views, PDF and ePub downloads, according to the available data) and Abstracts Views on Vision4Press platform.
Data correspond to usage on the plateform after 2015. The current usage metrics is available 48-96 hours after online publication and is updated daily on week days.
Initial download of the metrics may take a while.