Fig. 17
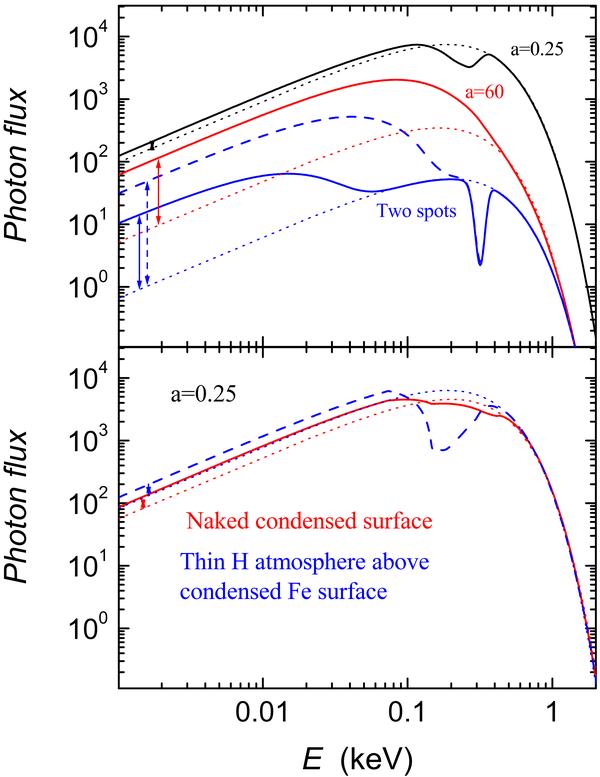
Comparison of the integral averaged spectra of the magnetized neutron star models (solid and dashed curves) with black-body spectra, which fit the model spectra at E ≥ 0.5 keV (dotted curves). The differences at the optical band are also shown. Top panel: the models with black-body local spectra and the Gaussian line (τ = 3.0, σ = 30 eV), centered according to Eq. (26), for three temperature distributions: a = 0.25 (upper curves), a = 60 (middle curves), and two-spot model (lower curves). The parameters of the distributions are the same as in Fig. 15. The spectrum of two-spot model with the temperature kT = 0.03 keV of the cold surface is also shown (dashed curve). Bottom panel: the models with smooth temperature distribution (a = 0.25) and various local model spectra: naked iron spectrum (solid curves) and the thin model atmosphere above condensed iron surface spectra (dashed curve). Parameters of the local spectra are the same as in Fig. 13.
Current usage metrics show cumulative count of Article Views (full-text article views including HTML views, PDF and ePub downloads, according to the available data) and Abstracts Views on Vision4Press platform.
Data correspond to usage on the plateform after 2015. The current usage metrics is available 48-96 hours after online publication and is updated daily on week days.
Initial download of the metrics may take a while.