Fig. 16
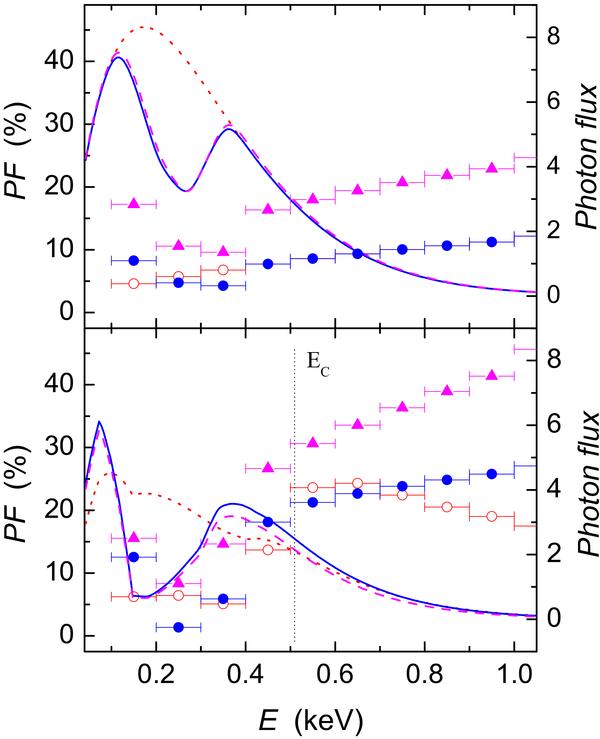
Energy dependence of pulsed fractions (symbols and left vertical axes) together with averaged photon spectra (lines and right vertical axes) for the neutron star models with the same parameters as in Fig. 12 and a = 0.25. Top panel: the models with pure black-body local spectra (open circles and dotted curve), black-body local spectra with an absorption line (τ = 3.0, σ = 30 eV) centered according to Eq. (26), and the isotropic angular distribution (filled circles and solid curve), and black-body local spectra with the absorption line and the electron scattering atmosphere angular distribution (triangles and dashed curve). Bottom panel: the model of a naked condensed iron surface (open circles and dotted curve), a thin atmosphere above condensed iron surface spectra with corresponding angular distribution (filled circles and solid curve), and the same local spectra, but with slightly different pole temperatures: Tp,1 = 0.15 keV, Tp,2 = 0.14 keV (triangles and dashed curve). The position of EC, which corresponds to the magnetic pole, is shown by vertical dotted line.
Current usage metrics show cumulative count of Article Views (full-text article views including HTML views, PDF and ePub downloads, according to the available data) and Abstracts Views on Vision4Press platform.
Data correspond to usage on the plateform after 2015. The current usage metrics is available 48-96 hours after online publication and is updated daily on week days.
Initial download of the metrics may take a while.