Fig. 14
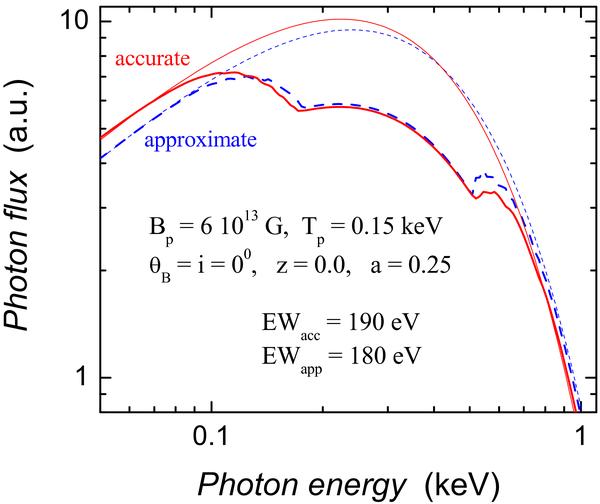
Phase averaged photon spectra of the neutron star models with parameters kTp1 = kTp2 = 0.15 keV, Bp1 = Bp2 = 6 × 10¹³ G, i = θB = 0° and a = 0.25. The local spectra are from a naked iron surface, computed accurately using the code presented by van Adelsberg et al. (2005) (thick solid curve), and using approximate Eqs. (8)–(12) (thick dashed curve). The adopted continuum spectra without absorption features are shown by the corresponding thin curves. The EWs of the absorption features are rather similar, ≈ 190 and 180 eV.
Current usage metrics show cumulative count of Article Views (full-text article views including HTML views, PDF and ePub downloads, according to the available data) and Abstracts Views on Vision4Press platform.
Data correspond to usage on the plateform after 2015. The current usage metrics is available 48-96 hours after online publication and is updated daily on week days.
Initial download of the metrics may take a while.