Fig. 13
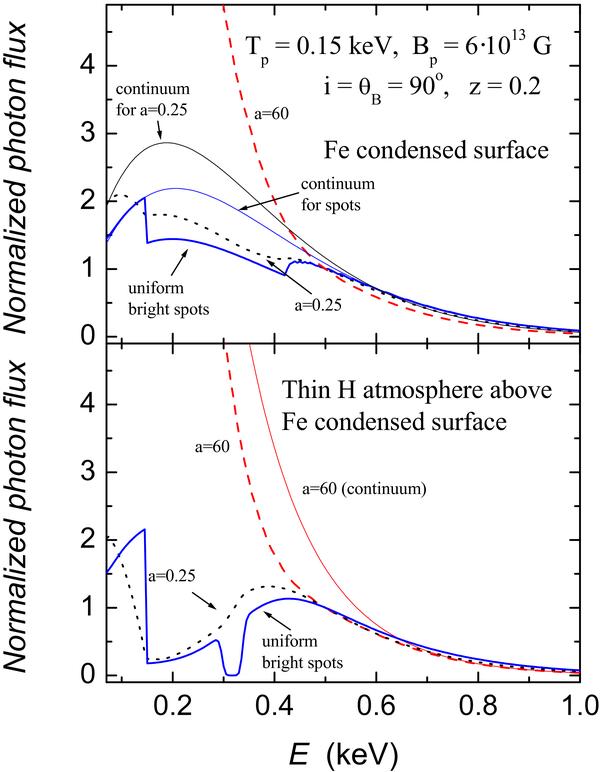
Top panel: phase-averaged photon spectra of the same neutron star models as in Fig. 12, but here the local spectra are from a naked iron surface. The continuum spectra without absorption features are shown by the thin solid curves for the two-spots model and the model with a = 0.25. Bottom panel: phase averaged photon spectra of the same neutron star models as in Fig. 12, but here the local spectra are isotropic blackbodies with absorption features as in the spectra of the thin hydrogen model atmosphere above the condensed iron surface (see text). The continuum spectrum without absorption feature is shown by the thin solid curve for the model with a = 60.
Current usage metrics show cumulative count of Article Views (full-text article views including HTML views, PDF and ePub downloads, according to the available data) and Abstracts Views on Vision4Press platform.
Data correspond to usage on the plateform after 2015. The current usage metrics is available 48-96 hours after online publication and is updated daily on week days.
Initial download of the metrics may take a while.