Fig. 12
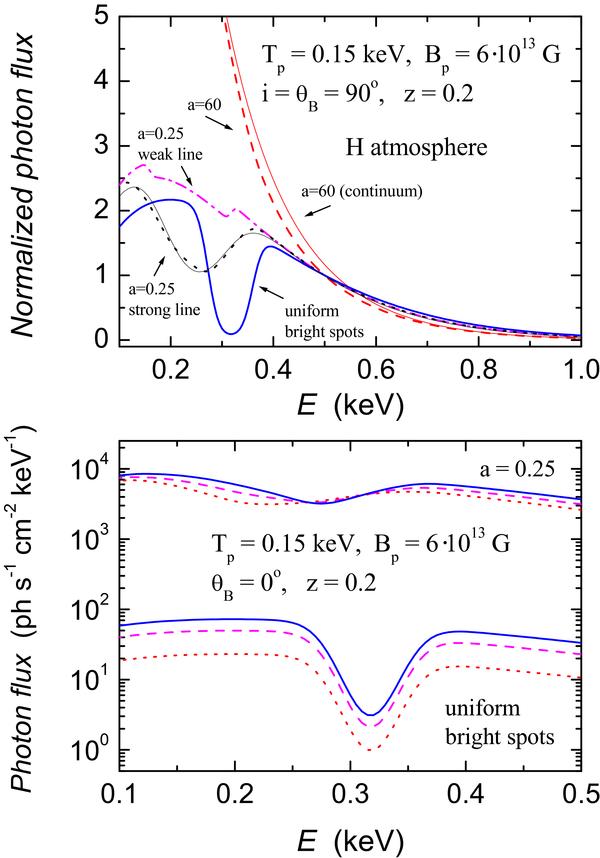
Phase-averaged photon spectra for the neutron star model with kTp1 = kTp2 = 0.15 keV, Bp1 = Bp2 = 6 × 10¹³ G, z = 0.2, i = θB = 90° and different temperature distributions across the surface. Top panel: the temperature distribution Eq. (23) with a1 = a2 = 0.25 (dotted curve), with a1 = a2 = 60 (dashed curve), and two uniform bright spots with T = Tp and angular size θsp = 5° (solid curve). The local spectra are isotropic black-body spectra with an absorption line (τ1 = 3, σ1 = 30 eV) centered according to Eq. (26). The spectrum of the model with a = 0.25 and a weaker absorption line (τ1 = 2.6, σ1 = 6 eV) is also shown (dash-dotted curve). The thin solid curves are the continuum spectrum of a model with a = 60 and a single black-body spectrum with a Gaussian line (E1 = 0.25 keV, τ1 = 0.85, σ1 = 52 eV) for the strong-line a = 0.25 model. Bottom panel: the photon spectra for two temperature distributions (a = 0.25 and two bright spots) under various inclination angles to the line of sight: i = 0° (solid curves), i = 45° (dashed curves), and i = 90° (dotted curves).
Current usage metrics show cumulative count of Article Views (full-text article views including HTML views, PDF and ePub downloads, according to the available data) and Abstracts Views on Vision4Press platform.
Data correspond to usage on the plateform after 2015. The current usage metrics is available 48-96 hours after online publication and is updated daily on week days.
Initial download of the metrics may take a while.