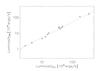
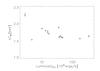
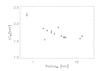
Fig. 8
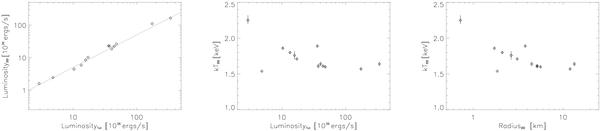
Left panel: variation in blackbody luminosity in the band 0.5 − 30 keV with total luminosity in the same band. The dashed line shows the 50% of the total luminosity. Middle panel: temperature of the blackbody component versus the total luminosity in the 0.5 − 30 keV energy band. Right panel: temperature of the blackbody component versus the radius of the blackbody emission. The radius has been inferred from the normalisation of the blackbody component. See Sect. 4.2 for the observations included in this figure.
Current usage metrics show cumulative count of Article Views (full-text article views including HTML views, PDF and ePub downloads, according to the available data) and Abstracts Views on Vision4Press platform.
Data correspond to usage on the plateform after 2015. The current usage metrics is available 48-96 hours after online publication and is updated daily on week days.
Initial download of the metrics may take a while.