Fig. 4
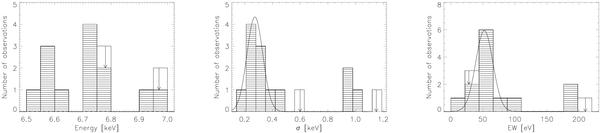
Histogram of the parameters of the Fe line when fitted with a Gaussian component for the full sample considered in this work. The white rectangles marked with an arrow correspond to the lines detected below a significance of 3 σ (see Fig. 5). The width (middle panel) and the EW (right panel) have a well-defined “Gaussian-like” distribution around the weighted average value, while the outliers have large errors associated to their σ and EW values.
Current usage metrics show cumulative count of Article Views (full-text article views including HTML views, PDF and ePub downloads, according to the available data) and Abstracts Views on Vision4Press platform.
Data correspond to usage on the plateform after 2015. The current usage metrics is available 48-96 hours after online publication and is updated daily on week days.
Initial download of the metrics may take a while.