Fig. B.1
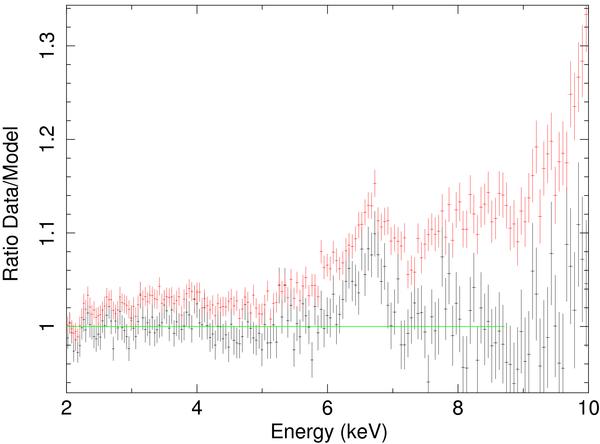
Ratio of the EPIC pn spectrum of Ser X − 1 (Obs 0084020501) to its best-fit continuum model for the spectrum free of pile-up used in this paper (black). The red points show the ratio of the piled-up spectrum of the same observation, obtained when the full PSF is used, to the best-fit continuum model of the spectrum free of pile-up. The pile-up shows up mainly as a significant hardening of the spectrum at energies ≳ 5 keV. This adds an “artificial” red-wing to the Fe line because of the different curvature of the spectrum.
Current usage metrics show cumulative count of Article Views (full-text article views including HTML views, PDF and ePub downloads, according to the available data) and Abstracts Views on Vision4Press platform.
Data correspond to usage on the plateform after 2015. The current usage metrics is available 48-96 hours after online publication and is updated daily on week days.
Initial download of the metrics may take a while.