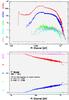
Fig. A.1
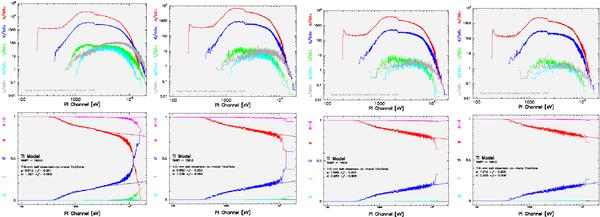
Measure of pile-up in the EPIC pn timing mode using the SAS task epatplot for the bright source GX 349 + 2. Source events were extracted from a 64′′ (16 columns) wide box centred on the source position (left panel). Middle-left, middle-right, and right panels show the same region as in the left panel but after exclusion of the neighbouring 4, 6, and 8 columns from the centre of the box.
Current usage metrics show cumulative count of Article Views (full-text article views including HTML views, PDF and ePub downloads, according to the available data) and Abstracts Views on Vision4Press platform.
Data correspond to usage on the plateform after 2015. The current usage metrics is available 48-96 hours after online publication and is updated daily on week days.
Initial download of the metrics may take a while.