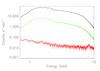
Fig. 1
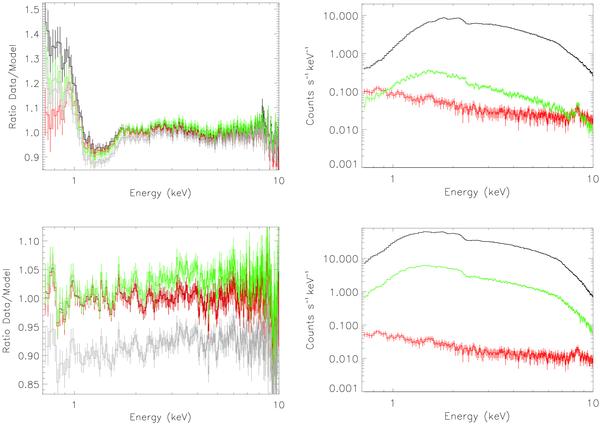
Left: ratio of Spec 1 (see Sect. 2.2) to its best-fit continuum model (black) and the difference from Spec 2 (red) and Spec 3 (green) with respect to the same model. Spec 3 has been scaled so that the energy bin at 10 keV coincides with Spec 1. The original Spec 3 is shown in grey. Right: Source spectrum (black), background from a blank field (red), and background extracted from the outer columns of the central CCD (green). The upper and lower panels show the results for 4U 1705 − 44 and GX 349 + 2, respectively.
Current usage metrics show cumulative count of Article Views (full-text article views including HTML views, PDF and ePub downloads, according to the available data) and Abstracts Views on Vision4Press platform.
Data correspond to usage on the plateform after 2015. The current usage metrics is available 48-96 hours after online publication and is updated daily on week days.
Initial download of the metrics may take a while.