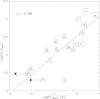
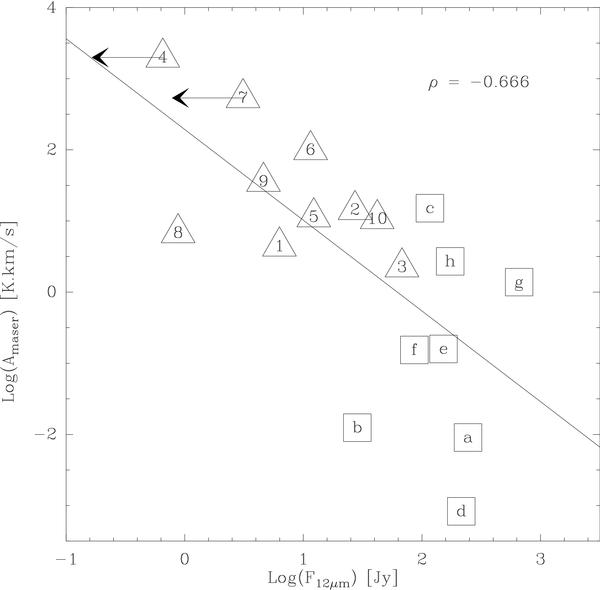
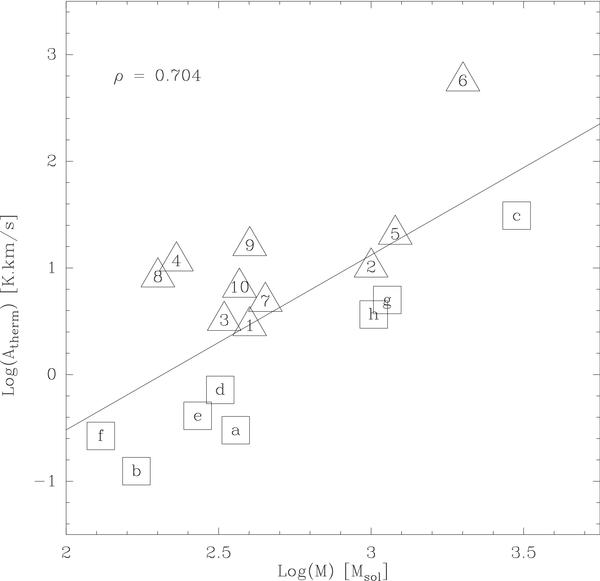
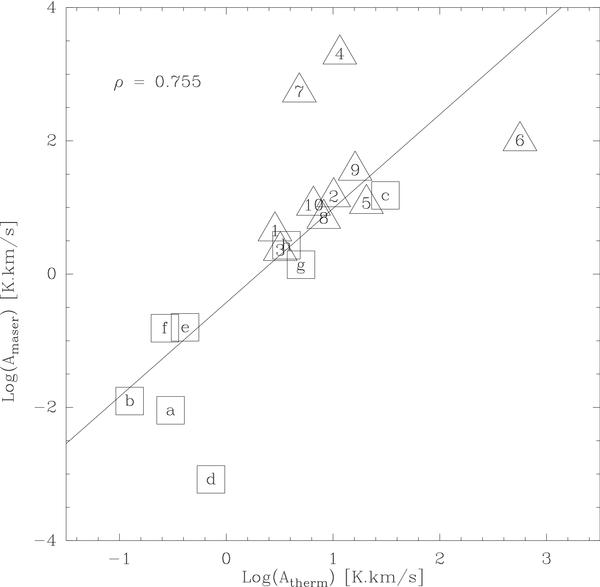
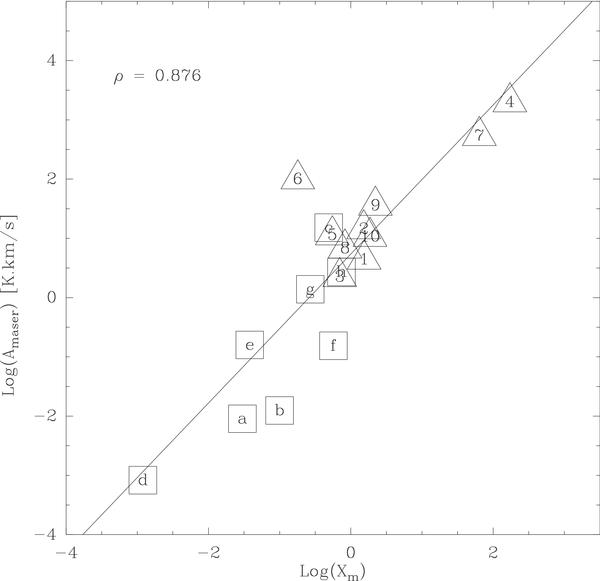
Fig. 6
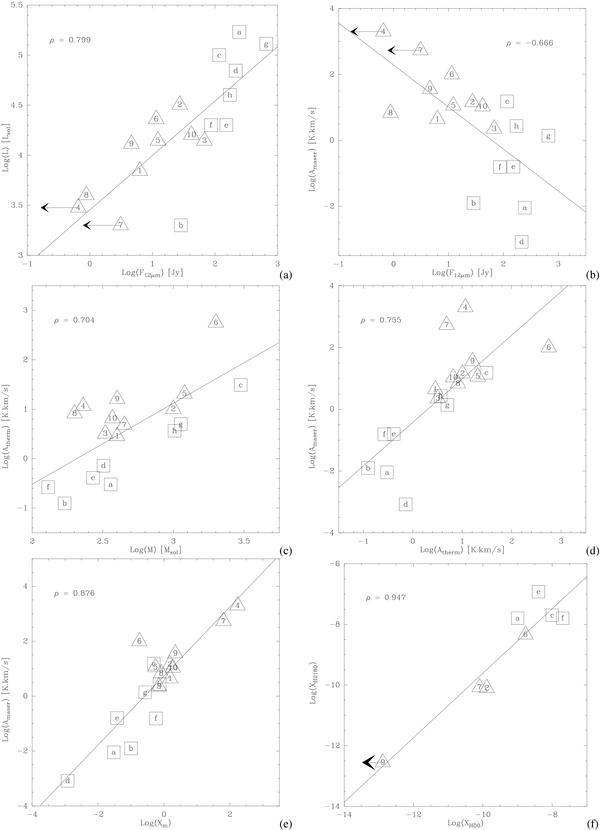
Correlation plots between a) monochromatic luminosities at 12 m and
source luminosity; b) monochromatic luminosities at 12 m and maser
component of CH3OH emission line; c) masses of HMPOs and the
thermal component of CH3OH emission lines; d) the thermal
and the maser component of CH3OH emission lines; e) the
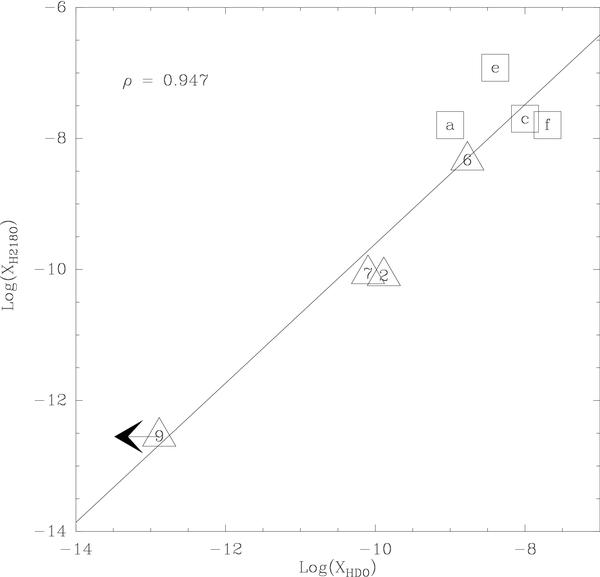
maser-to-thermal emission ratio and the maser emission; f) the
molecular abundances of HDO and H O. Sources of our sample are labelled with numbers (1
to 10), sources studied by van der Tak et al.
(2006) are labelled with letters (a to h). Solid line: best linear fit
obtained with a least squares method.
O. Sources of our sample are labelled with numbers (1
to 10), sources studied by van der Tak et al.
(2006) are labelled with letters (a to h). Solid line: best linear fit
obtained with a least squares method.
 (a)
(a)
 (b)
(b)
 (c)
(c)
 (d)
(d)
 (e)
(e)
 (f)
(f)
Current usage metrics show cumulative count of Article Views (full-text article views including HTML views, PDF and ePub downloads, according to the available data) and Abstracts Views on Vision4Press platform.
Data correspond to usage on the plateform after 2015. The current usage metrics is available 48-96 hours after online publication and is updated daily on week days.
Initial download of the metrics may take a while.