Fig. 2
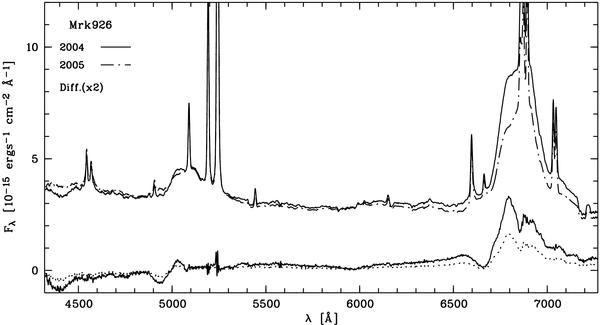
Mean spectra of Mrk 926 taken in the years 2004 (solid line) and 2005 (dash-dotted line). The difference spectrum between the two observing campaigns is shown at the bottom (dotted line). It has been scaled by a factor of 2 (solid line) to enhance the contrast between features.
Current usage metrics show cumulative count of Article Views (full-text article views including HTML views, PDF and ePub downloads, according to the available data) and Abstracts Views on Vision4Press platform.
Data correspond to usage on the plateform after 2015. The current usage metrics is available 48-96 hours after online publication and is updated daily on week days.
Initial download of the metrics may take a while.