Fig. 14
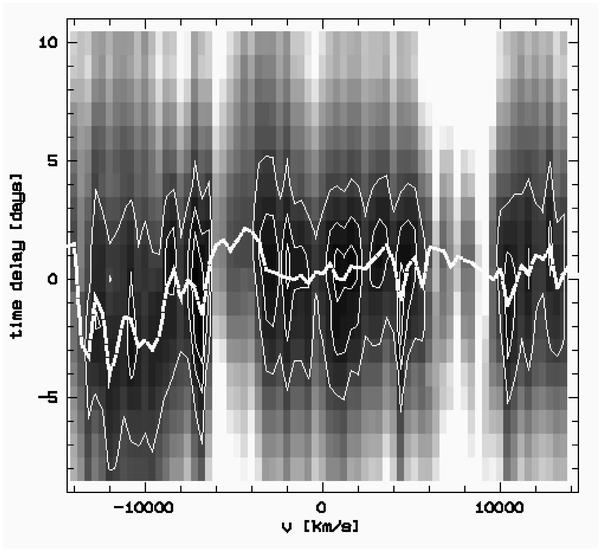
The 2-D CCF(τ,v) shows the correlation of the Hβ line segment light curves with the continuum light curve at 5180 Å as a function of velocity and time delay (grey scale). Contours of the correlation coefficient are overplotted at levels of 0.93, 0.89, and 0.80 (solid lines). The heavy dashed line connects the centers of all individual cross-correlation functions.
Current usage metrics show cumulative count of Article Views (full-text article views including HTML views, PDF and ePub downloads, according to the available data) and Abstracts Views on Vision4Press platform.
Data correspond to usage on the plateform after 2015. The current usage metrics is available 48-96 hours after online publication and is updated daily on week days.
Initial download of the metrics may take a while.