Fig. 9
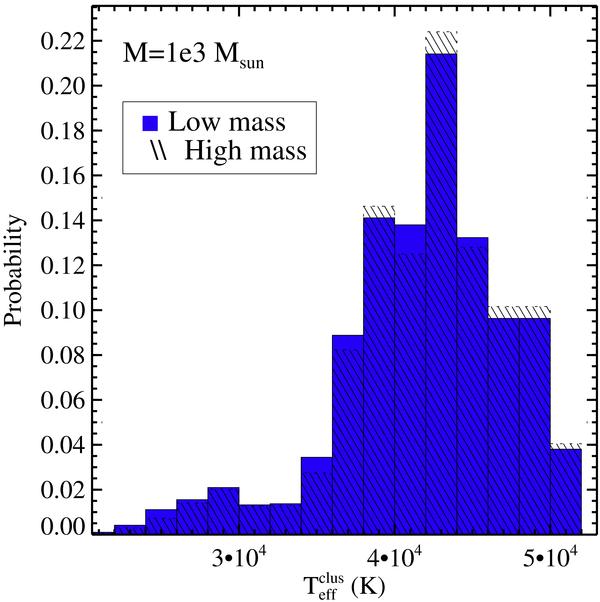
Distribution of  for simulations
with
900 M⊙ ≤ Mclus ≤ 1.1 ×
103 M⊙ obtained from the low-mass
cluster set (4091 simulations) and
103 M⊙ ≤ Mclus ≤ 1.1 ×
103 M⊙, obtained from the high-mass
cluster set (90 621 simulations).
for simulations
with
900 M⊙ ≤ Mclus ≤ 1.1 ×
103 M⊙ obtained from the low-mass
cluster set (4091 simulations) and
103 M⊙ ≤ Mclus ≤ 1.1 ×
103 M⊙, obtained from the high-mass
cluster set (90 621 simulations).
Current usage metrics show cumulative count of Article Views (full-text article views including HTML views, PDF and ePub downloads, according to the available data) and Abstracts Views on Vision4Press platform.
Data correspond to usage on the plateform after 2015. The current usage metrics is available 48-96 hours after online publication and is updated daily on week days.
Initial download of the metrics may take a while.