Fig. 7
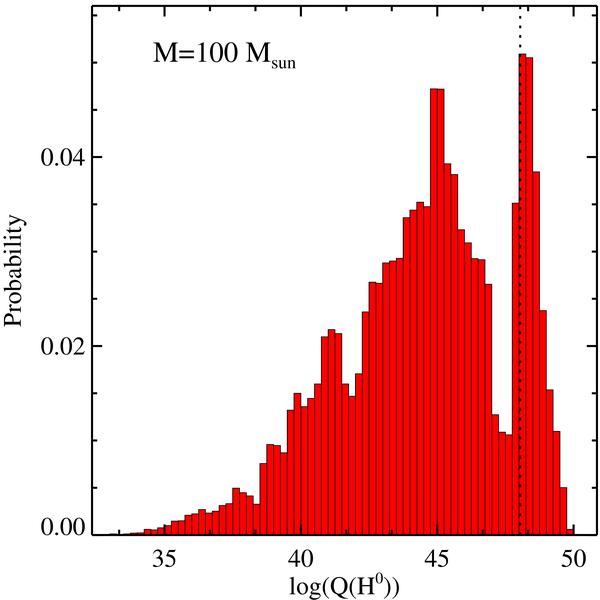
Distribution of log Q(H0) for simulations with 90 M⊙ ≤ Mclus ≤ 110 M⊙ obtained from the low mass cluster set. The probabilities were computed using the simulations in the given mass range (40 502 simulations) and found to have a small dependence on the ICMF. The vertical line shows the mean ⟨Q(H0)⟩ value (log ⟨Q(H0)⟩ = 48.04 of the distribution.
Current usage metrics show cumulative count of Article Views (full-text article views including HTML views, PDF and ePub downloads, according to the available data) and Abstracts Views on Vision4Press platform.
Data correspond to usage on the plateform after 2015. The current usage metrics is available 48-96 hours after online publication and is updated daily on week days.
Initial download of the metrics may take a while.