Fig. 6
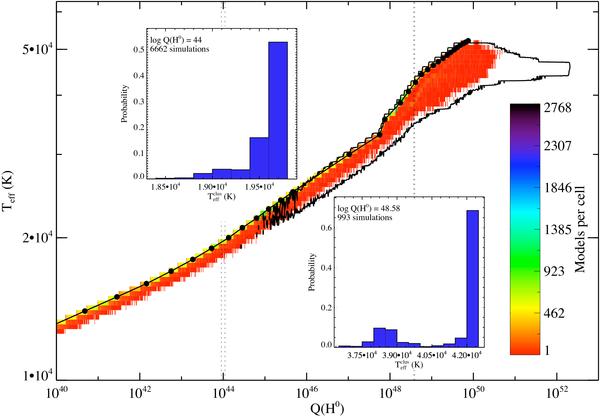
Color-coded distribution of the cluster ionizing
flux (Q(H0)) and  for the low- and high-mass cluster set. The shaded contour represents the low-mass
cluster set, the solid-line contour the high-mass cluster set. A strong correlation
between both quantities is seen for the low-mass cluster set case. The same
corelation can be seen in the lower part of the distribution of the high mass set,
and is lost in the upper part, where the distribution tends to the
asymptotic . The insets show the
histograms of the distribution for two
values of Q(H0). The range
in Q(H0) for those histograms are marked with vertical
dotted lines. As a reference, we also plot the
for the low- and high-mass cluster set. The shaded contour represents the low-mass
cluster set, the solid-line contour the high-mass cluster set. A strong correlation
between both quantities is seen for the low-mass cluster set case. The same
corelation can be seen in the lower part of the distribution of the high mass set,
and is lost in the upper part, where the distribution tends to the
asymptotic . The insets show the
histograms of the distribution for two
values of Q(H0). The range
in Q(H0) for those histograms are marked with vertical
dotted lines. As a reference, we also plot the  reference scale
(line with symbols).
reference scale
(line with symbols).
Current usage metrics show cumulative count of Article Views (full-text article views including HTML views, PDF and ePub downloads, according to the available data) and Abstracts Views on Vision4Press platform.
Data correspond to usage on the plateform after 2015. The current usage metrics is available 48-96 hours after online publication and is updated daily on week days.
Initial download of the metrics may take a while.