Fig. 5
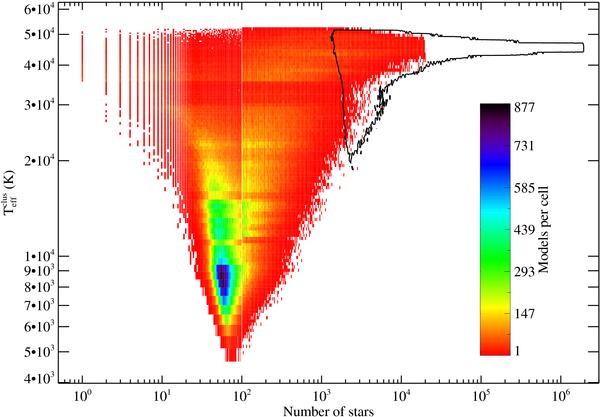
The color-coded area represents the (Nclus,
 ) distribution of the
low-mass cluster set. The solid-line contour, extending
to Nclus larger than 105, shows the
distribution of the high-mass cluster set. The vertical discontinuity that appears
at Nclus = 102 is a visual artifact caused by
a change from linear binning to logarithmic binning.
) distribution of the
low-mass cluster set. The solid-line contour, extending
to Nclus larger than 105, shows the
distribution of the high-mass cluster set. The vertical discontinuity that appears
at Nclus = 102 is a visual artifact caused by
a change from linear binning to logarithmic binning.
Current usage metrics show cumulative count of Article Views (full-text article views including HTML views, PDF and ePub downloads, according to the available data) and Abstracts Views on Vision4Press platform.
Data correspond to usage on the plateform after 2015. The current usage metrics is available 48-96 hours after online publication and is updated daily on week days.
Initial download of the metrics may take a while.