Free Access
Fig. 4
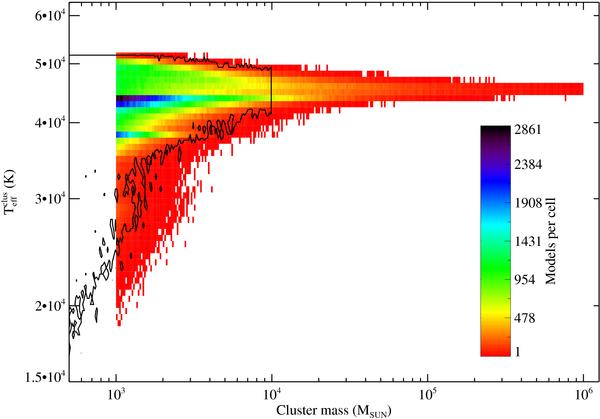
The color-coded area shows the  distribution for the
high-mass cluster set. The solid-line contour on the left,
reaching Mclus lower than
103 M⊙, corresponds to the low-mass
cluster set (cf. Fig. 3).
distribution for the
high-mass cluster set. The solid-line contour on the left,
reaching Mclus lower than
103 M⊙, corresponds to the low-mass
cluster set (cf. Fig. 3).
Current usage metrics show cumulative count of Article Views (full-text article views including HTML views, PDF and ePub downloads, according to the available data) and Abstracts Views on Vision4Press platform.
Data correspond to usage on the plateform after 2015. The current usage metrics is available 48-96 hours after online publication and is updated daily on week days.
Initial download of the metrics may take a while.