Fig. 3
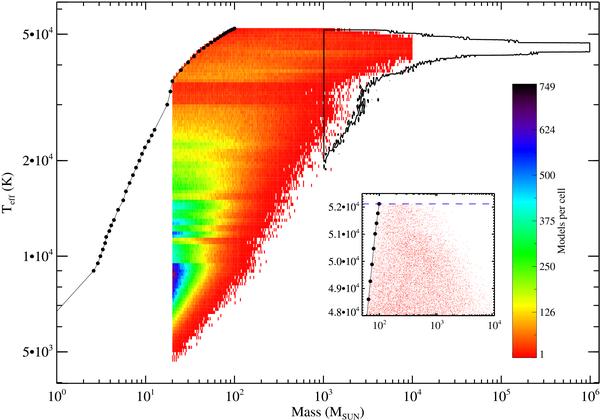
The color-coded area shows the  distribution for the
low-mass cluster set. The solid line with dots on the left of the plot is the
distribution for the
low-mass cluster set. The solid line with dots on the left of the plot is the
 reference
scale plotted in Fig. 1. Note that the stellar
reference
scale defines the low mass limit of the
distribution. The solid-line contour on the right of the plot, reaching
Mclus higher than
104 M⊙, corresponds to the simulations
of the high-mass cluster set (cf. Fig. 4). The
inner box shows a detail of the region around
100 M⊙, where the maximum value of the
cluster
reference
scale plotted in Fig. 1. Note that the stellar
reference
scale defines the low mass limit of the
distribution. The solid-line contour on the right of the plot, reaching
Mclus higher than
104 M⊙, corresponds to the simulations
of the high-mass cluster set (cf. Fig. 4). The
inner box shows a detail of the region around
100 M⊙, where the maximum value of the
cluster  is reached.
Current usage metrics show cumulative count of Article Views (full-text article views including HTML views, PDF and ePub downloads, according to the available data) and Abstracts Views on Vision4Press platform.
Data correspond to usage on the plateform after 2015. The current usage metrics is available 48-96 hours after online publication and is updated daily on week days.
Initial download of the metrics may take a while.