Fig. 12
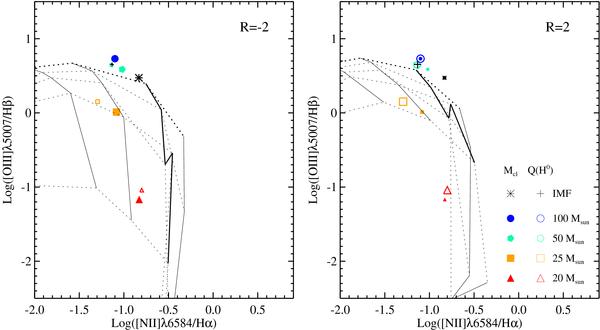
log ([O iii] 5007 Å/Hβ) vs. log ([N ii] 6584 Å/Hα) diagram for the individual-star zero-age solar metallicity simulations. The results are compared with the grid by Dopita et al. (2006) where dotted lines join points of equal ages, and filled lines join points with equal metallicity. Left: grid with logarithm of the ratio of the cluster mass to the ambient presure, ℛ, equals to −2, simulations with fixed Mclus = 100 M⊙ are plotted as large filled symbols (and models with fixed Q(H0) with small open ones). Right: grid with ℛ = 2, simulations with fixed log Q(H0) = 49.87 are plotted as large open symbols (and models with fixed Mclus with filled open ones).
Current usage metrics show cumulative count of Article Views (full-text article views including HTML views, PDF and ePub downloads, according to the available data) and Abstracts Views on Vision4Press platform.
Data correspond to usage on the plateform after 2015. The current usage metrics is available 48-96 hours after online publication and is updated daily on week days.
Initial download of the metrics may take a while.