Fig. 6
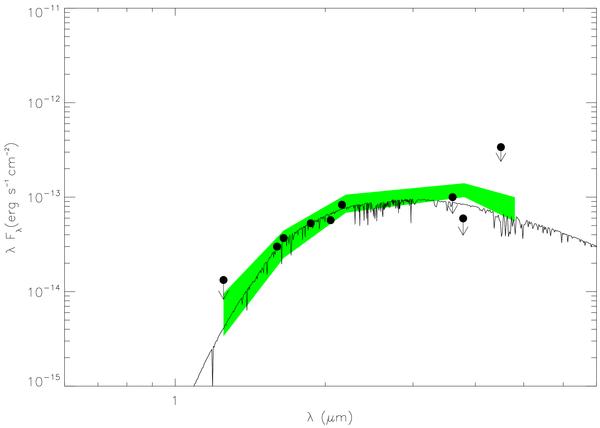
Observed spectral energy distribution of TMR-1C (filled black circles, based on Table 1 and on values reported in T98; filled black circles with downward-heading arrows indicate upper 3σ flux limits). The black solid line represents the spectral energy distribution of a NEXTGen stellar model source (Hauschildt et al. 1999) with Teff = 4000 K, log g = 5.0 and extincted by AV = 23.0 mag. The shaded band indicates the range in flux distribution expected for objects of 3–7 MJup at the age of 1 Myr and seen behind AV = 10–22 mag of extinction, which are consistent overall with the observed SED of TMR-1C for λ < 2.5 μm.
Current usage metrics show cumulative count of Article Views (full-text article views including HTML views, PDF and ePub downloads, according to the available data) and Abstracts Views on Vision4Press platform.
Data correspond to usage on the plateform after 2015. The current usage metrics is available 48-96 hours after online publication and is updated daily on week days.
Initial download of the metrics may take a while.