| Issue |
A&A
Volume 521, October 2010
|
|
|---|---|---|
| Article Number | A42 | |
| Number of page(s) | 13 | |
| Section | Galactic structure, stellar clusters, and populations | |
| DOI | https://doi.org/10.1051/0004-6361/201014756 | |
| Published online | 19 October 2010 | |
Towards a census of the Galactic anticentre star clusters: colour-magnitude diagram and structural analyses of a sample of 50 objects
D. Camargo - C. Bonatto - E. Bica
Universidade Federal do Rio Grande do Sul,
Departamento de Astronomia, CP 15051, RS, Porto Alegre
91501-970, Brazil
Received 8 April 2010 / Accepted 13 June
2010
Abstract
Aims. In this work we investigate the nature of
50 overdensities from the catalogue of Froebrich, Scholz, and
Raftery (FSR) projected towards the Galactic anticentre, in the sector ![]() .
The sample contains candidates with
.
The sample contains candidates with ![]() classified by FSR as probable open cluster (OC) and labelled with
quality flags 2 and 3. Our main purpose is to determine the nature of
these OC candidates and the fraction of these objects that are unknown
OCs, as well as to derive astrophysical parameters (age, reddening,
distance, core and cluster radii) for the clusters and to investigate
the relationship among parameters.
classified by FSR as probable open cluster (OC) and labelled with
quality flags 2 and 3. Our main purpose is to determine the nature of
these OC candidates and the fraction of these objects that are unknown
OCs, as well as to derive astrophysical parameters (age, reddening,
distance, core and cluster radii) for the clusters and to investigate
the relationship among parameters.
Methods. The analysis is based on 2MASS J,
(J-H), and ![]() colour-magnitude diagrams (CMDs), and stellar radial density profiles
(RDPs) built with decontamination tools. The tools are a field star
decontamination algorithm, used to uncover the cluster's intrinsic CMD
morphology, and colour-magnitude filters to isolate stars with a high
probability of being cluster members.
colour-magnitude diagrams (CMDs), and stellar radial density profiles
(RDPs) built with decontamination tools. The tools are a field star
decontamination algorithm, used to uncover the cluster's intrinsic CMD
morphology, and colour-magnitude filters to isolate stars with a high
probability of being cluster members.
Results. Out of the 50 objects, 16 (![]() )
are star clusters. We show that 9 (
)
are star clusters. We show that 9 (![]() )
overdensities are new OCs (FSR 735, FSR 807,
FSR 812, FSR 826, FSR 852, FSR 904,
FSR 941, FSR 953, and FSR 955)
and 7 (
)
overdensities are new OCs (FSR 735, FSR 807,
FSR 812, FSR 826, FSR 852, FSR 904,
FSR 941, FSR 953, and FSR 955)
and 7 (![]() )
are previously studied or catalogued OCs (KKC1, FSR 795, Cz
22, FSR 828, FSR 856, Cz 24, and NGC 2234). These are
OCs with ages in the range 5 Myr to 1 Gyr, at
distances from the Sun
)
are previously studied or catalogued OCs (KKC1, FSR 795, Cz
22, FSR 828, FSR 856, Cz 24, and NGC 2234). These are
OCs with ages in the range 5 Myr to 1 Gyr, at
distances from the Sun ![]() and Galactocentric distances
and Galactocentric distances ![]() .
We also derive parameters for the previously analysed OCs
Cz 22 and NGC 2234. Five (
.
We also derive parameters for the previously analysed OCs
Cz 22 and NGC 2234. Five (![]() )
candidates are classified as uncertain cases, and the remaining objects
are probable field fluctuations.
)
candidates are classified as uncertain cases, and the remaining objects
are probable field fluctuations.
Key words: galaxies: clusters: general - Galaxy: stellar content - Galaxy: structure
1 Introduction
It is currently accepted that star formation occurs mainly in clustered
environments, such as clusters and associations, rather than in
isolation. However, only a very small fraction of old stars are found
in bound clusters (Lamers
& Gieles 2006; Lamers et al. 2005). On
the other hand, de Wit et al.
(2005) estimate that nearly ![]() of the Galactic O star population is located in clusters or OB
associations, or can be kinematically linked with them. In this sense,
these structures can be thought of as the fundamental units of star
formation in the Galaxy (Lada 2007).
of the Galactic O star population is located in clusters or OB
associations, or can be kinematically linked with them. In this sense,
these structures can be thought of as the fundamental units of star
formation in the Galaxy (Lada 2007).
The spatial and age distribution of clusters has also played a vital role in our understanding of the Galactic structure. In this context, young open clusters (OCs) are important tracers of recent star formation in galaxies and of the spiral structure in galactic disks (Lada & Lada 2003). On the other hand, old OCs are excellent probes of early disk evolution, and they provide tracers of the structure, kinematics, and chemistry of the Galactic disk (Friel 1995).
Primordial conditions during cluster formation and the location of the parental molecular cloud in the Galaxy play an important role in the fate of a cluster (Schilbach et al. 2006). However, the stellar content of a cluster evolves with time, and internal and external interactions affect the properties of individual cluster members (e.g. orbit and spatial location), as well as of the whole cluster as a system (e.g. mass and structure). A thorough review of young clusters, focussing particularly on the evolution of the massive ones, can be found in Portegies Zwart et al. (2010).
The age distribution of star clusters in the Galactic disk can
only be explained if they disrupt on a timescale of a few times 108 yr
(Lamers & Gieles 2006,
and references therein). Lada &
Lada (2003) estimate that, in the solar neighbourhood, less
than ![]()
![]() of the clusters formed in giant molecular clouds (GMCs) are able to
reach ages beyond 100 Myr, and less than
of the clusters formed in giant molecular clouds (GMCs) are able to
reach ages beyond 100 Myr, and less than ![]() survive longer than
survive longer than ![]() 10 Myr
(infant mortality). Oort
(1957) noticed that the distribution of OCs in the solar
neighbourhood, as a function of age, shows a lack of old OCs and
derived statistically that Galactic clusters disrupt on a timescale of
10 Myr
(infant mortality). Oort
(1957) noticed that the distribution of OCs in the solar
neighbourhood, as a function of age, shows a lack of old OCs and
derived statistically that Galactic clusters disrupt on a timescale of ![]() yr.
This lack of old clusters can be partially explained by the rapid
fading of clusters with age due to stellar evolution, which makes it
harder to observe them at older ages. However, fading cannot explain
the difference between the observed and the expected number of old OCs,
implying that a significant fraction must have been destroyed. Wielen (1971) derived a mean
dissolution time of 200 Myr from the age distribution of
clusters with mass range
yr.
This lack of old clusters can be partially explained by the rapid
fading of clusters with age due to stellar evolution, which makes it
harder to observe them at older ages. However, fading cannot explain
the difference between the observed and the expected number of old OCs,
implying that a significant fraction must have been destroyed. Wielen (1971) derived a mean
dissolution time of 200 Myr from the age distribution of
clusters with mass range ![]() about 1 kpc from the Sun (see also Gieles et al. 2007; Lamers &
Gieles 2006).
about 1 kpc from the Sun (see also Gieles et al. 2007; Lamers &
Gieles 2006).
Star clusters gradually lose mass and, because of the combined
effect of several disruption mechanisms![]() ,
they generally end completely destroyed or leave remnants (Pavani & Bica 2007, and
references therein). As a consequence, only the more massive OCs (which
are essentially gravitationally bound) and those located at large
Galactic radii (where the probability of encounters with GMCs is lower)
can live a few Gyr (Bergond
et al. 2001).
,
they generally end completely destroyed or leave remnants (Pavani & Bica 2007, and
references therein). As a consequence, only the more massive OCs (which
are essentially gravitationally bound) and those located at large
Galactic radii (where the probability of encounters with GMCs is lower)
can live a few Gyr (Bergond
et al. 2001).
Most of the young star clusters dissolve very early because the primordial gas is removed on a timescale shorter than a crossing time, by winds of massive OB stars and supernova explosions (Tutukov 1978). This mechanism strongly depends on the effective star formation efficiency, but appears to be independent of the initial cluster mass (Gieles et al. 2005).
Open clusters are born within GMCs and remain embedded in the clouds for about 2-5 Myr. During formation and the earliest stages of evolution, they are often completely invisible at optical wavelengths, since they are only detected in the infrared because of heavy obscuration by gas and dust (Lada & Lada 2003). The recent development of infrared array detectors has provided an important impulse to our knowledge of these objects.
In the present work we investigate the nature of 50 stellar
overdensities from the catalogue of Froebrich
et al. (2007) towards the Galactic anticentre, in
the sector (
![]() ),
classified by them as probable OC and labelled with quality
flags 2 and 3 (Table 1).
),
classified by them as probable OC and labelled with quality
flags 2 and 3 (Table 1).
Table 1: General data on the FSR star cluster candidates.
This paper is organised as follows. In Sect. 2 we present the OC candidates. In Sect. 3 we present the 2MASS photometry and discuss the methods and tools employed in the CMD analyses, especially the field star decontamination algorithm. Section 4 is dedicated to the discussion of the methods and tools used for the analysis of cluster structure. In Sect. 5 we present the results of our analyses of the OC candidates, and derive astrophysical parameters (age, reddening, distance, core and cluster radii) of the confirmed OCs and two previously studied objects. In Sect. 6 we estimate the cluster mass stored in stars. In Sect. 7 we discuss the results and investigate the relationship between derived parameters. Finally, in Sect. 8 we present concluding remarks.
2 The OC candidates
Froebrich et al. (2007)
have published a catalogue of 1021 star cluster candidates with ![]() and all Galactic longitudes. They identify overdensities in the 2MASS
database that are classified according to a quality flag,
with 0 and 1 for the most probable star clusters and
2-5 for possible star clusters. Bica
et al. (2008a) explored FSR overdensities, with
quality flags 0 and 1, in bulge/disk directions at
and all Galactic longitudes. They identify overdensities in the 2MASS
database that are classified according to a quality flag,
with 0 and 1 for the most probable star clusters and
2-5 for possible star clusters. Bica
et al. (2008a) explored FSR overdensities, with
quality flags 0 and 1, in bulge/disk directions at ![]() .
The sample consisted of 20 star cluster candidates and
resulted in 4 new, 2 previously known OCs,
5 uncertain cases, and 9 probable field fluctuations.
Bonatto & Bica (2008b)
analysed 28 FSR cluster candidates projected nearly towards
the anti-centre (
.
The sample consisted of 20 star cluster candidates and
resulted in 4 new, 2 previously known OCs,
5 uncertain cases, and 9 probable field fluctuations.
Bonatto & Bica (2008b)
analysed 28 FSR cluster candidates projected nearly towards
the anti-centre (
![]() )
and confirm 6 new and 9 previously known OCs,
6 uncertain cases, and 7 probable fluctuations of the
stellar field.
)
and confirm 6 new and 9 previously known OCs,
6 uncertain cases, and 7 probable fluctuations of the
stellar field.
Table 2: Cross-identification of the open clusters.
![\begin{figure}
\par\mbox{\includegraphics[scale=0.55,viewport=0 0 470 460,clip]{...
...degraphics[scale=0.55,viewport=0 0 470 460,clip]{14756fg1b.eps} }
\end{figure}](/articles/aa/full_html/2010/13/aa14756-10/img41.png)
|
Figure 1:
Left panel: |
| Open with DEXTER | |
![\begin{figure}
\par\mbox{\includegraphics[width=8cm,clip]{14756fg2a.eps}\includegraphics[width=8cm,clip]{14756fg2b.eps} }\end{figure}](/articles/aa/full_html/2010/13/aa14756-10/img42.png)
|
Figure 2:
Left panel: 2MASS K image
|
| Open with DEXTER | |
Table 3: Field star decontamination statistics.
The present FSR overdensity sample is listed in Table 1. Some of these
objects have previous identifications (Table 2). The Koposov et al. (2008)
analysis of CMDs for 5 clusters is showed in Table 2. They concluded that
FSR 795 (Koposov 10), Cz 22,
FSR 828 (Koposov 43), FSR 856
(Koposov 53) and Cz 24 are clusters. The derived
parameters for them and the present ones (Tables 3 and 4) agree well. Kumar et al. (2006)
studied KKC1 (FSR 788) and found that it is a cluster (Sect. 5). We derive
parameters for the previously catalogued OCs Cz 22 and
NGC 2234. Yadav &
Sagar (2004) derived for Cz 22 a radius of 1.8![]() ,
metallicity of 0.08,
,
metallicity of 0.08, ![]() ,
age of the
,
age of the ![]() Myr
and
Myr
and ![]() kpc.
NGC2234 does not have parameters derived so far.
kpc.
NGC2234 does not have parameters derived so far.
Some clusters are seen in visible bands (Fig. 1), while others are essentially infrared objects (Fig. 2).
3 2MASS photometry
2MASS![]() photometry (Skrutskie et al. 2006)
in the J, H,
and
photometry (Skrutskie et al. 2006)
in the J, H,
and ![]() bands was extracted in circular regions centred on the coordinates of
the FSR objects using VizieR
bands was extracted in circular regions centred on the coordinates of
the FSR objects using VizieR![]() .
Wide extraction areas are essential for producing RDPs (Sect. 4) with a high
contrast against the background and for a consistent field-star
decontamination (Sect. 3.1).
We started by assuming the FSR coordinates to centre the photometry
extraction. Next, we computed the RDP (Sect. 4) to check cluster
centring. In some cases the RDP built with the original FSR coordinates
presented a dip at the centre. Then, new central coordinates are
searched (after
field-star decontamination - Sect. 3.1) to maximise
the star-counts in the innermost RDP bin (e.g. Bonatto
& Bica 2009c).
.
Wide extraction areas are essential for producing RDPs (Sect. 4) with a high
contrast against the background and for a consistent field-star
decontamination (Sect. 3.1).
We started by assuming the FSR coordinates to centre the photometry
extraction. Next, we computed the RDP (Sect. 4) to check cluster
centring. In some cases the RDP built with the original FSR coordinates
presented a dip at the centre. Then, new central coordinates are
searched (after
field-star decontamination - Sect. 3.1) to maximise
the star-counts in the innermost RDP bin (e.g. Bonatto
& Bica 2009c).
3.1 Field-star decontamination
To uncover the intrinsic CMD morphology from the background stars, we
applied the field-star decontamination procedure. This algorithm works
on a statistical basis by measuring the relative number densities of
probable cluster and field stars in cubic CMD cells that have axes
along the J, (J-H)
and ![]() magnitude and colours. These are the colours that provide the maximum
distinction among CMD sequences for star clusters of different ages
(e.g. Bonatto et al. 2004).
magnitude and colours. These are the colours that provide the maximum
distinction among CMD sequences for star clusters of different ages
(e.g. Bonatto et al. 2004).
The algorithm (i) divides the full range of magnitude and
colours of a given CMD into a 3D grid; (ii) computes the
expected number-density of field stars in each cell based on the number
of comparison field stars (within ![]() Poisson fluctuation) with magnitude and colours compatible with those
of the cell; and (iii) subtracts from each cell a number of stars that
correspond to the number-density of field stars measured within the
same cell in the comparison field. This method is sensitive to local
variations in field star contamination with magnitude and colours. Cell
dimensions are
Poisson fluctuation) with magnitude and colours compatible with those
of the cell; and (iii) subtracts from each cell a number of stars that
correspond to the number-density of field stars measured within the
same cell in the comparison field. This method is sensitive to local
variations in field star contamination with magnitude and colours. Cell
dimensions are ![]() ,
and
,
and ![]() ,
which are adequate to allow sufficient star-count statistics in
individual cells and preserve the morphology of the CMD evolutionary
sequences. The dimensions of the colour/magnitude cells can be changed
so that the total number of stars subtracted throughout the whole
cluster area matches the expected one, within the
,
which are adequate to allow sufficient star-count statistics in
individual cells and preserve the morphology of the CMD evolutionary
sequences. The dimensions of the colour/magnitude cells can be changed
so that the total number of stars subtracted throughout the whole
cluster area matches the expected one, within the ![]() Poisson
fluctuation. We provide here only a brief description of the
decontamination procedure. For details see Bonatto
& Bica (2007a) and Bica
et al. (2008a).
Poisson
fluctuation. We provide here only a brief description of the
decontamination procedure. For details see Bonatto
& Bica (2007a) and Bica
et al. (2008a).
The decontamination algorithm provides the parameters ![]() ,
,
![]() ,
,
![]() ,
,
![]() ,
and
,
and ![]() (Bica et al. 2008a),
where
(Bica et al. 2008a),
where ![]() is the number of observed stars within the spatial region sampled in
the CMD,
is the number of observed stars within the spatial region sampled in
the CMD, ![]() represents the number of probable members after decontamination, and
the parameter
represents the number of probable members after decontamination, and
the parameter ![]() gives a measure of the statistical significance of the decontaminated
number of stars, and corresponds to the ratio of the number of stars in
the decontaminated CMD with respect to the
gives a measure of the statistical significance of the decontaminated
number of stars, and corresponds to the ratio of the number of stars in
the decontaminated CMD with respect to the ![]() Poisson fluctuation measured in the observed CMD. By definition, CMDs
of overdensities must have
Poisson fluctuation measured in the observed CMD. By definition, CMDs
of overdensities must have ![]() .
It is expected that CMDs of star clusters have integrated
.
It is expected that CMDs of star clusters have integrated ![]() that is significantly higher than 1. The
that is significantly higher than 1. The ![]() values for the present sample are given in Col. 5 of
Table 3,
and
values for the present sample are given in Col. 5 of
Table 3,
and ![]() corresponds to the
corresponds to the ![]() Poisson fluctuation around the mean of the star counts measured in the
8 equal area sectors of the comparison field. Uniform
comparison fields present low values of
Poisson fluctuation around the mean of the star counts measured in the
8 equal area sectors of the comparison field. Uniform
comparison fields present low values of ![]() .
Ideally, star clusters should have
.
Ideally, star clusters should have ![]() higher than
higher than ![]()
![]() .
Finally,
.
Finally, ![]() measures the star-count uniformity in the comparison field.
measures the star-count uniformity in the comparison field.
Table 4: Derived fundamental parameters.
Since we usually work with comparison fields larger than the
cluster extractions, the correction for the different spatial areas
between field and cluster is expected to result in a fractional number
of probable field stars (
![]() )
in some cells. Before the cell-by-cell subtraction, the fractional
numbers are rounded off to the nearest integer, but limited to the
number of observed stars in each cell
)
in some cells. Before the cell-by-cell subtraction, the fractional
numbers are rounded off to the nearest integer, but limited to the
number of observed stars in each cell ![]() ,
where NI represents rounding off to the nearest integer. The global
effect is quantified by means of the difference between the expected
number of field stars in each cell (
,
where NI represents rounding off to the nearest integer. The global
effect is quantified by means of the difference between the expected
number of field stars in each cell (
![]() )
and the actual number of subtracted stars (
)
and the actual number of subtracted stars (
![]() ).
Summed over all cells, this quantity provides an estimate of the total
subtraction efficiency of the process,
).
Summed over all cells, this quantity provides an estimate of the total
subtraction efficiency of the process,
Ideally, the best results would be obtained for an efficiency
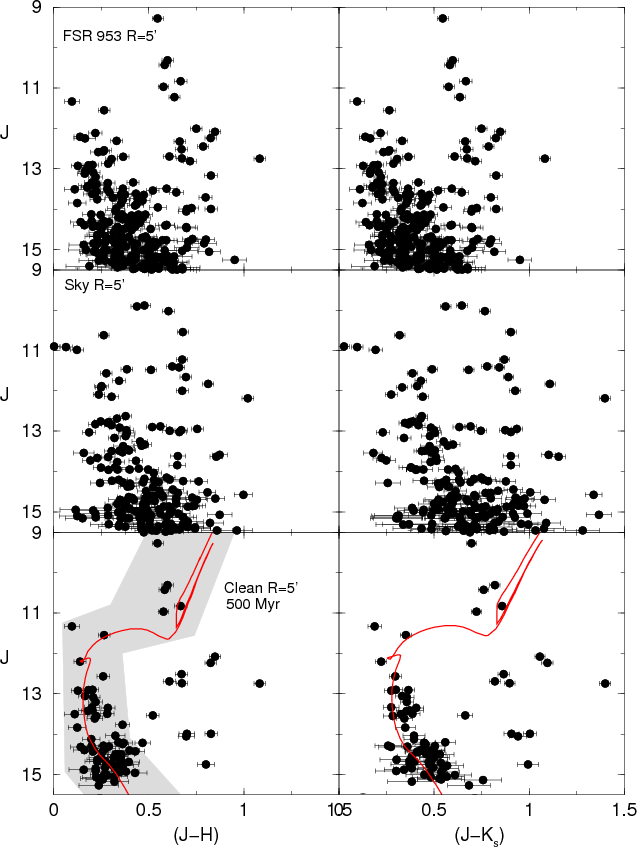
3.2 Fundamental parameters
The fundamental parameters are derived by means of the constraints
provided by the field-decontaminated CMD morphology, especially the
combined main sequence (MS) and pre-main sequence (PMS) star
distribution, for young OCs (Fig. 7).
The isochrones from the Padova group with solar metallicity (Girardi et al. 2002)
computed with the 2MASS J, H,
and ![]() filters are used to represent the MS. Isochrones of Siess et al. (2000) are
used to characterise the PMS sequences.
filters are used to represent the MS. Isochrones of Siess et al. (2000) are
used to characterise the PMS sequences.
|
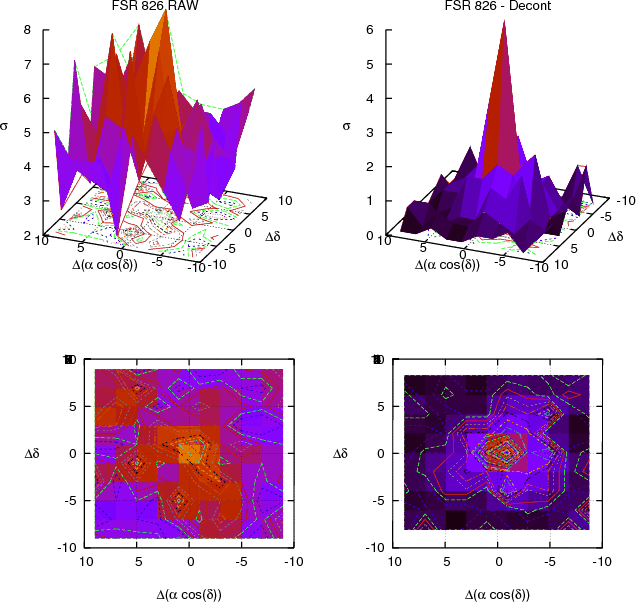
Figure 3:
Top panels: stellar surface-density |
| Open with DEXTER | |
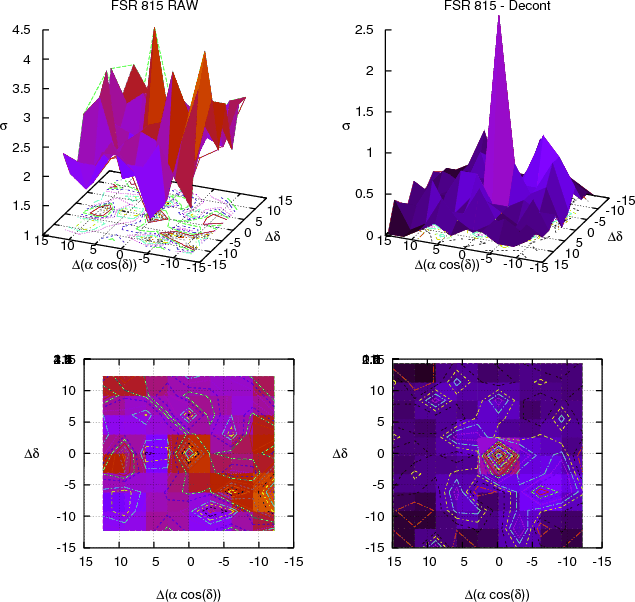
|
Figure 4: Same as Fig. 3 for the uncertain case FSR 815. |
| Open with DEXTER | |
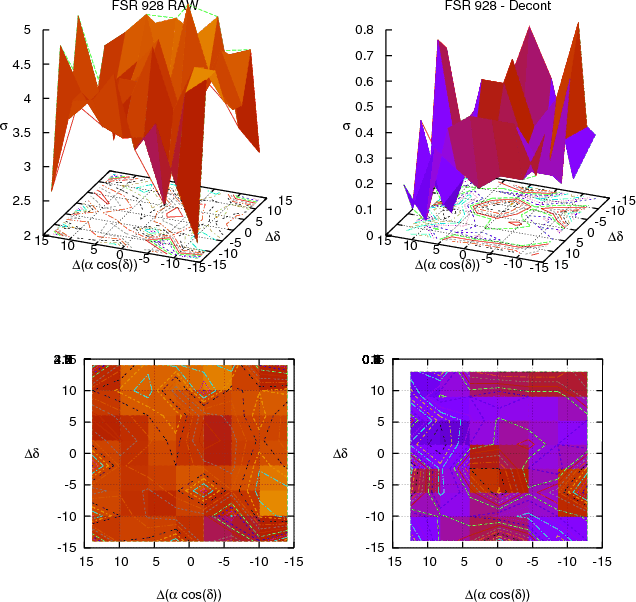
|
Figure 5: Same as Fig. 3 for the possible field fluctuation case FSR 928. |
| Open with DEXTER | |
|
Figure 6:
2MASS CMDs extracted from the R=5' region of FSR
953. Top panels: observed CMDs |
| Open with DEXTER | |
|
Figure 7:
2MASS CMDs extracted from the central region of FSR 812, FSR 826, FSR
807, FSR904, and FSR 955. Top panels: observed
CMDs |
| Open with DEXTER | |
|
Figure 8:
2MASS CMDs extracted from the central region of FSR 735, FSR 852,
NGC 2234, Cz 22, and FSR 941. Top panels:
observed CMDs |
| Open with DEXTER | |
|
Figure 9: Colour-colour diagrams with the decontaminated photometry of the young OCs in our sample, FSR 812, FSR 826, FSR 807, FSR 904, and FSR 955. Siess et al. (2000) isochrones and reddening vectors are used to characterise the PMS distribution. |
| Open with DEXTER | |
|
Figure 10:
Field-star decontaminated |
| Open with DEXTER | |
As summarised in Naylor &
Jeffries (2006), sophisticated approaches are available for
analytical CMD fitting, especially the MS. However, given the
poorly-populated MSs, the 2MASS photometric uncertainties for the
fainter stars, the important population of PMS stars, and the
differential reddening, we directly compared isochrones with the
decontaminated CMD morphology. The fits are made by eye, taking the
combined MS and PMS stellar distributions as constraints, and allowing
for variations due to photometric uncertainties and differential
reddening. Specifically, we start with the MS+PMS isochrone set for
zero distance modulus and reddening, and next we apply magnitude and
colour shifts until a satisfactory solution is reached. The young OCs
of this sample present a significant fraction of stars redder than the
youngest PMS isochrone. Most of this (
![]() )
excess towards the red is probably caused by differential reddening.
The best fits are superimposed on decontaminated CMDs (Figs. 6-8).
The isochrone fit gives the observed distance modulus (m-M)J
and reddening E(J-H),
which converts to E(B-V)
and AV
with the relations AJ/AV=0.276,
AH/AV=0.176,
)
excess towards the red is probably caused by differential reddening.
The best fits are superimposed on decontaminated CMDs (Figs. 6-8).
The isochrone fit gives the observed distance modulus (m-M)J
and reddening E(J-H),
which converts to E(B-V)
and AV
with the relations AJ/AV=0.276,
AH/AV=0.176,
![]() ,
,
![]() ,
and
,
and ![]() (Dutra et al. 2002),
assuming a constant total-to-selective absorption ratio RV=3.1.
We adopt the Sun's distance to the Galactic centre
(Dutra et al. 2002),
assuming a constant total-to-selective absorption ratio RV=3.1.
We adopt the Sun's distance to the Galactic centre ![]() (Bica et al. 2006) to
compute the Galactocentric distance (
(Bica et al. 2006) to
compute the Galactocentric distance (
![]() ).
The resulting E(B-V),
age,
).
The resulting E(B-V),
age, ![]() and
and ![]() are given in Cols. 4 to 7 of Table 4.
are given in Cols. 4 to 7 of Table 4.
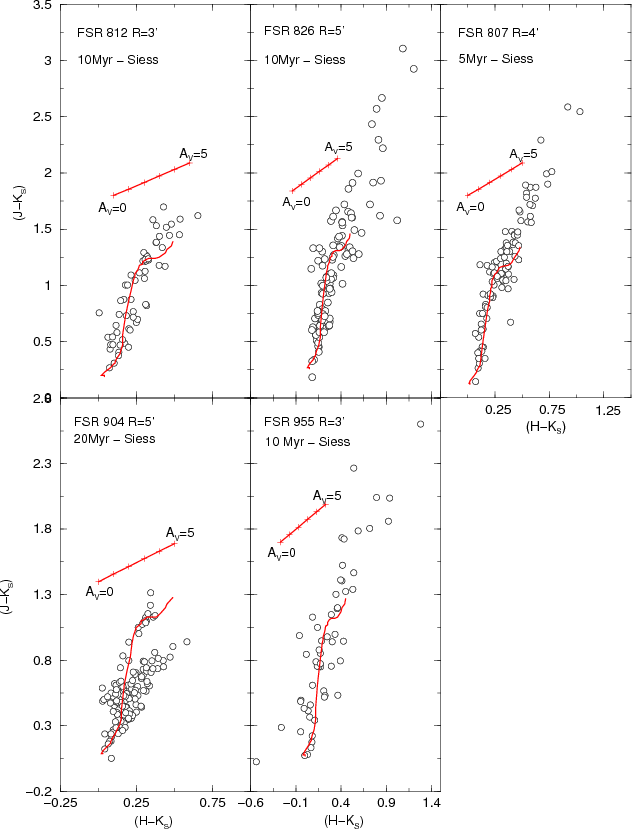
3.3 Colour-colour diagrams
Useful information on the nature of very young OCs can be obtained with
colour-colour diagrams. Since our very young OCs include PMS stars, we
show in Fig. 9
the decontaminated near-IR colour-colour diagram ![]() of the member stars, together with tracks of Siess
et al. (2000), set with the reddening values derived
above, to characterise the age. If PMS stars are present in the
cluster, it is expected that some stars present near-IR excess. As
expected from the CMDs of very young candidates (Fig. 7), a significant
number of the stars appear to be very reddened. Most stars have
of the member stars, together with tracks of Siess
et al. (2000), set with the reddening values derived
above, to characterise the age. If PMS stars are present in the
cluster, it is expected that some stars present near-IR excess. As
expected from the CMDs of very young candidates (Fig. 7), a significant
number of the stars appear to be very reddened. Most stars have ![]() colours close to the isochrone, within the uncertainties. Besides, most
of the very red PMS stars are displaced parallel to the respective
reddening vectors. However, few appear to present an abnormal excess in
colours close to the isochrone, within the uncertainties. Besides, most
of the very red PMS stars are displaced parallel to the respective
reddening vectors. However, few appear to present an abnormal excess in
![]() and
and
![]() ,
especially FSR 807, FSR 826, and FSR 955,
which may come from PMS stars still bearing circumstellar discs. The
cluster can be reddened by foreground, circumcluster cloud, and/or dust
around the PMS stars.
,
especially FSR 807, FSR 826, and FSR 955,
which may come from PMS stars still bearing circumstellar discs. The
cluster can be reddened by foreground, circumcluster cloud, and/or dust
around the PMS stars.
4 Structural parameters
Structural parameters are derived by means of the stellar radial density profile (RDP), which is the projected number of stars per area around the centre. RDPs are built with stars selected after applying the respective colour magnitude filter (CM filter) to the observed photometry. These tools isolate the most probable cluster sequences by excluding stars with discordant colours (e.g. Bonatto & Bica 2007a, and references therein). However, residual field stars with colours similar to those of the cluster are expected to remain inside the CM filter region. They affect the intrinsic stellar RDP to a degree that depends on the relative densities of field and cluster stars. The contribution of these residual field stars to the RDPs is statistically quantified by means of a comparison field. In practical terms, the use of the CM filters in cluster sequences enhances the contrast of the RDP to the background. The CM filters are shown in Figs. 6-8 as the shaded region superimposed on the decontaminated CMDs.
To avoid oversampling near the centre and undersampling for
large radii, the RDPs are built by counting stars in concentric rings
of increasing width with distance to the centre. The number and width
of rings are optimised so that the resulting RDPs have adequate spatial
resolution with moderate ![]() Poisson errors. The residual background level of each RDP corresponds
to the average number of CM-filtered stars measured in the comparison
field.
Poisson errors. The residual background level of each RDP corresponds
to the average number of CM-filtered stars measured in the comparison
field.
Usually, the RDPs of star clusters can be described by an
analytical profile, like the empirical, single mass, modified
isothermal spheres of King (1966)
and Wilson (1975), and the
power law with a core of Elson
et al. (1987). These functions are characterised by
different sets of parameters that are related to the cluster structure.
For simplicity and with the RDP error bars (Fig. 11), we adopt the
two-parameter function ![]() ,
where
,
where ![]() is the residual background density,
is the residual background density, ![]() the central density of stars, and
the central density of stars, and ![]() the core radius. Applied to star counts,
this function is similar to that used by King
(1962) to describe the surface brightness profiles in the
central parts of globular clusters. We also estimate the cluster radius
(
the core radius. Applied to star counts,
this function is similar to that used by King
(1962) to describe the surface brightness profiles in the
central parts of globular clusters. We also estimate the cluster radius
(
![]() )
by measuring the distance from the cluster centre where the RDP and
residual background are statistically indistinguishable (e.g. Bonatto & Bica 2007a).
The
)
by measuring the distance from the cluster centre where the RDP and
residual background are statistically indistinguishable (e.g. Bonatto & Bica 2007a).
The ![]() can be taken as an observational truncation radius, whose value depends
both on the radial distribution of member stars and the field density.
can be taken as an observational truncation radius, whose value depends
both on the radial distribution of member stars and the field density.
5 Results
The overdensities are classified into three groups, according to the photometric and RDP analyses.
5.1 Confirmed open clusters
This group includes the objects with well-defined decontaminated CMD
sequences (Figs. 6-8) with relatively
high values of the parameter ![]() ,
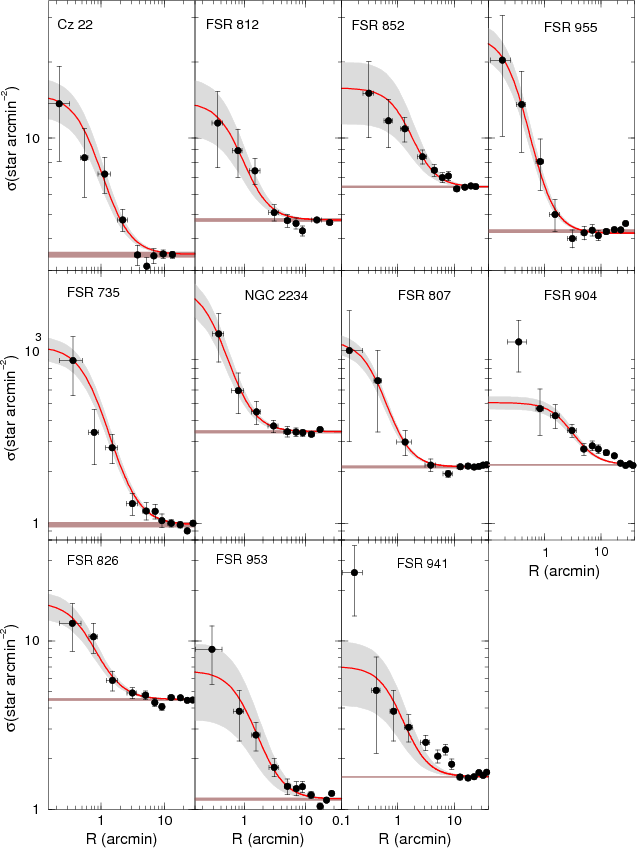
as well as King-like RDPs (Fig. 11). For young OCs
we also built colour-colour diagrams (Fig. 9). The astrophysical
parameters could be measured for these objects (Tables 4 and 5). The previously
unknown OCs are FSR 735, FSR 807, FSR 812,
FSR 826, FSR 852, FSR 904, FSR 941,
FSR 953, and FSR 955. We also derived parameters for
the previously catalogued OCs Cz 22 and NGC2234. KKC1 was confirmed as
an OC, but the parameters of this object will be analysed in a
forthcoming paper.
,
as well as King-like RDPs (Fig. 11). For young OCs
we also built colour-colour diagrams (Fig. 9). The astrophysical
parameters could be measured for these objects (Tables 4 and 5). The previously
unknown OCs are FSR 735, FSR 807, FSR 812,
FSR 826, FSR 852, FSR 904, FSR 941,
FSR 953, and FSR 955. We also derived parameters for
the previously catalogued OCs Cz 22 and NGC2234. KKC1 was confirmed as
an OC, but the parameters of this object will be analysed in a
forthcoming paper.
In Fig. 6
we present the ![]() and
and ![]() CMDs extracted from a region R=5' centred on the
optimised coordinates of the confirmed OC FSR 953
(top-panel). In the middle panels we show the comparison field
corresponding to a ring with the same area as the central region. In
the bottom panels we show the decontaminated CMDs with the
500 Myr Padova isochrones fitted.
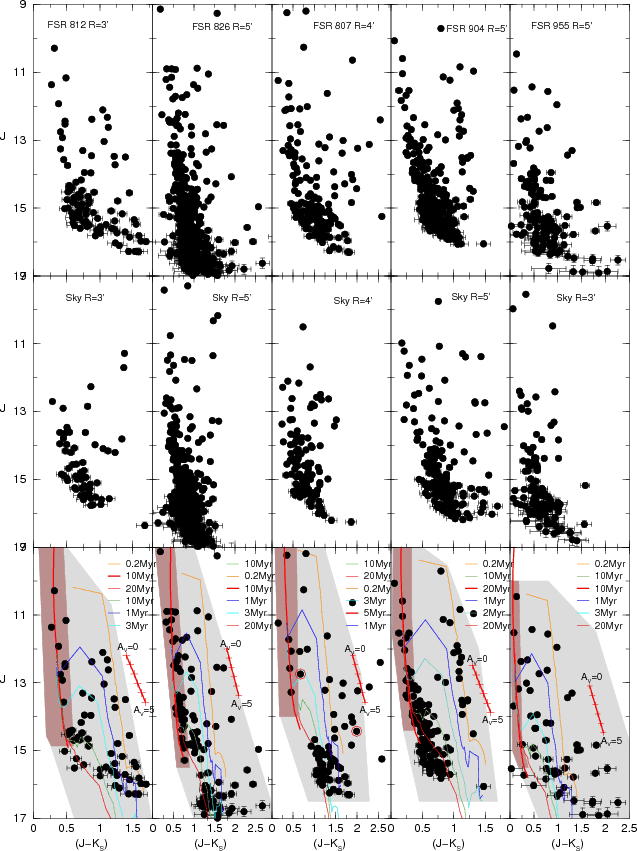
Figure 7
show
CMDs extracted from a region R=5' centred on the
optimised coordinates of the confirmed OC FSR 953
(top-panel). In the middle panels we show the comparison field
corresponding to a ring with the same area as the central region. In
the bottom panels we show the decontaminated CMDs with the
500 Myr Padova isochrones fitted.
Figure 7
show ![]() CMDs for the confirmed young OCs FSR 812, FSR 826,
FSR 807, FSR 904, and FSR 955. These objects
present important populations of PMS stars and, therefore, we also use
isochrones of Siess et al.
(2000). To examine differential reddening, we include
reddening vectors computed with the 2MASS ratios for visual absorptions
in the range AV=0
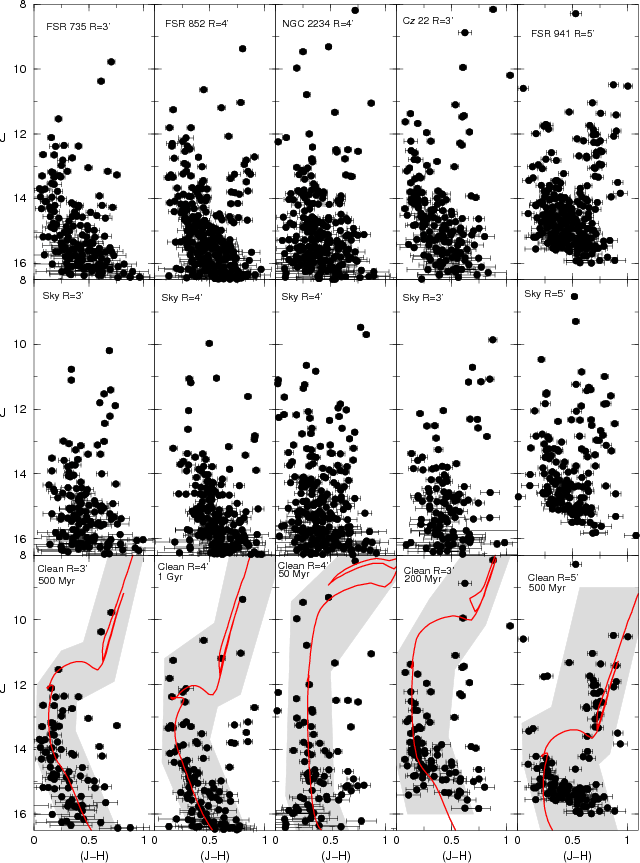
to 5. We present in Fig. 8
the
CMDs for the confirmed young OCs FSR 812, FSR 826,
FSR 807, FSR 904, and FSR 955. These objects
present important populations of PMS stars and, therefore, we also use
isochrones of Siess et al.
(2000). To examine differential reddening, we include
reddening vectors computed with the 2MASS ratios for visual absorptions
in the range AV=0
to 5. We present in Fig. 8
the ![]() CMDs for the remaining confirmed OCs FSR 735,
FSR 852, NGC 2234, Cz 22 and FSR 941.
In Fig. 11,
we present the RDPs of these objects, and in Table 5 we show the derived
structural parameters. We show in Table 6 integrated colours
and magnitudes for confirmed OCs.
CMDs for the remaining confirmed OCs FSR 735,
FSR 852, NGC 2234, Cz 22 and FSR 941.
In Fig. 11,
we present the RDPs of these objects, and in Table 5 we show the derived
structural parameters. We show in Table 6 integrated colours
and magnitudes for confirmed OCs.
Both FSR 904 and FSR 941 present a
conspicuous excess over the King-like profile in the innermost RDP bin.
This cusp has been detected in post-core collapse globular clusters (Trager et al. 1995) and
some Gyr-old OCs, such as NGC 3960 (Bonatto
& Bica 2006) and LK 10 (Bonatto & Bica 2009a).
It has been attributed to advanced dynamical evolution. With ![]() 500 Myr
of age, FSR 941 is probably a core-collapsed OC. However, some
very young OCs also present a cusp, probably as a consequence of
molecular cloud fragmentation and/or star formation effects. In this
context, we can mention NGC 2244 (Bonatto
& Bica 2009b), NGC 6823 (Bica et al. 2008b),
Pismis 5 and NGC 1931 (Bonatto
& Bica 2009c), and FSR 198 (Camargo et al. 2009) as
examples of young OCs with a central cusp. FSR 904 presents a
similar effect.
500 Myr
of age, FSR 941 is probably a core-collapsed OC. However, some
very young OCs also present a cusp, probably as a consequence of
molecular cloud fragmentation and/or star formation effects. In this
context, we can mention NGC 2244 (Bonatto
& Bica 2009b), NGC 6823 (Bica et al. 2008b),
Pismis 5 and NGC 1931 (Bonatto
& Bica 2009c), and FSR 198 (Camargo et al. 2009) as
examples of young OCs with a central cusp. FSR 904 presents a
similar effect.
|
Figure 11:
Stellar RDPs (filled circles) built with colour-magnitude filtered
photometry. Solid line: best-fit King profile. Horizontal shaded
region: stellar background level measured in the comparison field. Grey
regions: |
| Open with DEXTER | |
|
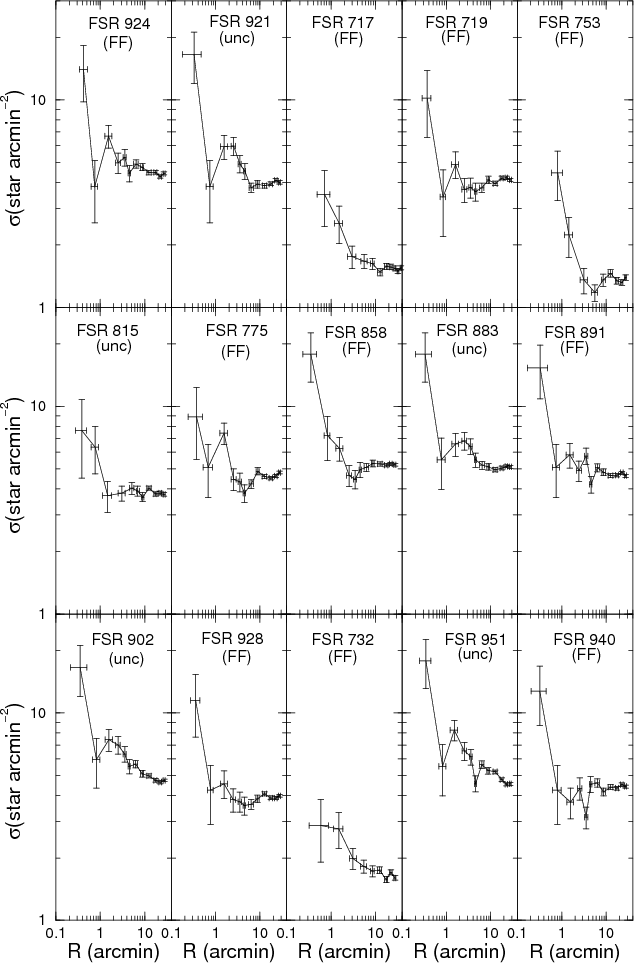
Figure 12: RDPs of a representative sample of uncertain cases and probable field fluctuations. |
| Open with DEXTER | |
Witham et al. (2008)
presented the INT/WFC Photometric H![]() Survey of the Northern Galactic Plane (IPHAS). This catalogue contains
positions and photometry for 4853 sources with H
Survey of the Northern Galactic Plane (IPHAS). This catalogue contains
positions and photometry for 4853 sources with H![]() excess (see also, Drew et al.
2005). The H
excess (see also, Drew et al.
2005). The H![]() emission is linked to several events in star clusters as stellar winds,
T Tauri stars, Herbig-Haro objects, planetary nebulae and HII region
associations. FSR 807 presents 2 H
emission is linked to several events in star clusters as stellar winds,
T Tauri stars, Herbig-Haro objects, planetary nebulae and HII region
associations. FSR 807 presents 2 H![]() -excess
sources within the cluster radius and 3 in the neighbourhood field (
J053635.21+31503.0
at 1.3
-excess
sources within the cluster radius and 3 in the neighbourhood field (
J053635.21+31503.0
at 1.3![]() of the cluster centre, J053631.98+314939.6
at 1.7
of the cluster centre, J053631.98+314939.6
at 1.7![]() ,
J053641.46+314627.8 at 5.1
,
J053641.46+314627.8 at 5.1![]() ,
J053619.82+314356.2
at 8.0
,
J053619.82+314356.2
at 8.0![]() ,
and J053619.58+314353.6
at 8.06
,
and J053619.58+314353.6
at 8.06![]() )
and FSR 812 presents 1 object (
J053817.88+313934.8)
at
)
and FSR 812 presents 1 object (
J053817.88+313934.8)
at ![]() of the cluster centre. All objects are also present in the
emission-line star catalogue of Kohoutek
& Wehmeyer (1999). We indicate the 2
of the cluster centre. All objects are also present in the
emission-line star catalogue of Kohoutek
& Wehmeyer (1999). We indicate the 2
![]() emitters in
FSR 807 CMD Fig. 7.
emitters in
FSR 807 CMD Fig. 7.
Table 5: Structural parameters.
Table 6: Integrated colours and magnitudes.
Table 7: Stellar mass estimate for clusters older than 50 Myr.
Table 8: Stellar mass estimate for the clusters with PMS.
5.2 Uncertain cases
The objects in this group have, in general, less defined decontaminated
CMD sequences than those of the confirmed OCs, which is consistent with
the lower level of the integrated ![]() parameter. The irregular RDPs make difficult King's law fits. By
``uncertain cluster'', we mean those objects with a CMD that may
suggest a cluster, but not the RDP (or the contrary). We suggest that
deeper photometry, proper motions and other methods be employed to
explore them in more detail. The uncertain cases are FSR 815,
FSR 883, FSR 902, FSR 921, and
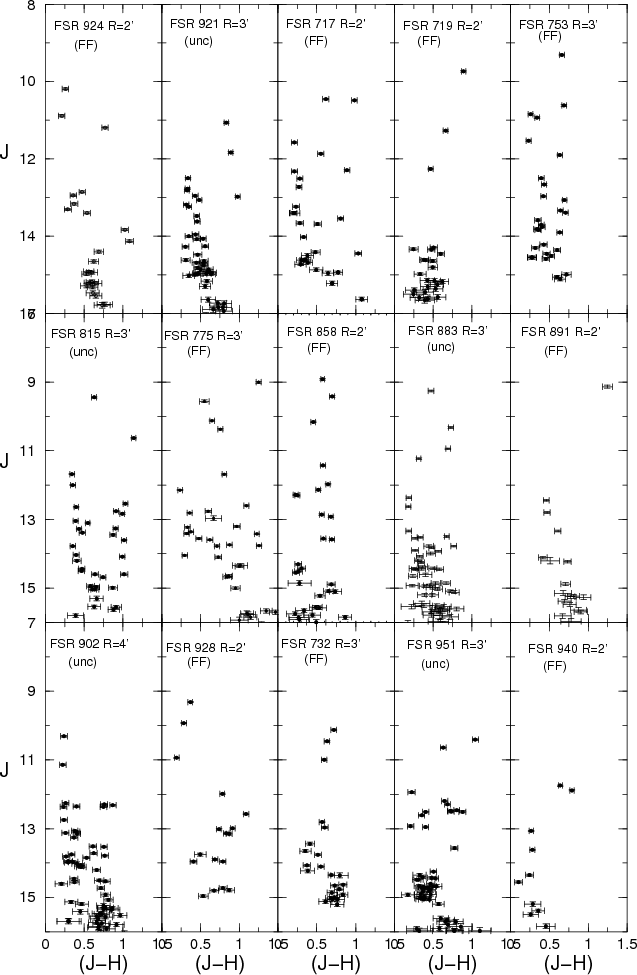
FSR 951. In Fig. 10
we show the decontaminated
parameter. The irregular RDPs make difficult King's law fits. By
``uncertain cluster'', we mean those objects with a CMD that may
suggest a cluster, but not the RDP (or the contrary). We suggest that
deeper photometry, proper motions and other methods be employed to
explore them in more detail. The uncertain cases are FSR 815,
FSR 883, FSR 902, FSR 921, and
FSR 951. In Fig. 10
we show the decontaminated ![]() CMDs of a representative sample of the uncertain cases, and in
Fig. 12
their RDPs.
CMDs of a representative sample of the uncertain cases, and in
Fig. 12
their RDPs.
5.3 Possible field fluctuations
Decontaminated CMDs of this group have ![]() -values
significantly lower, and the RDPs much more irregular, than those of
the other two groups (Sect. 3.1). In
Fig. 10
we present the decontaminated
-values
significantly lower, and the RDPs much more irregular, than those of
the other two groups (Sect. 3.1). In
Fig. 10
we present the decontaminated ![]() CMDs of a representative sample of the possible field fluctuations and
Fig. 12
shows RDPs for some these overdensities.
CMDs of a representative sample of the possible field fluctuations and
Fig. 12
shows RDPs for some these overdensities.
6 Mass estimate
Given the somewhat limited 2MASS photometric depth and the relatively
large
distance (Table 5)
of our confirmed OCs, the CMDs in Figs. 6-8 do not contain the
whole mass range expected especially for OCs older than ![]() 50 Myr.
Thus, we estimate the
stellar mass by means of the mass function (MF), built for the observed
MS mass range according to Bica
et al. (2006). The MS MF is then fitted with the
function
50 Myr.
Thus, we estimate the
stellar mass by means of the mass function (MF), built for the observed
MS mass range according to Bica
et al. (2006). The MS MF is then fitted with the
function ![]() .
Details of this approach are given in Table 7, where we also show
the number and mass of the evolved stars. Clearly, we do not have
access to the lower MS. Thus, assuming that the low-mass
content is still present, we use Kroupa's (2001) MF
.
Details of this approach are given in Table 7, where we also show
the number and mass of the evolved stars. Clearly, we do not have
access to the lower MS. Thus, assuming that the low-mass
content is still present, we use Kroupa's (2001) MF![]() to estimate the total
stellar mass, down to the H-burning mass limit (
to estimate the total
stellar mass, down to the H-burning mass limit (
![]() ). The results are given in
the last two columns of Table 7.
Interestingly, the extrapolation suggests that FSR 941 may be
a relatively massive OC.
). The results are given in
the last two columns of Table 7.
Interestingly, the extrapolation suggests that FSR 941 may be
a relatively massive OC.
For the young OCs we built the MS MF in a similar way to the
old ones, and count the number of PMS stars (Table 8). Interestingly, the
MF slopes are, in general, flatter than those of the older OCs
(Table 7),
which may reflect the longer timescale for the evolution
towards the MS of the low-mass PMS stars. Given the differential
reddening, it is not possible to attribute a precise mass value for
each PMS star. Thus, we simply count the number of PMS stars and adopt
an average mass value for the PMS stars to estimate ![]() and
and ![]() .
Assuming that the mass distribution of the PMS stars also follows
Kroupa's (2001) MF, the average PMS mass - for masses within the range
.
Assuming that the mass distribution of the PMS stars also follows
Kroupa's (2001) MF, the average PMS mass - for masses within the range ![]() - is
- is ![]() .
Thus, we simply multiply the number of PMS stars (Table 8) by
this value to estimate the PMS mass. Finally, we add the latter value
to the MS mass to obtain an estimate of the total stellar mass.
Obviously, similarly to the MS stars, 2MASS cannot detect the very low
mass PMS stars. Consequently, these values should be taken as lower
limits.
.
Thus, we simply multiply the number of PMS stars (Table 8) by
this value to estimate the PMS mass. Finally, we add the latter value
to the MS mass to obtain an estimate of the total stellar mass.
Obviously, similarly to the MS stars, 2MASS cannot detect the very low
mass PMS stars. Consequently, these values should be taken as lower
limits.
7 Discussion
After cluster formation, structural parameters change with stellar and
dynamical evolution. As a consequence of the rapid expulsion of
primordial gas and the new lower gravitational potential, the cluster
increases on all scales reaching for virialisation. Goodwin & Bastian (2006)
show that this early core radii expansion phase occurs within
10-30 Myr and can be explained as an effect of rapid residual
gas expulsion. After gas expulsion (a few 107 yr),
when some energy equipartition is reached, the core radius of the OC
survivors shrink, whereas the outer parts keep increasing in size. Mass
loss due to stellar evolution also affects the structural, parameters
but this effect is negligible because the most massive stars (
![]() )
hardly contribute to the mass of the cluster (Lamers
& Gieles 2006). In this context, Portegies Zwart et al. (1999)
show that the maximum effect of stellar evolution on core radius
expansion is about a factor two, but Mackey
& Gilmore (2008) show that this effect is more
significant if the star cluster is initially mass segregated. They also
show that significant core expansion due to stellar evolution occurs on
timescales of
)
hardly contribute to the mass of the cluster (Lamers
& Gieles 2006). In this context, Portegies Zwart et al. (1999)
show that the maximum effect of stellar evolution on core radius
expansion is about a factor two, but Mackey
& Gilmore (2008) show that this effect is more
significant if the star cluster is initially mass segregated. They also
show that significant core expansion due to stellar evolution occurs on
timescales of ![]() 100 Myr.
100 Myr.
As a consequence of large-scale mass segregation, massive
stars tend to be more concentrated in the core of evolved clusters,
while low-mass stars are transferred to the outer regions (Bonatto & Bica 2005). As
a consequence of mass segregation, ![]() tends to increase, while
tends to increase, while ![]() decreases.
decreases.
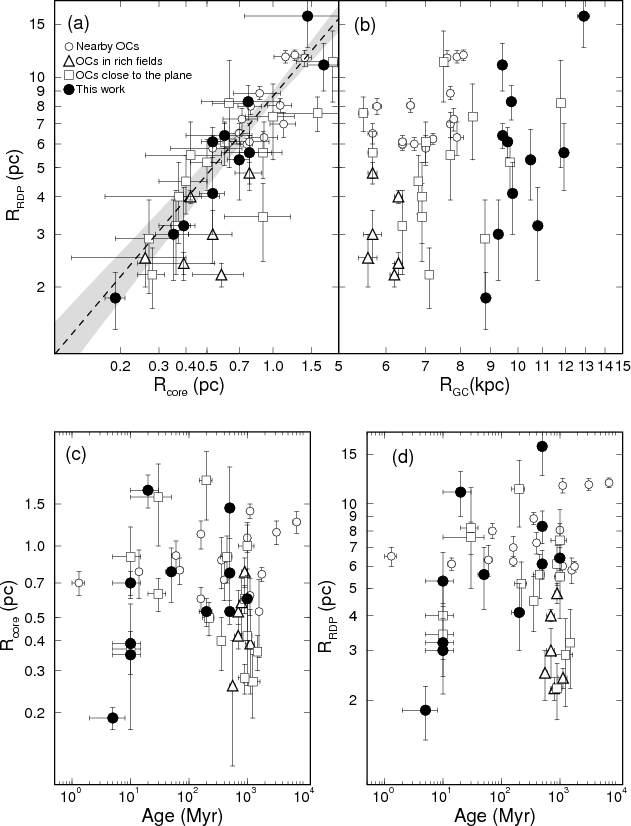
In Fig. 13 we compare the structural parameters derived for the present OCs with those measured in different environments. As a reference sample, we use (i) some bright nearby OCs (Bonatto & Bica 2005), including the two young OCs NGC 6611 (Bonatto et al. 2006a) and NGC 4755 (Bonatto et al. 2006b); (ii) OCs projected against the central parts of the Galaxy (Bonatto & Bica 2007b); (iii) OCs projected close to the Galactic plane (Camargo et al. 2009); and (iv) the present sample.
In panel (a) of Fig. 13, core and cluster
radii of the OCs in sample (i) are almost linearly
related by ![]() ,
which suggests that both kinds of radii undergo a similar scaling, in
the sense that, on average, larger clusters tend to have larger cores.
However,
,
which suggests that both kinds of radii undergo a similar scaling, in
the sense that, on average, larger clusters tend to have larger cores.
However, ![]() of the OCs in sample (ii) do not follow that
relation, which suggests that they are either intrinsically small or
have been suffering important evaporation effects. The core and cluster
radii in sample (iii) and the OCs of this work (iv)
are consistent with the relation at the
of the OCs in sample (ii) do not follow that
relation, which suggests that they are either intrinsically small or
have been suffering important evaporation effects. The core and cluster
radii in sample (iii) and the OCs of this work (iv)
are consistent with the relation at the ![]() level. A dependence of OC size on Galactocentric distance is shown in
panel (b), as previously suggested by Lyngå (1982) and Tadross et al. (2002).
The core and cluster radii of the OCs in this work (iv)
are consistent with the one in samples (ii) and (iii).
Most OCs of our sample are located in the inner disk and close to the
spiral arms, so they are consistent with sample (iii)
and with those located in crowded fields (ii). To
explain the increase of Globular Cluster radii with Galactocentric
distance, van den Bergh
et al. (1991) suggest that part of the relation may
be primordial, the higher molecular gas density in central Galactic
regions may have created clusters with small radii. In addition, most
clusters with small sizes are concentred near the Galactic plane,
especially for
level. A dependence of OC size on Galactocentric distance is shown in
panel (b), as previously suggested by Lyngå (1982) and Tadross et al. (2002).
The core and cluster radii of the OCs in this work (iv)
are consistent with the one in samples (ii) and (iii).
Most OCs of our sample are located in the inner disk and close to the
spiral arms, so they are consistent with sample (iii)
and with those located in crowded fields (ii). To
explain the increase of Globular Cluster radii with Galactocentric
distance, van den Bergh
et al. (1991) suggest that part of the relation may
be primordial, the higher molecular gas density in central Galactic
regions may have created clusters with small radii. In addition, most
clusters with small sizes are concentred near the Galactic plane,
especially for ![]() kpc
and
kpc
and ![]() pc
(Wielen 1975,1971; Tadross
et al. 2002). FSR 807, which appears
exceedingly small for its Galactocentric distance, possibly presents
this primordial effect, with
pc
(Wielen 1975,1971; Tadross
et al. 2002). FSR 807, which appears
exceedingly small for its Galactocentric distance, possibly presents
this primordial effect, with ![]() located close to Orion-Cygnus arm. In panels (c) and
(d) we compare core and cluster radii with cluster
age, respectively. This relationship is intimately related to cluster
survival/dissociation rates. Both kinds of radii present a similar
dependence on age, in which part of the clusters expand with time,
while some seem to shrink. The bifurcation occurs at an age
located close to Orion-Cygnus arm. In panels (c) and
(d) we compare core and cluster radii with cluster
age, respectively. This relationship is intimately related to cluster
survival/dissociation rates. Both kinds of radii present a similar
dependence on age, in which part of the clusters expand with time,
while some seem to shrink. The bifurcation occurs at an age ![]() 1 Gyr.
Mackey & Gilmore (2003)
observed a similar effect for the core radii of LMC and SMC clusters
and Mackey & Gilmore (2008)
argue that this radius-age correlation has a dynamical origin. They
attribute the trend to slow contraction in
1 Gyr.
Mackey & Gilmore (2003)
observed a similar effect for the core radii of LMC and SMC clusters
and Mackey & Gilmore (2008)
argue that this radius-age correlation has a dynamical origin. They
attribute the trend to slow contraction in ![]() to a dynamical relaxation and/or core collapse. The expansion was
attributed to mass loss from rapid stellar evolution in a cluster that
is mass-segregated or otherwise centrally concentrated and to heating
due to a significant population of retained stellar mass black holes
that are scattered into the cluster halo or ejected from the cluster (Mackey
et al. 2007; Merritt et al. 2004).
We also note that the radii of the clusters of our sample are related
to the age similarly to the (leaky) ones of Pfalzner (2009) and optical
clusters of Maciejewski
& Niedzielski (2007).
to a dynamical relaxation and/or core collapse. The expansion was
attributed to mass loss from rapid stellar evolution in a cluster that
is mass-segregated or otherwise centrally concentrated and to heating
due to a significant population of retained stellar mass black holes
that are scattered into the cluster halo or ejected from the cluster (Mackey
et al. 2007; Merritt et al. 2004).
We also note that the radii of the clusters of our sample are related
to the age similarly to the (leaky) ones of Pfalzner (2009) and optical
clusters of Maciejewski
& Niedzielski (2007).
|
Figure 13: Relations involving structural parameters of OCs. Empty circles: nearby OCs, including two young ones. Triangles: OCs projected on dense fields towards the Galactic central regions. Square: OCs close to the Galactic plane. Filled circles: the present work OCs. |
| Open with DEXTER | |
|
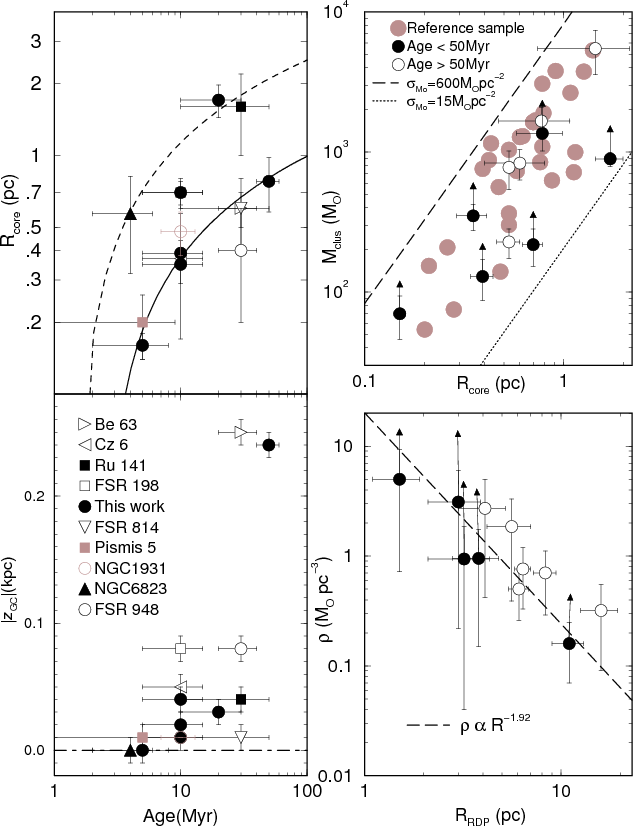
Figure 14:
Top-left panel: age and |
| Open with DEXTER | |
Most of the confirmed OCs of our sample are smaller than nearby OCs (i)
of similar age and Galactocentric distance (Fig. 13). We point out
that our sample occurs close to the Galactic plane and/or close to
spiral arms (except NGC 2234). Possibly, some of these OCs
have interacted with GMCs. Molecular clouds more massive than ![]()
![]() are found in the solar neighbourhood (Solomon
et al. 1987). In Fig. 14 we show the
relation between age and both
are found in the solar neighbourhood (Solomon
et al. 1987). In Fig. 14 we show the
relation between age and both ![]() and
and ![]() for the young OCs of our sample. We fit an empirical curve
for the young OCs of our sample. We fit an empirical curve ![]() to young OCs close to the Galactic plane and/or close to spiral arms. Bastian et al. (2008)
observed a similar relation for M 51 clusters and fitted the
empirical curve
to young OCs close to the Galactic plane and/or close to spiral arms. Bastian et al. (2008)
observed a similar relation for M 51 clusters and fitted the
empirical curve ![]() that represents initially compact and mass-segregated star clusters (
that represents initially compact and mass-segregated star clusters (
![]() pc).
In this context, N-body simulations by Vesperini et al. (2009)
show that in segregated clusters, early mass loss due to stellar
evolution triggers a stronger expansion than for unsegregated clusters
and that long-lived clusters initially with a high degree of mass
segregation tend to have looser structure and reach core collapse later
in their evolution than initially unsegregated clusters.
pc).
In this context, N-body simulations by Vesperini et al. (2009)
show that in segregated clusters, early mass loss due to stellar
evolution triggers a stronger expansion than for unsegregated clusters
and that long-lived clusters initially with a high degree of mass
segregation tend to have looser structure and reach core collapse later
in their evolution than initially unsegregated clusters.
As discussed in Bonatto
& Bica (2009c), when the projected mass density of a
star cluster follows a King-like profile (e.g. Bonatto
& Bica 2008a), the cluster mass (
![]() )
can be expressed as a function of the core radius and the central
surface mass density
(
)
can be expressed as a function of the core radius and the central
surface mass density
(
![]() )
according to
)
according to ![]() .
Figure 14
(top-right panel) shows the distribution of our OCs in the plane core
radius (Sect. 4)
vs cluster mass (Sect. 6).
Clearly, our OCs (together with the reference sample)
distribute parallel to the above relation, since they are constrained
within King-like distributions with
.
Figure 14
(top-right panel) shows the distribution of our OCs in the plane core
radius (Sect. 4)
vs cluster mass (Sect. 6).
Clearly, our OCs (together with the reference sample)
distribute parallel to the above relation, since they are constrained
within King-like distributions with ![]() .
(These bounds take the uncertainties into account.) This suggests a
correlation between cluster mass and core radius, somewhat consistent
with the mass-radius relation suggested by Portegies
Zwart et al. (2010) for massive clusters younger
than 100 Myr.
.
(These bounds take the uncertainties into account.) This suggests a
correlation between cluster mass and core radius, somewhat consistent
with the mass-radius relation suggested by Portegies
Zwart et al. (2010) for massive clusters younger
than 100 Myr.
Finally, with the cluster radius and mass estimates, we
computed the cluster
mass density ![]() .
We show the results
in the plane
.
We show the results
in the plane ![]() (Fig. 14,
bottom-right panel). Despite the
error bars, the density decreases with cluster radius as
(Fig. 14,
bottom-right panel). Despite the
error bars, the density decreases with cluster radius as ![]() ,
similarly to the sample of embedded clusters studied by Pfalzner (2009). That work,
notes that the dependence on radius of the embedded clusters is
significantly shallower than those observed in young clusters more
massive than
,
similarly to the sample of embedded clusters studied by Pfalzner (2009). That work,
notes that the dependence on radius of the embedded clusters is
significantly shallower than those observed in young clusters more
massive than ![]() ,
,
![]() and R-4.
As a caveat, we note that the mass density of the OCs in Pfalzner (2009) is more than
10 times higher than those of our OCs.
and R-4.
As a caveat, we note that the mass density of the OCs in Pfalzner (2009) is more than
10 times higher than those of our OCs.
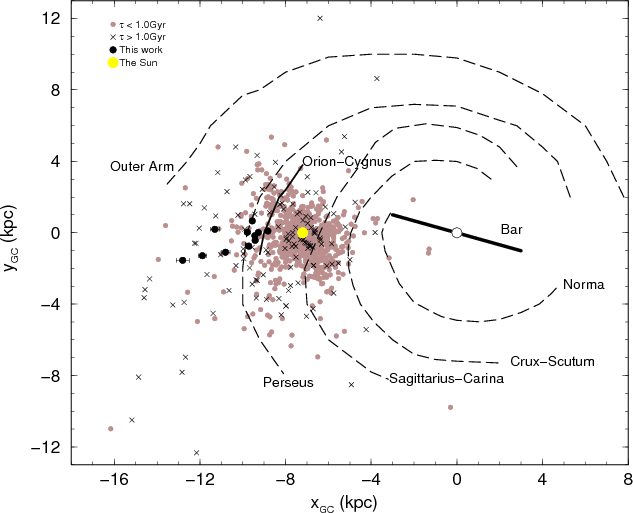
Figure 15
shows the spatial distribution in the Galactic plane and spiral arms (Momany et al. 2006) of
the present OCs, compared to that of the OCs in the WEBDA database. We
considered two age ranges, <1 Gyr and
>1 Gyr, and computed the projections on the Galactic
plane of the Galactic coordinates ![]() .
Old OCs are mainly found outside the Solar circle, and the inner Galaxy
contains few OCs so far detected. The interesting point is whether
inner Galaxy clusters cannot be observed because of strong absorption
and crowding, or have been systematically dissolved by the different
tidal effects combined (Bonatto
& Bica 2007a, and references therein). In this
context, the more OCs are identified (with their astrophysical
parameters derived) in the central parts, the more constraints can be
established to settle this issue.
.
Old OCs are mainly found outside the Solar circle, and the inner Galaxy
contains few OCs so far detected. The interesting point is whether
inner Galaxy clusters cannot be observed because of strong absorption
and crowding, or have been systematically dissolved by the different
tidal effects combined (Bonatto
& Bica 2007a, and references therein). In this
context, the more OCs are identified (with their astrophysical
parameters derived) in the central parts, the more constraints can be
established to settle this issue.
|
Figure 15: Spatial distribution of the present star clusters (filled circles) compared to the WEBDA OCs with ages younger than 1 Gyr (brown circles) and older than 1 Gyr (crosses). The schematic projection of the Galaxy is seen from the north pole, with 7.2 kpc as the Sun's distance to the Galactic centre. |
| Open with DEXTER | |
8 Concluding remarks
We investigate the nature of 50 overdensities projected nearly towards the anti-centre, in the sectorOut of the 50 overdensities, 16 (32%) are confirmed as OCs.
Nine (18%) are new OCs (FSR 735, FSR 807,
FSR 812, FSR 826, FSR 852, FSR 904,
FSR 941, FSR 953, and FSR 955) and we
derived astrophysical parameters. They are OCs or embedded clusters
with age in the range 5 Myr to 1 Gyr, at distances
from the Sun ![]() and Galactocentric distances
and Galactocentric distances ![]() .
Other 7 (14%) overdensities are previously catalogued OCs or
embedded clusters (KKC1, FSR 795, Cz 22,
FSR 828, FSR 856, Czernik 24, and
NGC 2234). We also derived parameters for Cz 22 and
NGC 2234. Five are classified as uncertain cases and require
deeper photometry to establish their nature. The remaining FSR
overdensities appear to be field fluctuations.
.
Other 7 (14%) overdensities are previously catalogued OCs or
embedded clusters (KKC1, FSR 795, Cz 22,
FSR 828, FSR 856, Czernik 24, and
NGC 2234). We also derived parameters for Cz 22 and
NGC 2234. Five are classified as uncertain cases and require
deeper photometry to establish their nature. The remaining FSR
overdensities appear to be field fluctuations.
Most of the new OCs are located close to spiral arms and/or
close to the Galactic plane and, probably because of this, the core
radius appears to be smaller than the others at comparable
Galactocentric distance and age. Also for this reason, most of them
were undetected in the past.
We thank an anonymous referee for significant comments and suggestions. This publication makes use of data products from the Two Micron All Sky Survey, which is a joint project of the University of Massachusetts and the Infrared Processing and Analysis Centre/California Institute of Technology, funded by the National Aeronautics and Space Administration and the National Science Foundation. This research has made use of the WEBDA database, operated at the Institute for Astronomy of the University of Vienna, as well as Digitised Sky Survey images from the Space Telescope Science Institute obtained using the extraction tool from CADC (Canada). We acknowledge support from CNPq and Capes (Brazil).
References
- Alter, G., Ruprecht, J., & Vanysek, V. 1970, in Catalogue of star clusters and associations and Suppl., 2nd edn., Akad. Kiado, Budapest, ed. G. Alter, B. Balazs, & J. Ruprecht [Google Scholar]
- Bastian, N., Gieles, M., Goodwin, S. P., et al. 2008, MNRAS, 389, 223 [NASA ADS] [CrossRef] [Google Scholar]
- Bergond, G., Leon, S., & Guibert, J. 2001, A&A, 377, 462 [NASA ADS] [CrossRef] [EDP Sciences] [Google Scholar]
- van den Bergh, S., Morbey, C., & Pazder, J. 1991, ApJ, 375, 594 [NASA ADS] [CrossRef] [Google Scholar]
- Bica, E., Bonatto, C., Barbuy, B., & Ortolani, S. 2006, A&A, 450, 105 [NASA ADS] [CrossRef] [EDP Sciences] [Google Scholar]
- Bica, E., Bonatto, C., & Camargo, D. 2008a, MNRAS, 385, 349 [NASA ADS] [CrossRef] [Google Scholar]
- Bica, E., Bonatto, C., & Dutra, C. 2008b, A&A, 489, 1129 [NASA ADS] [CrossRef] [EDP Sciences] [Google Scholar]
- Bonatto, C., & Bica, E. 2005, A&A, 437, 483 [NASA ADS] [CrossRef] [EDP Sciences] [Google Scholar]
- Bonatto, C., & Bica, E. 2006, A&A, 455, 931 [NASA ADS] [CrossRef] [EDP Sciences] [Google Scholar]
- Bonatto, C., & Bica, E. 2007a, A&A, 473, 445 [NASA ADS] [CrossRef] [EDP Sciences] [Google Scholar]
- Bonatto, C., & Bica, E. 2007b, MNRAS, 377, 1301 [NASA ADS] [CrossRef] [Google Scholar]
- Bonatto, C., & Bica, E. 2008a, A&A, 477, 829 [NASA ADS] [CrossRef] [EDP Sciences] [Google Scholar]
- Bonatto, C., & Bica, E. 2008b, A&A, 485, 81 [NASA ADS] [CrossRef] [EDP Sciences] [Google Scholar]
- Bonatto, C., & Bica, E. 2009a, MNRAS, 392, 483 [NASA ADS] [CrossRef] [Google Scholar]
- Bonatto, C., & Bica, E. 2009b, MNRAS, 394, 2127 [NASA ADS] [CrossRef] [Google Scholar]
- Bonatto, C., & Bica, E. 2009c, MNRAS, 397, 1915 [NASA ADS] [CrossRef] [Google Scholar]
- Bonatto, C., Bica, E., & Girardi, L. 2004, A&A, 415, 571 [NASA ADS] [CrossRef] [EDP Sciences] [Google Scholar]
- Bonatto, C., Santos, Jr., J. F. C., & Bica, E. 2006a, A&A, 445, 567 [NASA ADS] [CrossRef] [EDP Sciences] [Google Scholar]
- Bonatto, C., Bica, E., Ortolani, S., & Barbuy, B. 2006b, A&A, 453, 121 [NASA ADS] [CrossRef] [EDP Sciences] [Google Scholar]
- Camargo, D., Bonatto, C., & Bica, E. 2009, A&A, 508, 211 [NASA ADS] [CrossRef] [EDP Sciences] [Google Scholar]
- de Wit, W. J., Testi, L., Palla, F., & Zinnecker, H. 2005, A&A, 437, 243 [Google Scholar]
- Drew, J. E., Greimel, R., Irwin, M. J., et al. 2005, MNRAS, 362, 753 [NASA ADS] [CrossRef] [Google Scholar]
- Dutra, C. M., Santiago, B. X., & Bica, E. 2002, A&A, 383, 219 [NASA ADS] [CrossRef] [EDP Sciences] [Google Scholar]
- Elson, R. A. W., Fall, S. M., & Freeman, K. C. 1987, ApJ, 323, 54 [NASA ADS] [CrossRef] [Google Scholar]
- Friel, E. D. 1995, ARA&A, 33, 381 [NASA ADS] [CrossRef] [Google Scholar]
- Froebrich, D., Scholz, A., & Raftery, C. L. 2007, MNRAS, 374, 399 [Google Scholar]
- Gieles, M., Bastian, N., Lamers, H. J. G. L. M., & Mout, J. N. 2005, A&A, 441, 949 [NASA ADS] [CrossRef] [EDP Sciences] [Google Scholar]
- Gieles, M., Athanassoula, E., & Portegies Zwart, S. F. 2007, MNRAS, 376, 809 [NASA ADS] [CrossRef] [Google Scholar]
- Girardi, L., Bertelli, G., Bressan, A., et al. 2002, A&A, 391, 195 [NASA ADS] [CrossRef] [EDP Sciences] [Google Scholar]
- Goodwin, S. P., & Bastian, N. 2006, MNRAS, 373, 752 [NASA ADS] [CrossRef] [Google Scholar]
- King I. 1962, AJ, 67, 471 [NASA ADS] [CrossRef] [Google Scholar]
- King, I. 1966, AJ, 71, 64 [Google Scholar]
- Kohoutek, L., & Wehmeyer, R. 1999, A&AS, 134, 255 [NASA ADS] [CrossRef] [EDP Sciences] [Google Scholar]
- Kroupa, P. 2001, MNRAS, 322, 231 [NASA ADS] [CrossRef] [Google Scholar]
- Kumar, M. S. N., Keto, E., & Clerkin, E. 2006, A&A, 449, 1033 [NASA ADS] [CrossRef] [EDP Sciences] [Google Scholar]
- Koposov, S. E., Glushkova, E. V., & Zolotukhin, I. Yu. 2007, A&A, 486, 771 [Google Scholar]
- Yadav, R. K. S., & Sagar, R. 2004, MNRAS, 349, 1481 [NASA ADS] [CrossRef] [Google Scholar]
- Lada, C. J., & Lada, E. A. 2003, ARA&A, 41, 57 [NASA ADS] [CrossRef] [Google Scholar]
- Lada, E. A. 2007, Rev. Mex. Astron. Astrofis. Conf. Ser., 29, 43 [NASA ADS] [Google Scholar]
- Lamers, H. J. G. L. M., & Gieles, M. 2006, A&A, 455, 17 [Google Scholar]
- Lamers, H. J. G. L. M., Gieles, M., Bastian, N., et al. 2005, A&A, 441, 117 [NASA ADS] [CrossRef] [EDP Sciences] [Google Scholar]
- Lyngå, G. 1982, A&A, 109, 213 [NASA ADS] [Google Scholar]
- Maciejewski, G., & Niedzielski, A. 2007, A&A, 467, 1065 [NASA ADS] [CrossRef] [EDP Sciences] [Google Scholar]
- Mackey, A. D., & Gilmore, G. F. 2003, MNRAS, 338, 120 [NASA ADS] [CrossRef] [Google Scholar]
- Mackey, A. D., Wilkinson, M. I., Davies, M. B., & Gilmore, G. F. 2007, MNRAS, 379, 40 [Google Scholar]
- Mackey, A. D., Gilmore, G. F., Davies, M. B., & Gilmore, G. F. 2008, MNRAS, 386, 65 [NASA ADS] [CrossRef] [Google Scholar]
- Merritt, D., Piatek, S., Portegies Zwart, S., & Hemsendorf, M. 2004, ApJ, 608, 25 [NASA ADS] [CrossRef] [Google Scholar]
- Momany, Y., Zaggia, S., Gilmore, G., et al. 2006, A&A, 451, 515 [NASA ADS] [CrossRef] [EDP Sciences] [Google Scholar]
- Naylor, T., & Jeffries, R. D. 2006, MNRAS, 373, 1251 [NASA ADS] [CrossRef] [Google Scholar]
- Oort, J. H. 1957, in Stellar populations (Rome: Pontifical Academy of Science) discussion in session on star clusters [Google Scholar]
- Pavani, D. N., & Bica, E. 2007, MNRAS, 468, 139 [Google Scholar]
- Pfalzner, S. 2009, A&A, 498, 37 [Google Scholar]
- Portegies Zwart, S. F., Makino, J., McMillan, S. L. W., & Hut, P. 1999 A&A, 348, 117 [Google Scholar]
- Portegies Zwart, S. F., McMillan, S., & Gieles, M. 2010, ARA&A, [arXiv:1002.1961] [Google Scholar]
- Schilbach, E., Kharchenko, N. V., Pisnukov, A. E., Röser, S., & Scholz, R.-D. 2006, A&A, 456, 523 [NASA ADS] [CrossRef] [EDP Sciences] [Google Scholar]
- Siess, L., Dufour, E., & Forestini, M. 2000, A&A, 353, 593 [NASA ADS] [Google Scholar]
- Skrutskie, M. F., Cutri, R. M., Stiening, R., et al. 2006, AJ, 131, 1163 [NASA ADS] [CrossRef] [Google Scholar]
- Solomon, P. M., Rivolo, A. R., Barrett, J., & Yahil, A. 1987, ApJ, 319, 730 [NASA ADS] [CrossRef] [Google Scholar]
- Trager, S. C., King, I. R., & Djorgovski, S. 1995, AJ, 109, 218 [NASA ADS] [CrossRef] [Google Scholar]
- Tadross, A. L., Werner, P., Osman, A., & Marie, M. 2002, NewAst, 7, 553 [NASA ADS] [Google Scholar]
- Tutukov, A. V. 1978, A&A, 70, 57 [NASA ADS] [Google Scholar]
- Vesperini, E., McMillan, S. L. W., & Portegies Zwart, S. 2009 ApJ, 698, 615 [Google Scholar]
- Wielen, R. 1971, A&A, 13, 309 [NASA ADS] [Google Scholar]
- Wielen, R. 1975, ed. A. Hayli (Dordrecht: Reidel), IAU symp., 69, 119 [Google Scholar]
- Wilson, C. P. 1975, AJ, 80, 175 [NASA ADS] [CrossRef] [Google Scholar]
- Witham, A. R., Knigge, C., Drew, J. E., et al. 2008, MNRAS, 384, 1277 [NASA ADS] [CrossRef] [Google Scholar]
Footnotes
- ...
mechanisms
![[*]](/icons/foot_motif.png)
- E.g., mass loss by stellar evolution, mass segregation, and tidal interactions with the disk, bulge, spiral arms and GMCs. The latter events increase the mean internal energy that may lead to the gradual cluster expansion and disruption.
- ...
2MASS
- The Two Micron All Sky Survey, available at www.ipac.caltech.edu/2mass/releases/allsky/
- ... VizieR
- http://vizier.u-strasbg.fr/viz-bin/VizieR?-source=II/246
- ... MF
-
 for
for
 ,
,
 for
for
 ,
and
,
and
 for
for
 .
.
All Tables
Table 1: General data on the FSR star cluster candidates.
Table 2: Cross-identification of the open clusters.
Table 3: Field star decontamination statistics.
Table 4: Derived fundamental parameters.
Table 5: Structural parameters.
Table 6: Integrated colours and magnitudes.
Table 7: Stellar mass estimate for clusters older than 50 Myr.
Table 8: Stellar mass estimate for the clusters with PMS.
All Figures
|
|
Figure 1:
Left panel: |
| Open with DEXTER | |
| In the text | |
|
|
Figure 2:
Left panel: 2MASS K image
|
| Open with DEXTER | |
| In the text | |
|
|
Figure 3:
Top panels: stellar surface-density |
| Open with DEXTER | |
| In the text | |
|
|
Figure 4: Same as Fig. 3 for the uncertain case FSR 815. |
| Open with DEXTER | |
| In the text | |
|
|
Figure 5: Same as Fig. 3 for the possible field fluctuation case FSR 928. |
| Open with DEXTER | |
| In the text | |
|
|
Figure 6:
2MASS CMDs extracted from the R=5' region of FSR
953. Top panels: observed CMDs |
| Open with DEXTER | |
| In the text | |
|
|
Figure 7:
2MASS CMDs extracted from the central region of FSR 812, FSR 826, FSR
807, FSR904, and FSR 955. Top panels: observed
CMDs |
| Open with DEXTER | |
| In the text | |
|
|
Figure 8:
2MASS CMDs extracted from the central region of FSR 735, FSR 852,
NGC 2234, Cz 22, and FSR 941. Top panels:
observed CMDs |
| Open with DEXTER | |
| In the text | |
|
|
Figure 9: Colour-colour diagrams with the decontaminated photometry of the young OCs in our sample, FSR 812, FSR 826, FSR 807, FSR 904, and FSR 955. Siess et al. (2000) isochrones and reddening vectors are used to characterise the PMS distribution. |
| Open with DEXTER | |
| In the text | |
|
|
Figure 10:
Field-star decontaminated |
| Open with DEXTER | |
| In the text | |
|
|
Figure 11:
Stellar RDPs (filled circles) built with colour-magnitude filtered
photometry. Solid line: best-fit King profile. Horizontal shaded
region: stellar background level measured in the comparison field. Grey
regions: |
| Open with DEXTER | |
| In the text | |
|
|
Figure 12: RDPs of a representative sample of uncertain cases and probable field fluctuations. |
| Open with DEXTER | |
| In the text | |
|
|
Figure 13: Relations involving structural parameters of OCs. Empty circles: nearby OCs, including two young ones. Triangles: OCs projected on dense fields towards the Galactic central regions. Square: OCs close to the Galactic plane. Filled circles: the present work OCs. |
| Open with DEXTER | |
| In the text | |
|
|
Figure 14:
Top-left panel: age and |
| Open with DEXTER | |
| In the text | |
|
|
Figure 15: Spatial distribution of the present star clusters (filled circles) compared to the WEBDA OCs with ages younger than 1 Gyr (brown circles) and older than 1 Gyr (crosses). The schematic projection of the Galaxy is seen from the north pole, with 7.2 kpc as the Sun's distance to the Galactic centre. |
| Open with DEXTER | |
| In the text | |
Copyright ESO 2010
Current usage metrics show cumulative count of Article Views (full-text article views including HTML views, PDF and ePub downloads, according to the available data) and Abstracts Views on Vision4Press platform.
Data correspond to usage on the plateform after 2015. The current usage metrics is available 48-96 hours after online publication and is updated daily on week days.
Initial download of the metrics may take a while.