| Issue |
A&A
Volume 521, October 2010
|
|
|---|---|---|
| Article Number | A48 | |
| Number of page(s) | 10 | |
| Section | Extragalactic astronomy | |
| DOI | https://doi.org/10.1051/0004-6361/201014529 | |
| Published online | 19 October 2010 | |
Kiloparsec-scale star formation law in M 81 and M 101 based on AKARI far-infrared observations
T. Suzuki1 - H. Kaneda2 - T. Onaka3 - T. Nakagawa1 - H. Shibai4
1 - Institute of Space and Astronautical Science,
Japan Aerospace Exploration Agency, 3-1-1 Yoshinodai, Chuo-ku,
Sagamihara, Kanagawa 252-5210, Japan
2 -
Graduate School of Science, Nagoya University, Chikusa-ku,
Nagoya 464-8602, Japan
3 -
Department of Astronomy, Graduate School of Science, The
University of Tokyo, 7-3-1 Bunkyo-ku, Tokyo
113-0033, Japan
4 -
Graduate School of Science, Osaka University, Toyonaka,
Osaka 560-0043, Japan
Received 29 March 2010 / Accepted 10 June 2010
Abstract
Aims. We assess the relationships between the surface
densities of the gas and star formation rate (SFR) within spiral arms
of the nearby late-type spiral galaxies M 81 and M 101. By
analyzing these relationships locally, we empirically derive a
kiloparsec scale Kennicutt-Schmidt Law (
![]() ).
).
Methods. Both M 81 and M 101 were observed with the
Far-Infrared Surveyor (FIS) aboard AKARI in four far-infrared bands at
65, 90, 140, and 160 ![]() m.
m.
Results. The spectral energy distributions of the whole galaxies show the presence of the cold dust component (
![]() K) in addition to the warm dust component (
K) in addition to the warm dust component (
![]() K).
We deconvolved the cold and warm dust emission components spatially by
making the best use of the multi-band photometric capability of the
FIS. The cold and warm dust components show power-law correlations in
various regions, which can be converted into the gas mass and the SFR,
respectively. We find a power-law correlation between the gas and SFR
surface densities with significant differences in the power-law index N between giant H II regions (
K).
We deconvolved the cold and warm dust emission components spatially by
making the best use of the multi-band photometric capability of the
FIS. The cold and warm dust components show power-law correlations in
various regions, which can be converted into the gas mass and the SFR,
respectively. We find a power-law correlation between the gas and SFR
surface densities with significant differences in the power-law index N between giant H II regions (
![]() )
and spiral arms (
)
and spiral arms (
![]() )
in M 101. The power-law index for spiral arms in M 81 is similar (
)
in M 101. The power-law index for spiral arms in M 81 is similar (
![]() to that of spiral arms in M 101.
to that of spiral arms in M 101.
Conclusions. The power-law index is not always constant within a
galaxy. The difference can be attributed to the difference in the star
formation processes on a kiloparsec scale. ![]() seen in the spiral arms in M 81 and M 101 supports the
scenario of star formation triggered by cloud-cloud collisions enhanced
by a spiral density wave, while
seen in the spiral arms in M 81 and M 101 supports the
scenario of star formation triggered by cloud-cloud collisions enhanced
by a spiral density wave, while ![]() derived in giant H II regions in M 101 suggests the star formation induced by the Parker instability triggered by high-velocity H I
gas infall. The present method can be applied to a large galaxy sample
for which the AKARI All Sky Survey provides the same 4 far-infrared
band data.
derived in giant H II regions in M 101 suggests the star formation induced by the Parker instability triggered by high-velocity H I
gas infall. The present method can be applied to a large galaxy sample
for which the AKARI All Sky Survey provides the same 4 far-infrared
band data.
Key words: dust, extinction - stars: formation - galaxies: structure - galaxies: individual: M 81 - galaxies: individual: M 101 - infrared: ISM
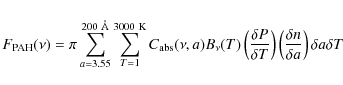
1 Introduction
The evolution of spiral galaxies remains a key subject
in modern astrophysics. In particular, understanding the
physical processes that control star formation in galactic disks is
vital. The relation between the star formation rate
(SFR) and the gas content is one of the most important subjects for
giving insight into star-formation processes in galaxies, as well as in galaxy
evolution. The formation of stars in galaxies is a complicated process
involving a variety of physical phenomena on a wide range of spatial
and temporal scales. On small scales (![]() 10-100 pc), star formation
appears to be a complicated and stochastic process. In contrast, on
kiloparsec scales, star formation is known to follow a universal law. A
simple power-law relation between the SFR and the gas content for
external galaxies, first introduced by Schmidt (1959) and further
explored by Kennicutt (1998), is well established and has already
been tested on large galaxy samples. The Kennicutt-Schmidt law (K-S law) has
been extensively investigated by researchers and shows a power-law
correlation between the SFR surface density
10-100 pc), star formation
appears to be a complicated and stochastic process. In contrast, on
kiloparsec scales, star formation is known to follow a universal law. A
simple power-law relation between the SFR and the gas content for
external galaxies, first introduced by Schmidt (1959) and further
explored by Kennicutt (1998), is well established and has already
been tested on large galaxy samples. The Kennicutt-Schmidt law (K-S law) has
been extensively investigated by researchers and shows a power-law
correlation between the SFR surface density
![]() and
the gas surface density
and
the gas surface density
![]() (
(
![]() ). The power-law index
N ranges from 1 to 2.
). The power-law index
N ranges from 1 to 2.
Kennicutt (1998) examined the disk-averaged SFR and
the gas surface density for 61 normal spiral (
![]() vs.
vs.
![]() )
and 36 circumnuclear starburst
galaxies (
)
and 36 circumnuclear starburst
galaxies (
![]() vs.
vs.
![]() ). The best fit yields
). The best fit yields
![]() for normal galaxies and
for normal galaxies and
![]() for starburst
galaxies. Hamajima & Tosa (1975) investigated correlations between the distributions of
H II regions and H I gas in M 31, NGC 2403, M 101, M 51, and
NGC 6946. They found
for starburst
galaxies. Hamajima & Tosa (1975) investigated correlations between the distributions of
H II regions and H I gas in M 31, NGC 2403, M 101, M 51, and
NGC 6946. They found ![]() for these galaxies. Misiriotis et al. (2006) examined
the validity of the K-S law (
for these galaxies. Misiriotis et al. (2006) examined
the validity of the K-S law (
![]() vs.
vs.
![]() )
for the various regions in our Galaxy. It is
evident that the Galactic K-S law also follows a power-law. The best fit
yields
)
for the various regions in our Galaxy. It is
evident that the Galactic K-S law also follows a power-law. The best fit
yields
![]() ,
which is in good agreement with the value quoted
by normal galaxies in Kennicutt (1998). Taniguchi & Ohyama (1998) also
examined the K-S law (
,
which is in good agreement with the value quoted
by normal galaxies in Kennicutt (1998). Taniguchi & Ohyama (1998) also
examined the K-S law (
![]() vs.
vs.
![]() )
for 28 starburst galaxies that are more luminous than
those in the Kennicutt samples (Kennicutt 1998). The resulting
power-law index shows
)
for 28 starburst galaxies that are more luminous than
those in the Kennicutt samples (Kennicutt 1998). The resulting
power-law index shows
![]() ,
which is much shallower than that
derived in the Kennicutt samples. The SFR is proportional to the product
of the growth rate of the instability and the averaged gas density
,
which is much shallower than that
derived in the Kennicutt samples. The SFR is proportional to the product
of the growth rate of the instability and the averaged gas density
![]() .
The growth rate varies with the gas density as
.
The growth rate varies with the gas density as
![]() ,
where
,
where
![]() -0.5 and thus
-0.5 and thus
![]() for the
gravitational instability (Elmegreen 1994). Therefore, they conclude
that the star formation law in these starburst galaxies favors a
gravitational instability scenario. The index of nearly unity suggests
star formation triggered by self-instability, such as gravitation,
whereas the index near 2 indicates star formation induced by collisions,
for instance.
for the
gravitational instability (Elmegreen 1994). Therefore, they conclude
that the star formation law in these starburst galaxies favors a
gravitational instability scenario. The index of nearly unity suggests
star formation triggered by self-instability, such as gravitation,
whereas the index near 2 indicates star formation induced by collisions,
for instance.
Although the K-S law shows a power-law correlation, the derived
power-law index shows the range of 1-2. There seems to
be a systematic difference in N between
normal spiral galaxies (![]() )
and starburst galaxies
(
)
and starburst galaxies
(
![]() ), and this may indicate a difference in the physical process of star formation
on the galactic scale. However, present data on the K-S law are based
mostly on quantities averaged over entire galaxies, and thus lack the spatial
resolution to constrain the physical nature of the law. The
local form of the K-S law for external galaxies was studied
using radial profiles of
), and this may indicate a difference in the physical process of star formation
on the galactic scale. However, present data on the K-S law are based
mostly on quantities averaged over entire galaxies, and thus lack the spatial
resolution to constrain the physical nature of the law. The
local form of the K-S law for external galaxies was studied
using radial profiles of
![]() and
and
![]() .
Hamajima & Tosa (1975) divided the disk of M 101 into inner and outer parts at
7 arcmin from the center, and N in the inner and outer parts was
.
Hamajima & Tosa (1975) divided the disk of M 101 into inner and outer parts at
7 arcmin from the center, and N in the inner and outer parts was
![]() and
and
![]() ,
respectively. Schuster et al. (2007) studied M 51
and derived
,
respectively. Schuster et al. (2007) studied M 51
and derived
![]() .
Recently, the local form of the K-S law,
when examined in various fields within a galaxy, has been investigated
for several cases. Kennicutt et al. (2007) investigated the K-S law in M 51
by using multiwavelength datasets: the far-infrared (IR),
H
.
Recently, the local form of the K-S law,
when examined in various fields within a galaxy, has been investigated
for several cases. Kennicutt et al. (2007) investigated the K-S law in M 51
by using multiwavelength datasets: the far-infrared (IR),
H![]() ,
Pa
,
Pa![]() ,
H I, and CO data. They centered 520 pc
apertures on H
,
H I, and CO data. They centered 520 pc
apertures on H![]() and 24
and 24 ![]() m emission peaks, and find
that the SFR versus H2 gas surface density relation is represented
by a power-law correlation with an index of
m emission peaks, and find
that the SFR versus H2 gas surface density relation is represented
by a power-law correlation with an index of
![]() .
Bigiel et al. (2008) also investigated the K-S law in
18 nearby galaxies on sub-kpc scales (0.75 kpc) by using multiwavelength
datasets. They obtain
.
Bigiel et al. (2008) also investigated the K-S law in
18 nearby galaxies on sub-kpc scales (0.75 kpc) by using multiwavelength
datasets. They obtain
![]() for the relation between
for the relation between
![]() and
and
![]() in their samples.
in their samples.
In general investigations of the K-S law require the SFR indicator and
the surface gas density derived from observations in various wavelengths
with similar spatial resolutions. The CO emission from active giant H II
regions (NGC 5447, 5455, and 5462) in M 101 and spiral arms in M 81 is too
faint to derive a reliable H2 mass (Kenney et al. 1991; Brouillet et al. 1991), and it is
difficult to investigate the K-S law in these regions. Far-IR
observations provide an alternative method to investigate the K-S law
for such objects. Spiral galaxies have warm and
cold dust components in general as first pointed out by de Jong et al. (1984) and
subsequently confirmed by ISO observations (see a review of Sauvage et al. 2005,
and references therein). The warm and cold dust components can be
related to the SFR of massive stars and to the gas
content, respectively (Cox & Mezger 1989). It should also be noted that far-IR
observations have an advantage of least attenuation by dust
extinction. Hence multi-band imaging far-IR observations provide us with an
opportunity to investigate the K-S law in individual regions of a
galaxy by their dataset alone. High-sensitivity observations with
multiple far-IR bands (more than three bands, one of which covers
100-200 ![]() m in wavelength) are required to separate the two
components. The Far-Infrared Surveyor (FIS) (Kawada et al. 2007) aboard
AKARI (Murakami et al. 2007) has four far-IR bands with the central
wavelengths of 65, 90, 140, and 160
m in wavelength) are required to separate the two
components. The Far-Infrared Surveyor (FIS) (Kawada et al. 2007) aboard
AKARI (Murakami et al. 2007) has four far-IR bands with the central
wavelengths of 65, 90, 140, and 160 ![]() m, and achieves high sensitivity with
relatively high spatial resolution (
m, and achieves high sensitivity with
relatively high spatial resolution (
![]() ).
The AKARI/FIS 4 bands enable us to spectrally decompose warm and cold
dust components, which is difficult with the Spitzer/MIPS
2 bands (MIPS70 and 160). The spectral deconvolution analysis produces maps
of the two components with a sufficiently high
S/N. Investigations of the K-S law in a galaxy can thus
be performed from AKARI/FIS datasets alone for galaxies.
).
The AKARI/FIS 4 bands enable us to spectrally decompose warm and cold
dust components, which is difficult with the Spitzer/MIPS
2 bands (MIPS70 and 160). The spectral deconvolution analysis produces maps
of the two components with a sufficiently high
S/N. Investigations of the K-S law in a galaxy can thus
be performed from AKARI/FIS datasets alone for galaxies.
In this paper we report the far-IR observations of M 81 and M 101 with the FIS.
M 81 and M 101 are excellent candidates for studying the K-S law in
various regions within a galaxy, since they have a large optical size of
more than 10 arcmin in diameter and well-developed spiral arms and
H II regions embedded therein. M 81 and M 101 are face-on spiral
galaxies with global spiral patterns, classified as SA(s)ab with a
distance of 3.6 Mpc (de Vaucouleurs et al. 1992; Freedman et al. 1994) and Sc(s)I with a distance
of 7.4 Mpc (Jurcevic & Butcher 2006; Sandage et al. 1981), respectively. Pérez-González et al. (2006)
investigated the IR properties and the SFR of various regions in M 81
based on Spitzer observations. They find that SFRs can be obtained by a
combination of the H![]() and the 24
and the 24 ![]() m luminosities, which are
tracers of unobscured and obscured SFRs, respectively. In this paper, we
present a method for estimating the gas and SFR surface density solely from
IR observations and discuss the K-S law in spiral arms of M 81 and M 101.
m luminosities, which are
tracers of unobscured and obscured SFRs, respectively. In this paper, we
present a method for estimating the gas and SFR surface density solely from
IR observations and discuss the K-S law in spiral arms of M 81 and M 101.
2 Observations and data reduction
2.1 AKARI/FIS observations
Table 1: Observation log.
M 81 and M 101 were observed as part of the FIS
calibration program on 2007 April 19 and 2006 June 14,
respectively, using the FIS01 observation modes. The observation log is
listed in Table 1.
Details of the FIS instrument and its in-orbit
performance and calibration are described in Kawada et al. (2007) and Shirahata et al. (2009).
The FIS was operated in a photometry mode with the four bands: N60
(65 ![]() m), WIDE-S (90
m), WIDE-S (90 ![]() m), WIDE-L (140
m), WIDE-L (140 ![]() m),
and N160 (160
m),
and N160 (160 ![]() m). The four bands of data are simultaneously
obtained in a pointing observation. Details of the observations and
results for M 101 are
described in Suzuki et al. (2007). The following describes those for
M 81. An observation consists of two sets of round-trip slow scans with a
shift in the cross-scan direction. The round-trip scan ensures data
redundancy for the correction of cosmic-ray radiation effects. The user-defined
parameters are set as the scan speed of 15 arcsec s-1,
the cross-scan shift
length of 240 arcsec, and the reset time interval of 0.5 s,
and these
parameters are chosen to make observations of an area larger than
10 arcmin. Three observations for M 81 were performed with
the above
parameters, in which a total area of
m). The four bands of data are simultaneously
obtained in a pointing observation. Details of the observations and
results for M 101 are
described in Suzuki et al. (2007). The following describes those for
M 81. An observation consists of two sets of round-trip slow scans with a
shift in the cross-scan direction. The round-trip scan ensures data
redundancy for the correction of cosmic-ray radiation effects. The user-defined
parameters are set as the scan speed of 15 arcsec s-1,
the cross-scan shift
length of 240 arcsec, and the reset time interval of 0.5 s,
and these
parameters are chosen to make observations of an area larger than
10 arcmin. Three observations for M 81 were performed with
the above
parameters, in which a total area of
![]() arcmin2 is observed with the four bands.
The FIS data were processed with the AKARI official pipeline
modules (version 20070914). In addition, we applied a series of
corrections for the cosmic-ray radiation effects following
Suzuki et al. (2007), and the details of the radiation effects on the FIS detectors
are described in Suzuki et al. (2008). Finally, four single-band images
(hereafter, four-band images) were created with grid sizes of 25 arcsec
for the WIDE-L and N160 bands and 15 arcsec for the
WIDE-S and N60 bands. The widths (FWHM) of the point
spread functions (PSFs) are
arcmin2 is observed with the four bands.
The FIS data were processed with the AKARI official pipeline
modules (version 20070914). In addition, we applied a series of
corrections for the cosmic-ray radiation effects following
Suzuki et al. (2007), and the details of the radiation effects on the FIS detectors
are described in Suzuki et al. (2008). Finally, four single-band images
(hereafter, four-band images) were created with grid sizes of 25 arcsec
for the WIDE-L and N160 bands and 15 arcsec for the
WIDE-S and N60 bands. The widths (FWHM) of the point
spread functions (PSFs) are ![]() 60 arcsec for the WIDE-L and
N160 bands and
60 arcsec for the WIDE-L and
N160 bands and ![]() 40 arcsec for the WIDE-S and
N60 bands (Kawada et al. 2007).
40 arcsec for the WIDE-S and
N60 bands (Kawada et al. 2007).
![\begin{figure}
\par\includegraphics[width=12cm,clip]{aa14529-fig1.eps}
\end{figure}](/articles/aa/full_html/2010/13/aa14529-10/img43.png)
|
Figure 1:
Four-band images of M 81 in the N60 ( top-left),
WIDE-S ( top-right), WIDE-L ( bottom-left), and
N160 ( bottom-right) bands. The center wavelengths of the four
bands are 65 |
| Open with DEXTER | |
The far-IR flux densities in the four bands were obtained by integrating the
surface brightness within an aperture after subtracting the sky background
level. The background levels were estimated and subtracted using nearby
regions of blank sky, which were observed in the beginning and at the
end of the scan. To obtain the fluxes of the whole galaxy,
the photometric aperture with the major axis of 11 arcmin and the minor
axis of 7 arcmin around the center was used, which roughly delineates
the contour level of 0.5% of the peak intensity at B-band. It includes
most of the far-IR emission from the galaxy without degrading the S/N.
The loss of the fluxes outside the aperture was estimated to be
less than 10%. To investigate spatial distributions of the cold
and warm dust components, the flux densities of the four bands are
derived from a circular aperture of 14 arcsec in radius by
applying aperture correction factors given in Shirahata et al. (2009).
Color corrections were also applied for the obtained flux densities by
assuming a modified black-body spectrum with the spectral index of unity.
The total errors in the photometry are estimated to be ![]() 30% for the
WIDE-L band,
30% for the
WIDE-L band, ![]() 40% for the N160 band, and
40% for the N160 band, and ![]() 20% for the WIDE-S
and N60 bands. Table 2 shows the derived flux densities of M 81
in the four bands of the FIS.
20% for the WIDE-S
and N60 bands. Table 2 shows the derived flux densities of M 81
in the four bands of the FIS.
The final four FIS mosaics are presented in Fig. 1. The images are smoothed with boxcar kernels with a width of 50 arcsec for the WIDE-L and N160 bands, and 30 arcsec for the WIDE-S and N60 bands. A number of bright spots can be seen along spiral arms in the N60 and WIDE-S band images, which correspond to H II regions (Allen et al. 1997). The WIDE-L and N160 band images also show bright far-IR emission near the spots that are seen in the N60 and WIDE-S band images.
Table 2: Flux densities of M 81.
2.2 Spitzer/MIPS observations
To investigate the relation between the warm dust luminosity and
the combination of the H![]() and the 24
and the 24 ![]() m IR luminosities, we
use Spitzer/MIPS and H
m IR luminosities, we
use Spitzer/MIPS and H![]() data for M 81 and M 101.
MIPS images at 24
data for M 81 and M 101.
MIPS images at 24 ![]() m for the galaxies were taken from the Spitzer
archive. Observations of M 81 and M 101 were part of the Spitzer Legacy
program 159 (PI: R. Kennicutt) and the Spitzer Guaranteed Time
Observation (GTO) program 60 (PI: G. Rieke), respectively. We retrieved
all post-BCD (basic calibrated data) images that were produced by the
pipeline version S18.12.0. The data were obtained in an MIPS scan map
mode (Rieke et al. 2004). Flux densities for whole galaxies are estimated
to be
m for the galaxies were taken from the Spitzer
archive. Observations of M 81 and M 101 were part of the Spitzer Legacy
program 159 (PI: R. Kennicutt) and the Spitzer Guaranteed Time
Observation (GTO) program 60 (PI: G. Rieke), respectively. We retrieved
all post-BCD (basic calibrated data) images that were produced by the
pipeline version S18.12.0. The data were obtained in an MIPS scan map
mode (Rieke et al. 2004). Flux densities for whole galaxies are estimated
to be
![]() Jy for M 81 and
Jy for M 81 and
![]() Jy for M 101, which
agree with those in Dale et al. (2007) (
Jy for M 101, which
agree with those in Dale et al. (2007) (
![]() Jy) and
Gordon et al. (2008) (
Jy) and
Gordon et al. (2008) (
![]() Jy), respectively. Photometry at various
fields in galaxies was carried out on the post-BCD images.
Jy), respectively. Photometry at various
fields in galaxies was carried out on the post-BCD images.
2.3 H observations
We used continuum subtracted H![]() images taken from Lin et al. (2003)
for M 81 and Knapen et al. (2004) for M 101. The images of M 81 and M 101 cover areas
of
images taken from Lin et al. (2003)
for M 81 and Knapen et al. (2004) for M 101. The images of M 81 and M 101 cover areas
of
![]() and
and
![]() ,
respectively. The data analyses and the calibration processes are
written in Lin et al. (2003) for M 81 and Knapen et al. (2004) for M 101. In the following discussion, we
use pure H
,
respectively. The data analyses and the calibration processes are
written in Lin et al. (2003) for M 81 and Knapen et al. (2004) for M 101. In the following discussion, we
use pure H![]() flux that is corrected for [NII] contamination.
We applied an [NII]/H
flux that is corrected for [NII] contamination.
We applied an [NII]/H![]() emission line constant ratio of 0.4 to
M 81 (Garnett & Shields 1987) and the radius-dependent ratio to
M 101 (Smith 1975): 0.58 at the galactic center, 0.04 on the outskirts of the galaxy.
emission line constant ratio of 0.4 to
M 81 (Garnett & Shields 1987) and the radius-dependent ratio to
M 101 (Smith 1975): 0.58 at the galactic center, 0.04 on the outskirts of the galaxy.
3 Results
3.1 Spectral energy distribution of M 81
![\begin{figure}
\par\includegraphics[width=8.9cm,clip]{14529fig2.ps}
\end{figure}](/articles/aa/full_html/2010/13/aa14529-10/img54.png)
|
Figure 2: Spectral energy distribution of M 81, together with the best-fit double-temperature modified blackbody plus PAH component model. Filled boxes, open circles, and open diamonds correspond to the integrated flux densities in the FIS four bands, IRAS bands (Rice et al. 1988), and Spitzer bands (Dale et al. 2007), respectively. The solid line shows the best-fit model. The dotted line, the dashed line, and the dash-dotted line represent the warm dust, the cold dust, and the PAHs components, respectively. |
| Open with DEXTER | |
Figure 2 shows the spectral energy distribution (SED) of
M 81 constructed from the flux
densities in Table 2. The integrated flux
densities in the four bands are shown with those in the IRAS bands (12, 25, 60, and 100 ![]() m) and
Spitzer bands (8, 24, 70, and 160
m) and
Spitzer bands (8, 24, 70, and 160 ![]() m) (Dale et al. 2007; Rice et al. 1988).
The present results agree with the IRAS and Spitzer data.
The figure suggests that the warm dust emission makes a significant contribution
at 70
m) (Dale et al. 2007; Rice et al. 1988).
The present results agree with the IRAS and Spitzer data.
The figure suggests that the warm dust emission makes a significant contribution
at 70 ![]() m, and we need at least data at two wavelengths longer than
70
m, and we need at least data at two wavelengths longer than
70 ![]() m to correctly estimate the cold component.
To obtain the warm
dust temperature, we fit the mid-IR data of IRAS and Spitzer, in
addition to the far-IR data with a model
of dust emission, which is described by
m to correctly estimate the cold component.
To obtain the warm
dust temperature, we fit the mid-IR data of IRAS and Spitzer, in
addition to the far-IR data with a model
of dust emission, which is described by
where
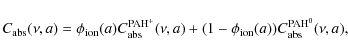
where n, a, T,
Table 3: Properties of the far-IR dust emission in M 81.
By using the best-fit modified blackbody model, the far-IR
luminosities of the cold dust component, ![]() and the warm dust
component,
and the warm dust
component, ![]() can be calculated by
can be calculated by
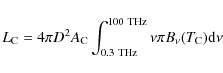
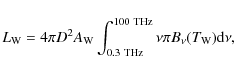
where D is the distance to M 81 (3.6 Mpc, Freedman et al. 1994). The derived luminosities are summarized in Table 3. The resulting total far-IR luminosity
![\begin{figure}
\par\includegraphics[width=12.25cm,clip]{aa14529-fig3.eps} \vspace*{2.5mm}
\end{figure}](/articles/aa/full_html/2010/13/aa14529-10/img96.png)
|
Figure 3:
Top panels: spatial distributions of the cold dust ( left) and warm dust ( right) components of M 81. The contours are linearly spaced from 5%
to 95% of the peak with a step of 5%. The peak luminosity is
|
| Open with DEXTER | |
We assume the dust absorption coefficient given by Hildebrand (1983),
an average grain radius of 0.1 ![]() m, and a specific dust mass
density of 3 g cm-3. Then the mass of dust,
m, and a specific dust mass
density of 3 g cm-3. Then the mass of dust, ![]() ,
becomes
,
becomes
where L is luminosity. The dust temperatures are set to be equal to those derived from the above SED fitting. Table 3 shows that the warm dust mass occupies less than 1% of the total dust mass in M 81. The fractional dust mass of the warm dust is comparable to 0.4% of M 101 (Suzuki et al. 2007).
3.2 Spatial distributions of cold and warm dust
To derive the distributions of the cold and warm dust components in M 81, as applied to the four-band images of M 101 (Suzuki et al. 2007), the spatial resolutions of the original WIDE-S and N60 images are reduced to match those of the WIDE-L and N160 images by convolving the former images with a Gaussian kernel. The images are then resized with the common spatial scale among the four bands, 25 arcsec/pixel. An individual SED constructed from the four band fluxes at each image bin is then fitted with the sum of two modified blackbodies, in which only the amplitudes of the blackbodies are set to be free. The temperatures are fixed at the values obtained from the SED of the whole galaxy, since they are poorly constrained by the present dataset. Pérez-González et al. (2006) indicate no significant radial gradients in the cold and warm dust temperatures in spiral arms. We assume the same dust mass opacity for the two types of dust.
![\begin{figure}
\par\includegraphics[width=12cm]{14529fig4.ps}
\end{figure}](/articles/aa/full_html/2010/13/aa14529-10/img99.png)
|
Figure 4: Upper panels: the distributions of cold and warm dust components in M 81. Blue circles indicate regions within the spiral arms. Bottom panels: the same as the upper panels, but for M 101. The positions of the four giant H II regions and contiguous regions analyzed in the text are indicated with red circles. Blue circles indicate regions within the spiral arms that lie within 5 arcmin of the galaxy center and were analyzed separately. The circles' radii are set to 1.0 kpc (57 arcsec) and 1.2 kpc (33 arcsec) for M 81 and M 101, respectively. |
| Open with DEXTER | |
Table 4: Local far-IR luminosities in M 81.
Figure 3 shows the distributions of the dust
emission thus spectrally deconvolved into the two components, and the
reduced ![]() (
(
![]() )
maps for M 81 and M 101;
)
maps for M 81 and M 101;
![]() 's
are calculated for residuals of the SED fitting, where
's
are calculated for residuals of the SED fitting, where
![]() with 2 degrees of freedom corresponds to a confidence level higher
than 95%. Therefore in most regions of the galaxies, no additional
dust component is statistically required.
As shown in Fig. 3, the cold dust component is distributed
over the entire extent of the galaxy, while the warm dust component
shows concentrations in the center of the galaxy and spiral
arms. Local far-IR luminosities obtained from
with 2 degrees of freedom corresponds to a confidence level higher
than 95%. Therefore in most regions of the galaxies, no additional
dust component is statistically required.
As shown in Fig. 3, the cold dust component is distributed
over the entire extent of the galaxy, while the warm dust component
shows concentrations in the center of the galaxy and spiral
arms. Local far-IR luminosities obtained from
![]() are compared with those from Pérez-González et al. (2006) as
shown in Table 4. Three local fields are selected from
Pérez-González et al. (2006), which are located at the center of the galaxy and the
northern spiral arm. The local far-IR luminosities
L(8-1000) are
calculated from Eq. (2) in Pérez-González et al. (2006) by using the three
Spitzer/MIPS fluxes. In each field, far-IR luminosity from AKARI is in
good agreement with the one from Spitzer.
are compared with those from Pérez-González et al. (2006) as
shown in Table 4. Three local fields are selected from
Pérez-González et al. (2006), which are located at the center of the galaxy and the
northern spiral arm. The local far-IR luminosities
L(8-1000) are
calculated from Eq. (2) in Pérez-González et al. (2006) by using the three
Spitzer/MIPS fluxes. In each field, far-IR luminosity from AKARI is in
good agreement with the one from Spitzer.
![\begin{figure}
\par\includegraphics[width=8.6cm]{14529fig5a.ps}\hspace*{2mm}
\includegraphics[width=8.5cm]{14529fig5b.ps}
\end{figure}](/articles/aa/full_html/2010/13/aa14529-10/img109.png)
|
Figure 5:
Correlation between the cold and warm dust emission intensities
for various regions in M 101 ( left) and M 81 ( right). The filled circles
and filled boxes represent spiral arms and giant H II regions,
respectively. The lines indicate the best-fit power-law models. As for
M 101, the resulting power-law index for spiral arms and giant
H II regions is |
| Open with DEXTER | |
3.3 Power-law relation between cold and warm dust emission intensities
In M 101, there are four giant H II regions (NGC 5447, 5455, 5461, and 5462) near the outskirts of the galaxy, whose star-formation activity is high in the galaxy. What triggers the four active giant H II regions is a subject of controversy. As one of the possibilities, it is suggested that intergalactic H I gas might fall into the outer disk near at least NGC 5461 and 5462 (Van der Hulst & Sancisi 1988) as a result of a past encounter of M 101 with its companion dwarf galaxy NGC 5477. Therefore, star formation in giant H II regions may be triggered not by spiral density wave but by external effects. The K-S law for various regions within a galaxy may show a difference in N depending on the physical processes of star formation on a kiloparsec scale. To investigate the difference in the spatial variation of the power-law index N, we derive the luminosity surface densities of the cold and warm dust components in various fields. In Fig. 4, for M 101, the spiral arm regions are defined as the locations at the spiral arms within 5 arcmin from the galactic center. The positions of the circles are selected from B-band images by hand. Since there is a possibility that H I gas infall disturbs not only four giant H II regions but also contiguous regions, we also select regions of the second red circles next to the H II regions. In fact, the data of the second red circles show a trend similar to those of the H II regions (see below). We call these fields giant H II regions in the following. For both M 81 and M 101, we discuss the local K-S law in the spiral arms. Star formation process in the interarm region is an interesting issue, particularly for the study of the threshold density for star formation. In this paper, however, we focus on the star formation process in active regions and will not discuss the threshold mainly because the limited spatial resolution prevents us from correctly extracting the surface intensity of faint interarm regions of M 81 and M 101.
Figure 5 shows the relation between the cold and warm dust emission intensities. In the regions in M 81 and M 101, power-law correlations are apparent in the expected sense that the emission intensity of warm dust increases with that of cold dust. In the figure, the lines show the best-fit power-law model; the fitting is carried out by least-squares regression that takes the uncertainties in the cold and warm dust emission intensities into account. The uncertainties are dominated by SED-fitting errors. Power-law fits indicate a systematic difference in the power-law index from region to region in M 101. The variation in the index is not seen in M 81.
![\begin{figure}
\par\includegraphics[width=8.9cm,clip]{14529fig6.ps}
\end{figure}](/articles/aa/full_html/2010/13/aa14529-10/img110.png)
|
Figure 6: Azimuthally averaged H2 gas-to-cold dust ratio in M 101. The azimuthally averaged cold dust mass is derived from the spatial distribution of the cold dust component (Suzuki et al. 2007). The azimuthally averaged H2 gas mass is taken from Kenney et al. (1991). The broken line shows the averaged ratio. |
| Open with DEXTER | |
4 Discussions
4.1 Estimates of gas and SFR
The correlation between cold and warm dust emission intensities may be translated into the correlation between the gas surface density and the SFR surface density. The cold dust component is heated by diffuse heating sources, such as old stellar populations or nonionising UV photons escaping from H II regions. The warm dust component is correlated with the spotty structures that belong to spiral arms. As Cox & Mezger (1989) pointed out, the cold and warm dust luminosities can be related to the gas content and the SFR of massive stars, respectively.
4.1.1 Estimate of H2 mass from the cold dust luminosity
The local cold dust mass is estimated from Eq. (6) with the
temperature of the cold dust component derived from the SED of the whole
galaxy. The gas mass is then derived from the mass of the cold dust by
using an H2 gas-to-cold dust ratio as
where
4.1.2 Estimate of SFR from the warm dust luminosity
In recent years, the SFR estimator has
been calibrated against dust extinction and an extinction corrected SFR
has been applied widely using the combination of H![]() and 24
and 24 ![]() m IR
luminosities (Calzetti et al. 2007; Pérez-González et al. 2006; Kennicutt et al. 2009,2007; Prescott et al. 2007). The IR emission near H II regions is linked to the dust heated by the light coming
from newly formed stars in H II regions, while the H
m IR
luminosities (Calzetti et al. 2007; Pérez-González et al. 2006; Kennicutt et al. 2009,2007; Prescott et al. 2007). The IR emission near H II regions is linked to the dust heated by the light coming
from newly formed stars in H II regions, while the H![]() (or UV) emission (without any extinction correction) is linked to the
photons arising from those young stars that are not
absorbed by dust in the diffuse ISM. Calzetti et al. (2007) performed a calibration
for the combined SFR estimator that was based on measurements of fluxes
over typical aperture sizes of
(or UV) emission (without any extinction correction) is linked to the
photons arising from those young stars that are not
absorbed by dust in the diffuse ISM. Calzetti et al. (2007) performed a calibration
for the combined SFR estimator that was based on measurements of fluxes
over typical aperture sizes of ![]() 200-600 pc on H II
regions/complexes in 33 nearby galaxies. They proposed an H
200-600 pc on H II
regions/complexes in 33 nearby galaxies. They proposed an H![]() luminosity corrected for dust extinction as
luminosity corrected for dust extinction as

where
The luminosity relation with a slope of unity means that the corrected H
From Eqs. (9) and (10), the SFR can be derived from the warm dust luminosity as
![\begin{figure}
\par\includegraphics[width=9cm,clip]{14529fig7.ps}
\end{figure}](/articles/aa/full_html/2010/13/aa14529-10/img126.png)
|
Figure 7:
Correlation between the warm dust luminosity and the combination
of H |
| Open with DEXTER | |
Table 5: Power-law indices for the regions in M 101 and M 81.
![\begin{figure}
\par\includegraphics[width=8.6cm]{14529fig8a.ps}\hspace*{2mm}
\includegraphics[width=8.5cm]{14529fig8b.ps}
\end{figure}](/articles/aa/full_html/2010/13/aa14529-10/img130.png)
|
Figure 8:
Relation between H2 gas surface density
(
|
| Open with DEXTER | |
4.2 Local Kennicutt-Schmidt law in galaxies
From Eqs. (7) and (11), the correlation between
![]() and
and ![]() can be converted into the
correlation between
can be converted into the
correlation between
![]() and SFR.
The surface densities are calculated by dividing
and SFR.
The surface densities are calculated by dividing
![]() and
SFR by the deprojected surface area in each local field.
The relations between H2 gas surface density (
and
SFR by the deprojected surface area in each local field.
The relations between H2 gas surface density (
![]() )
and SFR surface density (
)
and SFR surface density (
![]() )
thus obtained for various
regions within the galaxies are shown in Fig. 8.
The ranges of the gas and SFR surface densities in the
observed regions are in good agreement with those in the normal spiral
galaxies of Kennicutt samples (Kennicutt 1998). This result supports
the conclusion that M 81 and M 101 can be classified as normal spiral
galaxies as discussed in Sect. 3.1 and Suzuki et al. (2007). In Fig. 8,
the lines show the best fit power-law model, and the fitting is
carried out by least-squares regression that takes the
uncertainties in the SFR and gas surface
densities into account. Uncertainties in the SFR surface
densities are dominated by those in SED fitting and the calibration of SFR from
)
thus obtained for various
regions within the galaxies are shown in Fig. 8.
The ranges of the gas and SFR surface densities in the
observed regions are in good agreement with those in the normal spiral
galaxies of Kennicutt samples (Kennicutt 1998). This result supports
the conclusion that M 81 and M 101 can be classified as normal spiral
galaxies as discussed in Sect. 3.1 and Suzuki et al. (2007). In Fig. 8,
the lines show the best fit power-law model, and the fitting is
carried out by least-squares regression that takes the
uncertainties in the SFR and gas surface
densities into account. Uncertainties in the SFR surface
densities are dominated by those in SED fitting and the calibration of SFR from
![]() ,
while those in the gas surface densities are dominated
by SED fitting errors.
The resulting power-law indices are summarized in Table 5.
There are significant differences in N between giant
H II regions and the spiral arms in M 101, while N for the spiral arms
in M 101 is similar to N for the spiral arms in M 81.
,
while those in the gas surface densities are dominated
by SED fitting errors.
The resulting power-law indices are summarized in Table 5.
There are significant differences in N between giant
H II regions and the spiral arms in M 101, while N for the spiral arms
in M 101 is similar to N for the spiral arms in M 81.
Table 5 shows that the indices of spiral arms in M 81 and those in
M 101 are ![]() ,
which shows the same values as those for
the disk-averaged normal spiral galaxy samples (Kennicutt 1998) and
our Galaxy (Misiriotis et al. 2006) obtained from H
,
which shows the same values as those for
the disk-averaged normal spiral galaxy samples (Kennicutt 1998) and
our Galaxy (Misiriotis et al. 2006) obtained from H![]() ,
far-IR, H I, and
CO observations, while N of nearly unity in giant
H II regions is in good agreement with those in the starburst
galaxy samples in Taniguchi & Ohyama (1998). The suggested starburst-like
activity in the four giant H II regions supports
the conclusion that star formation activity in the regions is highest in
M 101 (Suzuki et al. 2007). It is also compatible with
the result that the relation between the aromatic
feature equivalent widths and the ionization index for the four giant
H II regions is similar for starburst
galaxies (Gordon et al. 2008). As for the comparison to the other
results of the local K-S law (
,
far-IR, H I, and
CO observations, while N of nearly unity in giant
H II regions is in good agreement with those in the starburst
galaxy samples in Taniguchi & Ohyama (1998). The suggested starburst-like
activity in the four giant H II regions supports
the conclusion that star formation activity in the regions is highest in
M 101 (Suzuki et al. 2007). It is also compatible with
the result that the relation between the aromatic
feature equivalent widths and the ionization index for the four giant
H II regions is similar for starburst
galaxies (Gordon et al. 2008). As for the comparison to the other
results of the local K-S law (
![]() vs.
vs.
![]() )
in spiral arms, the power-law indices
for M 81 and M 101 (
)
in spiral arms, the power-law indices
for M 81 and M 101 (![]() )
show higher values than those for normal
spiral galaxies in Kennicutt et al. (2007) and Bigiel et al. (2008). The difference
may be attributed to the cold dust component potentially
including the contribution for HI gas. As discussed by
Kennicutt et al. (2007), the power-law index for the SFR versus total
(H I+H2) gas surface density relation shows a higher
value than for the SFR versus H2 gas surface density
relation. This is because the H I gas contribution is
proportionally greater in the lowest gas surface density regions. Similar
trends in H I gas surface density can be found in M 81 and M 101
(Kenney et al. 1991; Rots 1975).
)
show higher values than those for normal
spiral galaxies in Kennicutt et al. (2007) and Bigiel et al. (2008). The difference
may be attributed to the cold dust component potentially
including the contribution for HI gas. As discussed by
Kennicutt et al. (2007), the power-law index for the SFR versus total
(H I+H2) gas surface density relation shows a higher
value than for the SFR versus H2 gas surface density
relation. This is because the H I gas contribution is
proportionally greater in the lowest gas surface density regions. Similar
trends in H I gas surface density can be found in M 81 and M 101
(Kenney et al. 1991; Rots 1975).
As previously mentioned, M 101 shows a radial oxygen abundance gradient. We examine the effect of the spatial variation of the CO-to-H2 conversion factor by assuming that it is a linear function of the galactocentric radius. By accounting for the azimuthally averaged H2 gas-to-cold dust ratio that varies with the radius, the gas mass is recalculated. The results indicate that the obtained power-law indices are systematically increased. However, the variations are within the uncertainties shown in Table 5. Thus, the oxygen abundance gradient in M 101 does not affect the result of the spatial variation in N. Hamajima & Tosa (1975) investigated the relation between the number of H II regions and H I gas in two regions of M 101. They divided the inner and outer regions at 7 arcmin from the galaxy center. The outer region contains the four giant H II regions. Although the azimuthally averaged relation showed a power-law correlation, the obtained power-law index was about 2 for the both regions and no significant difference was seen. The poor spatial resolution of their H I map (4 arcmin) may have made it difficult to distinguish the difference in N in M 101. The present observations allow us to investigate the K-S law with much higher spatial resolution and clearly reveals the spatial variation of N within the disk of M 101.
Generally, multiwavelength observations
(e.g. H![]() ,
IR, H I, and CO) with high sensitivity and high
spatial resolution are required to investigate the K-S law on kiloparsec
scales in a nearby galaxy. However, the datasets are not readily
available for a large galaxy sample. A small number of galaxies have
a complete dataset. For example, CO emission is too
faint to derive a reliable H2 mass in spiral arm regions in M 81.
Far-IR observations with AKARI alone enable
us to derive the SFR and H2 surface densities in individual regions
of galaxies. This capability provides a useful database with which the K-S
law can be investigated for galaxies, whose multiwavelength datasets are
not readily available. It can also be applied to a very large galaxy
sample that has identical datasets obtained by the AKARI All Sky Survey.
,
IR, H I, and CO) with high sensitivity and high
spatial resolution are required to investigate the K-S law on kiloparsec
scales in a nearby galaxy. However, the datasets are not readily
available for a large galaxy sample. A small number of galaxies have
a complete dataset. For example, CO emission is too
faint to derive a reliable H2 mass in spiral arm regions in M 81.
Far-IR observations with AKARI alone enable
us to derive the SFR and H2 surface densities in individual regions
of galaxies. This capability provides a useful database with which the K-S
law can be investigated for galaxies, whose multiwavelength datasets are
not readily available. It can also be applied to a very large galaxy
sample that has identical datasets obtained by the AKARI All Sky Survey.
4.3 Star formation process on kpc scales
Our investigation of various regions within galaxies suggests that the power-law index of the K-S law is not always constant within a galaxy. The difference in the index may be attributed to the difference in the star formation process on a kiloparsec scale. In the following, we discuss possible explanations of star formation processes for the observed power-law indices.
The general features of the spiral arms in M 81 and M 101 can be
explained by the density wave theory (Rogstad 1971; Kaufman et al. 1989).
The orbit crowding in spiral arms enhances the number density of gas
clouds and thus increases the cloud-cloud collision
rate. Scoville et al. (1986) found that the number density of H II
regions varies as
![]() .
Therefore, the SFR density is
proportional to
.
Therefore, the SFR density is
proportional to
![]() .
They suggest that the compression
of molecular gas in the interface between colliding clouds
is a dominant mode for OB star formation in our Galaxy. Detailed
observations of individual star-forming regions also suggest that
cloud-cloud collisions are an important triggering mechanism for OB star
formation (Hasegawa et al. 1994; Scoville et al. 1987; Maddalena et al. 1986). Thus,
with the assumption that the scale height of a disk is
constant, the power-law index,
.
They suggest that the compression
of molecular gas in the interface between colliding clouds
is a dominant mode for OB star formation in our Galaxy. Detailed
observations of individual star-forming regions also suggest that
cloud-cloud collisions are an important triggering mechanism for OB star
formation (Hasegawa et al. 1994; Scoville et al. 1987; Maddalena et al. 1986). Thus,
with the assumption that the scale height of a disk is
constant, the power-law index, ![]() ,
obtained in spiral arms in
M 81 and M 101 can be accounted for by star formation by the
cloud-cloud collision enhanced by the spiral density wave.
,
obtained in spiral arms in
M 81 and M 101 can be accounted for by star formation by the
cloud-cloud collision enhanced by the spiral density wave.
Tidal interaction between gas-rich galaxies can also activate star
formation in a galaxy. M 101 is thought to have tidally interacted with a
companion dwarf galaxy in the past.
Van der Hulst & Sancisi (1988) discovered high speed (![]() 150 km s-1) H I
gas falling into the outskirts of the galaxy. The infall may have resulted
from the interaction, although it is not yet clear why H I gas
falls only into the outer disk. Santillán et al. (1999) numerically simulated
the interaction of high-velocity clouds (200 km s-1) with a magnetized
galactic disk. As the gas falls into the disk,
perturbation of the magnetic field lines can trigger the Parker
instability. According to Parker (1966), as the instability develops, large magnetic
loops above the galactic plane are created, and dense molecular clouds
are formed in the gas concentrated at the pools, which are indentations of the
magnetic field. Once star formation begins, the average SFR becomes
proportional to
150 km s-1) H I
gas falling into the outskirts of the galaxy. The infall may have resulted
from the interaction, although it is not yet clear why H I gas
falls only into the outer disk. Santillán et al. (1999) numerically simulated
the interaction of high-velocity clouds (200 km s-1) with a magnetized
galactic disk. As the gas falls into the disk,
perturbation of the magnetic field lines can trigger the Parker
instability. According to Parker (1966), as the instability develops, large magnetic
loops above the galactic plane are created, and dense molecular clouds
are formed in the gas concentrated at the pools, which are indentations of the
magnetic field. Once star formation begins, the average SFR becomes
proportional to
![]() .
If star formation is induced by the
Parker instability,
.
If star formation is induced by the
Parker instability, ![]() is equal to zero or
is equal to zero or
![]() (Elmegreen 1994). Star formation in giant
molecular clouds is also a possible explanation of the power-law index of
unity (Gao & Solomon 2004). For M 101, in view of the other observational
results, the power-law index of unity
derived for giant H II regions may be attributed to
star-formation induced by the Parker instability triggered by the
high-velocity H I gas infall.
(Elmegreen 1994). Star formation in giant
molecular clouds is also a possible explanation of the power-law index of
unity (Gao & Solomon 2004). For M 101, in view of the other observational
results, the power-law index of unity
derived for giant H II regions may be attributed to
star-formation induced by the Parker instability triggered by the
high-velocity H I gas infall.
M 81 has also experienced tidal interaction with M 82. The two galaxies are connected by a stream of H I gas. Cottrell (1977) investigated the H I velocity field in the region surrounding M 81 and M 82, concluding that the gas in M 82 might be the H I gas captured from the outer parts of M 81 during the encounter; the stream of H I gas is in the direction from M 81 toward M 82. No evidence of the H I gas infall into M 81 is suggested. This is compatible with the power-law index in M 81 not showing a spatial variation in the power-law index as seen in M 101.
5 Conclusions
The face-on spiral galaxies M 81 and M 101 were observed with the FIS
aboard AKARI. The SEDs of the whole galaxies show the presence of the
cold dust component (
![]() K) in
addition to the warm dust component (
K) in
addition to the warm dust component (
![]() K). We deconvolved
the cold and warm dust emission components spectrally by making the best
use of the multi-band photometric capability of the FIS. It is shown that the
warm dust is associated
with the center of the galaxy and spiral
arms. The cold and warm dust components can be converted into the gas mass
and the SFR, respectively, which show power-law
correlations in various regions. We find that the power-law index is not
always constant within a galaxy.
K). We deconvolved
the cold and warm dust emission components spectrally by making the best
use of the multi-band photometric capability of the FIS. It is shown that the
warm dust is associated
with the center of the galaxy and spiral
arms. The cold and warm dust components can be converted into the gas mass
and the SFR, respectively, which show power-law
correlations in various regions. We find that the power-law index is not
always constant within a galaxy.
We discuss possible explanations of star formation processes for the
observed power-law indices. The power-law index of ![]() 2 seen in the
spiral arms in M 81 and M 101 indicates a scenario of star formation
triggered by cloud-cloud collisions enhanced by spiral density wave,
while the power-law index of unity derived in giant H II
regions suggests star formation induced by the Parker instability
triggered by high-velocity H I gas infall.
2 seen in the
spiral arms in M 81 and M 101 indicates a scenario of star formation
triggered by cloud-cloud collisions enhanced by spiral density wave,
while the power-law index of unity derived in giant H II
regions suggests star formation induced by the Parker instability
triggered by high-velocity H I gas infall.
The present method can be applied to a very large galaxy sample with identical datasets from the AKARI All Sky Survey.
AcknowledgementsWe would like to thank all the members of the AKARI project for their continuous help and support. The present work is based on observations with AKARI, a JAXA project with the participation of ESA. We are grateful to the AKARI data reduction team for their extensive work in developing data analysis pipelines. We thank Dr. H. Matsuhara and Dr. T. Goto for useful comments. This work is based in part on archival data obtained with the Spitzer Space Telescope, which is operated by the Jet Propulsion Laboratory, California Institute of Technology under a contract with NASA. Support for this work was provided by an award issued by JPL/Caltech. We gratefully acknowledge Dr. W. Lin and Dr. J. H. Knapen for providing the H
References
- Allen, R. J., Knapen, J. H., Bohlin, R., & Stecher, T. P. 1997, ApJ, 487, 171 [NASA ADS] [CrossRef] [Google Scholar]
- Bigiel, F., Leroy, A., Walter, F., et al. 2008, AJ, 136, 2846 [NASA ADS] [CrossRef] [Google Scholar]
- Brouillet, N., Baudry, A., Combes, F., Kaufman, M., & Bash, F. 1991, A&A, 242, 35 [NASA ADS] [Google Scholar]
- Calzetti, D., Kennicutt, R. C., Engelbracht, C. W., et al. 2007, ApJ, 666, 870 [NASA ADS] [CrossRef] [Google Scholar]
- Chynoweth, K. M., Langston, G. I., Yun, M. S., et al. 2008, AJ, 135, 1983 [NASA ADS] [CrossRef] [Google Scholar]
- Cottrell, G. A. 1977, MNRAS, 178, 577 [NASA ADS] [Google Scholar]
- Cox, P., & Mezger, P. G. 1989, A&ARv, 1, 49 [NASA ADS] [CrossRef] [Google Scholar]
- Dale, D. A., Gil de Paz, A., Gordon, K. D., et al. 2007, ApJ, 655, 863 [NASA ADS] [CrossRef] [Google Scholar]
- de Jong, T., Clegg, P. E., Rowan-Robinson, M., et al. 1984, ApJ, 278, L67 [NASA ADS] [CrossRef] [Google Scholar]
- de Vaucouleurs, G., de Vaucouleurs, A., Corwin, Jr., H. G., et al. 1992, VizieR Online Data Catalog, 7137 [Google Scholar]
- Draine, B. T., & Li, A. 2007, ApJ, 657, 810 [NASA ADS] [CrossRef] [Google Scholar]
- Elmegreen, B. G. 1994, ApJ, 425, L73 [NASA ADS] [CrossRef] [Google Scholar]
- Freedman, W. L., Hughes, S. M., Madore, B. F., et al. 1994, ApJ, 427, 628 [NASA ADS] [CrossRef] [Google Scholar]
- Gao, Y., & Solomon, P. M. 2004, ApJ, 606, 271 [NASA ADS] [CrossRef] [Google Scholar]
- Garnett, D. R., & Shields, G. A. 1987, ApJ, 317, 82 [NASA ADS] [CrossRef] [Google Scholar]
- Gordon, K. D., Pérez-González, P. G., Misselt, K. A., et al. 2004, ApJS, 154, 215 [NASA ADS] [CrossRef] [Google Scholar]
- Gordon, K. D., Engelbracht, C. W., Rieke, G. H., et al. 2008, ApJ, 682, 336 [NASA ADS] [CrossRef] [Google Scholar]
- Hamajima, K., & Tosa, M. 1975, PASJ, 27, 561 [NASA ADS] [Google Scholar]
- Hasegawa, T., Sato, F., Whiteoak, J. B., & Miyawaki, R. 1994, ApJ, 429, L77 [NASA ADS] [CrossRef] [Google Scholar]
- Hildebrand, R. H. 1983, QJRAS, 24, 267 [NASA ADS] [Google Scholar]
- Jurcevic, J. S., & Butcher, D. 2006, in BAAS, 38, 92 [Google Scholar]
- Kaufman, M., Elmegreen, D. M., & Bash, F. N. 1989, ApJ, 345, 697 [NASA ADS] [CrossRef] [Google Scholar]
- Kawada, M., Baba, H., Barthel, P. D., et al. 2007, PASJ, 59, 389 [Google Scholar]
- Kenney, J. D. P., Scoville, N. Z., & Wilson, C. D. 1991, ApJ, 366, 432 [NASA ADS] [CrossRef] [Google Scholar]
- Kennicutt, Jr., R. C. 1998, ApJ, 498, 541 [NASA ADS] [CrossRef] [Google Scholar]
- Kennicutt, Jr., R. C., Calzetti, D., Walter, F., et al. 2007, ApJ, 671, 333 [NASA ADS] [CrossRef] [Google Scholar]
- Kennicutt, R. C., Hao, C., Calzetti, D., et al. 2009, ApJ, 703, 1672 [NASA ADS] [CrossRef] [Google Scholar]
- Knapen, J. H., Stedman, S., Bramich, D. M., Folkes, S. L., & Bradley, T. R. 2004, A&A, 426, 1135 [NASA ADS] [CrossRef] [EDP Sciences] [Google Scholar]
- Li, A., & Draine, B. T. 2001, ApJ, 554, 778 [Google Scholar]
- Lin, W., Zhou, X., Burstein, D., et al. 2003, AJ, 126, 1286 [NASA ADS] [CrossRef] [Google Scholar]
- Maddalena, R. J., Morris, M., Moscowitz, J., & Thaddeus, P. 1986, ApJ, 303, 375 [NASA ADS] [CrossRef] [Google Scholar]
- Misiriotis, A., Xilouris, E. M., Papamastorakis, J., Boumis, P., & Goudis, C. D. 2006, A&A, 459, 113 [NASA ADS] [CrossRef] [EDP Sciences] [Google Scholar]
- Murakami, H., Baba, H., Barthel, P., et al. 2007, PASJ, 59, 369 [Google Scholar]
- Parker, E. N. 1966, ApJ, 145, 811 [NASA ADS] [CrossRef] [Google Scholar]
- Pérez-González, P. G., Kennicutt, Jr., R. C., Gordon, K. D., et al. 2006, ApJ, 648, 987 [NASA ADS] [CrossRef] [Google Scholar]
- Pilyugin, L. S. 2001, A&A, 373, 56 [NASA ADS] [CrossRef] [EDP Sciences] [Google Scholar]
- Prescott, M. K. M., Kennicutt, Jr., R. C., Bendo, G. J., et al. 2007, ApJ, 668, 182 [NASA ADS] [CrossRef] [Google Scholar]
- Rice, W., Lonsdale, C. J., Soifer, B. T., et al. 1988, ApJS, 68, 91 [NASA ADS] [CrossRef] [Google Scholar]
- Rieke, G. H., Young, E. T., Engelbracht, C. W., et al. 2004, ApJS, 154, 25 [NASA ADS] [CrossRef] [Google Scholar]
- Rogstad, D. H. 1971, A&A, 13, 108 [NASA ADS] [Google Scholar]
- Rots, A. H. 1975, A&A, 45, 43 [NASA ADS] [Google Scholar]
- Sandage, A., Tammann, G. A., & van den Bergh, S. 1981, JRASC, 75, 267 [NASA ADS] [Google Scholar]
- Santillán, A., Franco, J., Martos, M., & Kim, J. 1999, ApJ, 515, 657 [NASA ADS] [CrossRef] [Google Scholar]
- Sauvage, M., Tuffs, R. J., & Popescu, C. C. 2005, Space Sci. Rev., 119, 313 [NASA ADS] [CrossRef] [Google Scholar]
- Schmidt, M. 1959, ApJ, 129, 243 [NASA ADS] [CrossRef] [Google Scholar]
- Schuster, K. F., Kramer, C., Hitschfeld, M., Garcia-Burillo, S., & Mookerjea, B. 2007, A&A, 461, 143 [NASA ADS] [CrossRef] [EDP Sciences] [Google Scholar]
- Scoville, N. Z., Sanders, D. B., & Clemens, D. P. 1986, ApJ, 310, L77 [NASA ADS] [CrossRef] [Google Scholar]
- Scoville, N. Z., Yun, M. S., Sanders, D. B., Clemens, D. P., & Waller, W. H. 1987, ApJS, 63, 821 [NASA ADS] [CrossRef] [Google Scholar]
- Shirahata, M., Matsuura, S., Hasegawa, S., et al. 2009, PASJ, 61, 737 [NASA ADS] [CrossRef] [Google Scholar]
- Siebenmorgen, R., Krügel, E., & Chini, R. 1999, A&A, 351, 495 [NASA ADS] [Google Scholar]
- Smith, H. E. 1975, ApJ, 199, 591 [NASA ADS] [CrossRef] [Google Scholar]
- Suzuki, T., Kaneda, H., Nakagawa, T., Makiuti, S., & Okada, Y. 2007, PASJ, 59, 473 [Google Scholar]
- Suzuki, T., Kaneda, H., Matsuura, S., et al. 2008, PASP, 120, 895 [NASA ADS] [CrossRef] [Google Scholar]
- Taniguchi, Y., & Ohyama, Y. 1998, ApJ, 509, L89 [NASA ADS] [CrossRef] [Google Scholar]
- Van der Hulst, T., & Sancisi, R. 1988, AJ, 95, 1354 [NASA ADS] [CrossRef] [Google Scholar]
- Wilson, C. D. 1995, ApJ, 448, L97 [NASA ADS] [CrossRef] [Google Scholar]
All Tables
Table 1: Observation log.
Table 2: Flux densities of M 81.
Table 3: Properties of the far-IR dust emission in M 81.
Table 4: Local far-IR luminosities in M 81.
Table 5: Power-law indices for the regions in M 101 and M 81.
All Figures
|
|
Figure 1:
Four-band images of M 81 in the N60 ( top-left),
WIDE-S ( top-right), WIDE-L ( bottom-left), and
N160 ( bottom-right) bands. The center wavelengths of the four
bands are 65 |
| Open with DEXTER | |
| In the text | |
|
|
Figure 2: Spectral energy distribution of M 81, together with the best-fit double-temperature modified blackbody plus PAH component model. Filled boxes, open circles, and open diamonds correspond to the integrated flux densities in the FIS four bands, IRAS bands (Rice et al. 1988), and Spitzer bands (Dale et al. 2007), respectively. The solid line shows the best-fit model. The dotted line, the dashed line, and the dash-dotted line represent the warm dust, the cold dust, and the PAHs components, respectively. |
| Open with DEXTER | |
| In the text | |
|
|
Figure 3:
Top panels: spatial distributions of the cold dust ( left) and warm dust ( right) components of M 81. The contours are linearly spaced from 5%
to 95% of the peak with a step of 5%. The peak luminosity is
|
| Open with DEXTER | |
| In the text | |
|
|
Figure 4: Upper panels: the distributions of cold and warm dust components in M 81. Blue circles indicate regions within the spiral arms. Bottom panels: the same as the upper panels, but for M 101. The positions of the four giant H II regions and contiguous regions analyzed in the text are indicated with red circles. Blue circles indicate regions within the spiral arms that lie within 5 arcmin of the galaxy center and were analyzed separately. The circles' radii are set to 1.0 kpc (57 arcsec) and 1.2 kpc (33 arcsec) for M 81 and M 101, respectively. |
| Open with DEXTER | |
| In the text | |
|
|
Figure 5:
Correlation between the cold and warm dust emission intensities
for various regions in M 101 ( left) and M 81 ( right). The filled circles
and filled boxes represent spiral arms and giant H II regions,
respectively. The lines indicate the best-fit power-law models. As for
M 101, the resulting power-law index for spiral arms and giant
H II regions is |
| Open with DEXTER | |
| In the text | |
|
|
Figure 6: Azimuthally averaged H2 gas-to-cold dust ratio in M 101. The azimuthally averaged cold dust mass is derived from the spatial distribution of the cold dust component (Suzuki et al. 2007). The azimuthally averaged H2 gas mass is taken from Kenney et al. (1991). The broken line shows the averaged ratio. |
| Open with DEXTER | |
| In the text | |
|
|
Figure 7:
Correlation between the warm dust luminosity and the combination
of H |
| Open with DEXTER | |
| In the text | |
|
|
Figure 8:
Relation between H2 gas surface density
(
|
| Open with DEXTER | |
| In the text | |
Copyright ESO 2010
Current usage metrics show cumulative count of Article Views (full-text article views including HTML views, PDF and ePub downloads, according to the available data) and Abstracts Views on Vision4Press platform.
Data correspond to usage on the plateform after 2015. The current usage metrics is available 48-96 hours after online publication and is updated daily on week days.
Initial download of the metrics may take a while.