| Issue |
A&A
Volume 521, October 2010
|
|
|---|---|---|
| Article Number | A63 | |
| Number of page(s) | 31 | |
| Section | Extragalactic astronomy | |
| DOI | https://doi.org/10.1051/0004-6361/201014295 | |
| Published online | 21 October 2010 | |
Massive star formation in Wolf-Rayet galaxies
V. Star-formation rates, masses and the importance of galaxy interactions
Á. R. López-Sánchez1,2
1 -
CSIRO Astronomy and Space Science / Australia Telescope National Facility, PO
Box 76, Epping, NSW 1710, Australia
2 - Instituto de Astrofísica de Canarias, C/ Vía Láctea S/N, 38200 La
Laguna, Tenerife, Spain
Received 20 February 2010 / Accepted 3 May 2010
Abstract
Aims. We performed a comprehensive analysis of a
sample of 20 starburst galaxies that show a substantial population of
very young massive stars, most of them classified as Wolf-Rayet
galaxies.
Methods. In this paper, the last in the series, we
analyze the global properties of our galaxy sample using
multiwavelength data extracted from our own observations (H![]() fluxes, B and H-band
magnitudes) and from the literature, which include X-ray, FUV, FIR, and
radio (both H I spectral
line and 1.4 GHz radio-continuum) measurements.
fluxes, B and H-band
magnitudes) and from the literature, which include X-ray, FUV, FIR, and
radio (both H I spectral
line and 1.4 GHz radio-continuum) measurements.
Results. The agreement between our H![]() -based
star-formation rates (S FR) and those
provided by indicators at other wavelengths is remarkable, but we
consider that the new H
-based
star-formation rates (S FR) and those
provided by indicators at other wavelengths is remarkable, but we
consider that the new H![]() -based
calibration provided by Calzetti et al. (2007, ApJ, 666, 870)
should be preferred to older calibrations. The FUV-based S FR
provides a powerful tool for analyzing the star-formation activity on
both global and local scales independently to the H
-based
calibration provided by Calzetti et al. (2007, ApJ, 666, 870)
should be preferred to older calibrations. The FUV-based S FR
provides a powerful tool for analyzing the star-formation activity on
both global and local scales independently to the H![]() emission. We provide empirical relationships between the ionized gas
mass, neutral gas mass, dust mass, stellar mass, and dynamical mass
with the B-luminosity. Although all mass
estimations increase with increasing luminosity, we find important
deviations to the general trend in some objects, which seem to be the
consequence of their particular evolutionary histories. The analysis of
the mass-to-light ratios give similar results. We investigate the
mass-metallicity relations and conclude that both the nature and the
star-formation history are needed to understand the relationships
between both properties. The majority of the galaxies follow a
Schmidt-Kennicutt scaling law of star-formation that agrees with that
reported in individual star-forming regions within M 51 but
not with that found in normal spiral galaxies. Dwarf galaxies seem to
be forming stars more efficiently than the outskirts of spiral
galaxies. We find a relation between the reddening coefficient and the
warm dust mass indicating that the extinction is mainly internal to the
galaxies. The comparison with the closed-box model also indicates that
the environment has strongly affected their evolution.
emission. We provide empirical relationships between the ionized gas
mass, neutral gas mass, dust mass, stellar mass, and dynamical mass
with the B-luminosity. Although all mass
estimations increase with increasing luminosity, we find important
deviations to the general trend in some objects, which seem to be the
consequence of their particular evolutionary histories. The analysis of
the mass-to-light ratios give similar results. We investigate the
mass-metallicity relations and conclude that both the nature and the
star-formation history are needed to understand the relationships
between both properties. The majority of the galaxies follow a
Schmidt-Kennicutt scaling law of star-formation that agrees with that
reported in individual star-forming regions within M 51 but
not with that found in normal spiral galaxies. Dwarf galaxies seem to
be forming stars more efficiently than the outskirts of spiral
galaxies. We find a relation between the reddening coefficient and the
warm dust mass indicating that the extinction is mainly internal to the
galaxies. The comparison with the closed-box model also indicates that
the environment has strongly affected their evolution.
Conclusions. Considering all multiwavelength data,
we found that 17 up to 20 galaxies are clearly interacting or merging
with low-luminosity dwarf objects or H I clouds.
The remaining three galaxies (Mkn 5, SBS 1054+364,
and SBS 1415+437) show considerable divergences of some
properties when comparing with similar objects. Many of the
interacting/merging features are only detected when deep optical
spectroscopy and a detailed multiwavelength analysis, including
H I observations, are
obtained. We conclude that interactions do play a fundamental role in
the triggering mechanism of the strong star-formation activity observed
in dwarf starburst galaxies.
Key words: galaxies: starburst - galaxies: interactions - galaxies: dwarf - galaxies: abundances - stars: Wolf-Rayet - galaxies: kinematics and dynamics
1 Introduction
Since the discovery of the starburst galaxies (Sargent & Searle
1970),
many studies have tried to understand the processes that trigger the
strong star-formation activity in these objects. The hypothesis that
the gravitational interaction (not necessarily merging) of galaxies
enhances star-formation or leads to starburst activity was made soon
after the recognition of the starburst phenomenon. Larson &
Tinsley (1978)
did a study of normal and peculiar (Arp 1966) samples of
galaxies and
demonstrated that recent (![]() 108 yr)
star-formation is more likely to occur in interacting than in
noninteracting galaxies.
Since then, numerous studies of individual galaxies have revealed the
fossil remnants of interaction/merger activity, increasing the evidence
that interactions and mergers trigger star-formation phenomena in
spiral galaxies (Koribalski 1996;
Kennicutt 1998;
Nikolic et al. 2004).
Infrared observations confirmed the very intense starbursts in major
disk-disk mergers (e.g., Joseph & Wright 1985; Solomon
& Sage 1988;
Sanders & Mirabel 1996;
Genzel et al. 1998;
Arribas et al. 2004).
Actually, almost 100% of galaxies with far-infrared (FIR) luminosities
of about 1012
108 yr)
star-formation is more likely to occur in interacting than in
noninteracting galaxies.
Since then, numerous studies of individual galaxies have revealed the
fossil remnants of interaction/merger activity, increasing the evidence
that interactions and mergers trigger star-formation phenomena in
spiral galaxies (Koribalski 1996;
Kennicutt 1998;
Nikolic et al. 2004).
Infrared observations confirmed the very intense starbursts in major
disk-disk mergers (e.g., Joseph & Wright 1985; Solomon
& Sage 1988;
Sanders & Mirabel 1996;
Genzel et al. 1998;
Arribas et al. 2004).
Actually, almost 100% of galaxies with far-infrared (FIR) luminosities
of about 1012 ![]() are in interacting/merging systems (Sanders 1997).
Furthermore, analysis of large-galaxy surveys (e.g., CfA2: Barton
et al. 2000;
2dF: Lambas et al. 2003;
SDSS: Nikolic et al. 2004)
has provided new evidence of interaction-induced starburst activity.
are in interacting/merging systems (Sanders 1997).
Furthermore, analysis of large-galaxy surveys (e.g., CfA2: Barton
et al. 2000;
2dF: Lambas et al. 2003;
SDSS: Nikolic et al. 2004)
has provided new evidence of interaction-induced starburst activity.
According to hierarchical clustering models of galaxy formation, larger galactic structures build up and grow through the accretion of dwarf galaxies (White & Frenk 1991; Kauffman & White 1993; Springer et al. 2005). Observations of local and distant luminous blue galaxies (LBG) and Lyman break galaxies seem to confirm that galaxy interactions are more common at high redshifts (e.g., Guzman et al. 1997; Hopkins et al. 2002; Erb et al. 2003; Werk et al 2004; Colina et al. 2005; Overzier et al. 2009; Cardamone et al. 2009), but many details are still unclear (i.e., Basu-Zych et al. 2009). Indeed, detailed studies of local interacting/merging galaxies provide vital clues to galaxy formation and evolution, as they constrain the properties of the hierarchical formation models.
Recent observations also suggest that interactions and mergers
between dwarf galaxies also trigger the star-formation activity
and play a fundamental role in the evolution of dwarf galaxies (i.e.,
Méndez & Esteban 2000;
Östlin et al. 2001,
2004;
Bergvall & Östlin 2002;
Johnson et al. 2004;
Bravo-Alfaro et al. 2004,
2006;
Cumming et al. 2008;
García-Lorenzo et al. 2008;
López-Sánchez & Esteban 2008,
2009; James
et al. 2010).
Many of these studies have been done on blue compact dwarf galaxies
(BCDGs), which are low-luminosity, low-metallicity (![]() 10% solar)
galaxies showing compact and irregular morphologies and undergoing an
intense and short-lived episode of star-formation (i.e., Izotov
& Thuan 1999;
Cairós et al. 2001a,b;
Papaderos et al. 2006),
on top of an old underlying population with ages of several Gyrs
(Noeske et al. 2003,
2005;
Amorín et al. 2007,
2009). Recent
numerical simulations (Bekki 2008)
satisfactorily explain the physical properties of BCDGs as a
consequence of the merging of two dwarf galaxies with a higher fraction
of gas and extended gas disks.
10% solar)
galaxies showing compact and irregular morphologies and undergoing an
intense and short-lived episode of star-formation (i.e., Izotov
& Thuan 1999;
Cairós et al. 2001a,b;
Papaderos et al. 2006),
on top of an old underlying population with ages of several Gyrs
(Noeske et al. 2003,
2005;
Amorín et al. 2007,
2009). Recent
numerical simulations (Bekki 2008)
satisfactorily explain the physical properties of BCDGs as a
consequence of the merging of two dwarf galaxies with a higher fraction
of gas and extended gas disks.
Actually, much of our knowledge of interacting galaxies has
been provided by H I observations.
Neutral hydrogen gas is the best tracer of galaxy-galaxy interactions
because the
H I distribution is
usually several times larger than the optical extent, hence more easily
disrupted by external forces (tidal interactions, gas infall, ram
pressure stripping) than the stellar disk (Broeils & van
Woerden 1994;
Salpeter & Hoffman 1996).
The distribution and kinematics of atomic gas within galaxies is
usually more or less regular, but in many cases they revealed complex
entities between galaxies such as tails, ripples, bridges, arcs, or
independent H I clumps
that, in many cases, show little disturbance in their corresponding
optical images (e.g., Schneider et al. 1989; Yun
et al. 1994;
Hibbard & van Gorkom 1996;
Verdes-Montenegro et al. 2001, 2002, 2005; Putman
et al. 2003;
Koribalski et al. 2003,
2004, 2005;
Temporin et al. 2003,
2005;
Emonts et al. 2006;
Ekta et al. 2008;
Koribalski & López-Sánchez 2009;
English et al. 2010;
see also The H I Rogues Gallery,
Hibbard et al. 2001). Several interferometric H I surveys,
such as The H I Nearby
Galaxy Survey (THINGS, Walter et al. 2008); the Local
Volume H I Survey
(LVHIS, Koribalski 2008) or the Faint Irregular Galaxies
GMRT Survey (FIGGS, Begum et al. 2008), are
providing accurate H I and
dynamical masses in hundreds of nearby galaxies, many of them dwarf
objects, as they account for ![]() 85% of the known galaxies in the Local Volume
(Karachentsev et al. 2004).
85% of the known galaxies in the Local Volume
(Karachentsev et al. 2004).
To understand interaction processes in dwarf galaxies we first have to know how stars and gas interact in low-mass environments. Indeed, feedback from massive stars is the dominant process that affects the interstellar medium (ISM) of these galaxies. Violent star-formation phenomena may disrupt the galaxy's gas and even expel it to the intergalactic medium, as some theoretical models predict (Mac Low & Ferrara 1999). But alternative models (e.g., Silich & Tenorio-Tagle 1998) and the available observations (Bomans 2005) suggest that dwarf galaxies keep their processed material. Furthermore, the links between the observational characteristics (fluxes, colors, morphologies, or sizes) and the underlying physical properties of the galaxies (stellar, dust, gas, baryonic, and dark matter content, chemical abundances, star-formation rate, and star-formation history) are still not well known.
For example, there are still many caveats in the understanding
of the interplay between the star-formation rate (S FR)
and the properties of the ISM. A very important step was taken with the
Schmidth-Kennicutt power-law relation (Schmidt 1959, 1963; Kennicutt
1998)
that correlates the average S FR per unit
area and the mean surface density of the cold gas (atomic plus
molecular). But tracers of star-formation, including optical colors and
H![]() flux (e.g., Larson & Tinsley 1978; Kennicutt 1998;
Calzetti et al. 2007),
FIR flux (Kennicutt 1998;
Heckman 1999), radio-continuum flux (Condon 1992), and
far-ultraviolet (FUV) flux (Kennicutt 1998; Salim
et al. 2007),
often yield to very different values of the S FR.
Although the density of atomic gas is known in some cases, not many
direct measurements of the molecular gas are available, and are
especially rare in dwarf galaxies (i.e., Taylor et al. 1998; Barone
et al. 2000; Braine et al. 2000, 2001, 2004).
flux (e.g., Larson & Tinsley 1978; Kennicutt 1998;
Calzetti et al. 2007),
FIR flux (Kennicutt 1998;
Heckman 1999), radio-continuum flux (Condon 1992), and
far-ultraviolet (FUV) flux (Kennicutt 1998; Salim
et al. 2007),
often yield to very different values of the S FR.
Although the density of atomic gas is known in some cases, not many
direct measurements of the molecular gas are available, and are
especially rare in dwarf galaxies (i.e., Taylor et al. 1998; Barone
et al. 2000; Braine et al. 2000, 2001, 2004).
On the other hand, the physics underlying the relationship
between stellar mass (or luminosity) and metallicity is still far from
clear, despite the important observational (e.g., Tremonti
et al. 2004;
van Zee & Haynes 2006;
Kewley & Ellison 2008)
and theoretical (e.g., De Lucia et al. 2004; Tissera
et al. 2005;
De Rossi et al. 2006; Davé
& Oppenheimer 2007)
efforts that aimed to explain it. Indeed, one of the main problems is
to derive the real metallicity of the ionized gas, because empirical
calibrations based on direct estimates of the electron temperature (![]() )
of the ionized gas and theoretical methods based on photoionization
models provide very different oxygen abundances (e.g., Yin
et al. 2007;
Kewley & Ellison 2008;
Esteban et al. 2009;
López-Sánchez & Esteban 2010). Finally, the present
understanding of correlations between the H I content,
stellar populations, and star-formation in dwarf starburst galaxies is
still at a preliminary stage because of the lack of detailed optical/NIR
images and spectra and/or interferometric H I maps
of these systems.
)
of the ionized gas and theoretical methods based on photoionization
models provide very different oxygen abundances (e.g., Yin
et al. 2007;
Kewley & Ellison 2008;
Esteban et al. 2009;
López-Sánchez & Esteban 2010). Finally, the present
understanding of correlations between the H I content,
stellar populations, and star-formation in dwarf starburst galaxies is
still at a preliminary stage because of the lack of detailed optical/NIR
images and spectra and/or interferometric H I maps
of these systems.
In our series of papers, we have presented a detailed photometric and spectroscopic study of a sample of strong star-forming galaxies, many of them previously classified as dwarf galaxies. The majority of these objects are Wolf-Rayet (WR) galaxies, which are a very inhomogeneous class of star-forming objects that share an ongoing or very recent star-formation event that has produced stars massive enough to evolve to the WR stage (Schaerer et al. 1999). The WR features in the spectra of a galaxy constrains the properties of the star-formation processes. Because the first WR stars typically appear around 2-3 Myr after the starburst is initiated and disappear within some 5 Myr (Meynet & Maeder 2005), their detection informs about both the youth and strength of the burst, offering the opportunity to study an approximately coeval sample of very young starbursts (Schaerer & Vacca 1998).
Our main aim is to study the formation of massive stars in
starburst galaxies and the role that interaction with or between dwarf
galaxies and/or low surface brightness objects plays in its triggering
mechanism. In Paper I (López-Sánchez & Esteban 2008) we
introduced the motivation of this work, compiled the list of the
analyzed WR galaxies (Table 1 of Paper I),
and presented the results of optical/NIR
broad-band and H![]() photometry. In Paper II (López-Sánchez & Esteban 2009) we presented
the results of our analysis of intermediate-resolution long-slit
spectroscopy of 16 objects in our sample of WR galaxies - the
results for the other 4 objects were published separately. In
Paper II, we also specified the oxygen abundances of the
ionized gas (computed following the direct
photometry. In Paper II (López-Sánchez & Esteban 2009) we presented
the results of our analysis of intermediate-resolution long-slit
spectroscopy of 16 objects in our sample of WR galaxies - the
results for the other 4 objects were published separately. In
Paper II, we also specified the oxygen abundances of the
ionized gas (computed following the direct ![]() method in the majority of the cases) and analyzed the kinematics of the
ionized gas. In Paper III (López-Sánchez & Esteban 2010a), we
studied the O and WR stellar populations within these
galaxies, and compared them with theoretical evolutionary synthesis
models. In Paper IV (López-Sánchez & Esteban 2010b), we
analyzed the optical/NIR properties of the
galaxies overall, concluding that such detailed analyses are
fundamental in understanding the star-formation histories of the
galaxies. For this paper, the last in the series, we performed a
comprehensive multiwavelength analysis that considers all the optical
and NIR data but also includes radio, FIR, FUV,
and X-ray data available in the literature.
method in the majority of the cases) and analyzed the kinematics of the
ionized gas. In Paper III (López-Sánchez & Esteban 2010a), we
studied the O and WR stellar populations within these
galaxies, and compared them with theoretical evolutionary synthesis
models. In Paper IV (López-Sánchez & Esteban 2010b), we
analyzed the optical/NIR properties of the
galaxies overall, concluding that such detailed analyses are
fundamental in understanding the star-formation histories of the
galaxies. For this paper, the last in the series, we performed a
comprehensive multiwavelength analysis that considers all the optical
and NIR data but also includes radio, FIR, FUV,
and X-ray data available in the literature.
The selection criteria of the galaxy sample were the
following. We used the most recent catalog of WR galaxies
(Schaerer et al. 1999),
which contains a very inhomogeneous group of starbursting objects, to
make a list of dwarf objects that could be observed from the Northern
Hemisphere. As a result, we considered neither spirals galaxies nor
giant H II regions within them,
and considered only dwarf objects, such as apparently isolated BCDGs
and dwarf irregular galaxies that had peculiar morphologies in
previous, shallower imaging. We also chose two galaxies belonging to
the Schaerer et al. (1999)
catalog that were classified as suspected
WR galaxies (Mkn 1087 and Tol 9), to confirm the presence of
massive stars within them (see Papers II and III).
The galaxy IRAS 08339+6517 was also included because previous
multiwavelength results suggested that the WR stars could
still be present in its youngest star-forming bursts (see López-Sánchez
et al. 2006).
With this, we got a list of ![]() 40 systems
to observe and analyze using the telescopes available at Roque de los
Muchachos (La Palma, Spain) and Calar Alto (Almería, Spain)
observatories. We added the southern galaxy NGC 5253, for
which we obtained deep echelle spectrophotometry using 8.2 m
VLT, because of the very intriguing properties it possesses (see
López-Sánchez et al. 2007,
2010). The final sample of 20 galaxies was created by considering those
galaxies for which we obtained optical/NIR
broad-band and H
40 systems
to observe and analyze using the telescopes available at Roque de los
Muchachos (La Palma, Spain) and Calar Alto (Almería, Spain)
observatories. We added the southern galaxy NGC 5253, for
which we obtained deep echelle spectrophotometry using 8.2 m
VLT, because of the very intriguing properties it possesses (see
López-Sánchez et al. 2007,
2010). The final sample of 20 galaxies was created by considering those
galaxies for which we obtained optical/NIR
broad-band and H![]() images, plus the deep optical spectroscopy during our observation runs.
We already have all these data for other
images, plus the deep optical spectroscopy during our observation runs.
We already have all these data for other ![]() 15 galaxies, the analysis of these
systems will be presented in the future elsewhere, but its preliminary
results seem to agree with the main results reported in this paper. Our
galaxy sample is therefore not complete, but we consider that it
represents dwarf galaxies experiencing a very strong star-formation
burst quite well. Indeed, this was the main bias introduced when
choosing the galaxy sample, such as we focused only in galaxies on
which WR stars are detected. It would be very interesting to
extend this analysis to similar star-forming galaxies that do not show
WR features, such as the sample of BCDGs analyzed by
Gil de Paz et al. (2003).
15 galaxies, the analysis of these
systems will be presented in the future elsewhere, but its preliminary
results seem to agree with the main results reported in this paper. Our
galaxy sample is therefore not complete, but we consider that it
represents dwarf galaxies experiencing a very strong star-formation
burst quite well. Indeed, this was the main bias introduced when
choosing the galaxy sample, such as we focused only in galaxies on
which WR stars are detected. It would be very interesting to
extend this analysis to similar star-forming galaxies that do not show
WR features, such as the sample of BCDGs analyzed by
Gil de Paz et al. (2003).
The structure of this paper is the following. In Sect. 2 we describe the details of the radio, FIR, FUV, and X-ray data extracted from the literature and provide some very useful relations. Section 3 analyzes the star-formation activity in our sample galaxies when considering all multiwavelength calibrators to the S FR. We check that our sample galaxies follow the radio/FIR correlation in Sect. 4. Next, Sect. 5 compiles, analyses and compares all mass estimations derived in this work. Several mass-metallicity relations are investigated in Sect. 6. We study whether our galaxies satisfy the Schmidt-Kennicutt relation in Sect. 7. Section 8 analyzes and compares several mass-to-light ratios. The dust properties within our starburst galaxies are investigated in Sect. 9. We compare the predictions of the closed-box model with our observational data in Sect. 10. Finally, Sect 11 compiles a quantitative analysis of the interaction features considering all available multiwavelength data. The conclusions reached in our analysis are compiled in Sect. 12. The Appendix describes the main results found in each of the analyzed WR galaxies.
Table 1: Radio data compiled from the literature for our WR galaxy sample.
2 Multiwavelength data completeness
We made an exhaustive literature search to complete the optical/NIR observations of our WR galaxy sample with data from other wavelengths (radio, far-infrared, far-ultraviolet, and X-ray). Here we describe all these data and the useful properties we have derived from them.
2.1 Radio data
2.1.1 H I data at 21 cm
Observations in the hyperfine transition of the neutral hydrogen,
H I, with a rest frequency of
1420.405 MHz, have been key in understanding the distribution
and kinematics of the atomic gas within galaxies, including the Milky
Way. Neutral gas observations are very important because they are used
to determine both the neutral gas mass (H I gas)
and the dynamical mass (
![]() )
of the systems. Single-dish H I surveys
(e.g. Mathewson et al. 1992, the H I
Parkes Sky Survey, HIPASS, Barnes et al. 2001; Koribalski
et al. 2004;
Meyer et al. 2004;
and the Arecibo Legacy Fast ALFA survey, ALFALFA,
Giovanelli et al. 2005),
give spectra with detected H I emission
of thousands of galaxies. However, the best tool for analyzing the
neutral gas content in galaxies is via radio
interferometer observations (e.g., THINGS; LVHIS; FIGGS; The
H I Rogues Gallery). Knowing the
amount of available neutral gas, the timescale of the starbursts (i.e.,
the time when the H I cloud will be
exhausted if the star-formation activity continues at the current S FR)
can be calculated.
)
of the systems. Single-dish H I surveys
(e.g. Mathewson et al. 1992, the H I
Parkes Sky Survey, HIPASS, Barnes et al. 2001; Koribalski
et al. 2004;
Meyer et al. 2004;
and the Arecibo Legacy Fast ALFA survey, ALFALFA,
Giovanelli et al. 2005),
give spectra with detected H I emission
of thousands of galaxies. However, the best tool for analyzing the
neutral gas content in galaxies is via radio
interferometer observations (e.g., THINGS; LVHIS; FIGGS; The
H I Rogues Gallery). Knowing the
amount of available neutral gas, the timescale of the starbursts (i.e.,
the time when the H I cloud will be
exhausted if the star-formation activity continues at the current S FR)
can be calculated.
Table 1
compiles all H I 21 cm
data found for our galaxy sample. The majority of the H I data
is provided by single-dish H I
observations, but interferometric H I maps
are available for a few cases (HGC 31 and
IRAS 08339+6517). Table 1 lists the
H I flux density,
![]() (in
units of Jy km s-1), and
the H I equivalent width,
(in
units of Jy km s-1), and
the H I equivalent width,
![]() (in
km s-1). For 3 galaxies
(POX 4, Tol 9 and NGC 5253) we are using the
data provided by our new interferometric maps obtained using the Australia
Telescope Compact Array. For these objects, we compiled the
integrated H I flux and
width; their detailed analysis will soon be presented elsewhere
(López-Sánchez et al. 2010a,b).
SBS 0926+606 was recently observed by Huchtmeier
et al. (2007),
who gave a combined H I flux
for both A and B galaxies, but only interferometric studies can
disentangle the amount of neutral gas in each galaxy.
Tol 1457-262 and Arp 252 were observed in H I by
Casasola et al. (2004)
using a single-dish antenna, but they were not detected.
Arp 252 was not detected in H I in
HIPASS either (Koribalski 2006, priv. comm.).
The total H I mass is
computed by applying
(in
km s-1). For 3 galaxies
(POX 4, Tol 9 and NGC 5253) we are using the
data provided by our new interferometric maps obtained using the Australia
Telescope Compact Array. For these objects, we compiled the
integrated H I flux and
width; their detailed analysis will soon be presented elsewhere
(López-Sánchez et al. 2010a,b).
SBS 0926+606 was recently observed by Huchtmeier
et al. (2007),
who gave a combined H I flux
for both A and B galaxies, but only interferometric studies can
disentangle the amount of neutral gas in each galaxy.
Tol 1457-262 and Arp 252 were observed in H I by
Casasola et al. (2004)
using a single-dish antenna, but they were not detected.
Arp 252 was not detected in H I in
HIPASS either (Koribalski 2006, priv. comm.).
The total H I mass is
computed by applying
|
(1) |
(Roberts 1975; Roberts & Haynes 1994) where the distance to the galaxy, d, is expressed in Mpc, and the result for the neutral gas mass is given in solar units. The dynamical mass of the system,
|
(2) |
which is the result in solar masses when
2.1.2 Radio-continuum data
For an individual star-forming galaxy, the S FR
is directly proportional to its radio luminosity (i.e., Condon 1992). Hence,
the radio continuum flux is widely used as a dust-free indicator of the
star-formation rate. Nearly all of the radio-continuum luminosity from
galaxies without a significant active galactic nucleus (AGN) can be
traced to recently formed massive (![]()
![]() )
stars (Condon et al. 1992).
The 10% of the continuum emission at 1.4 GHz comes from
free-free emission from extremely massive main-sequence stars (thermal
emission) and almost 90% is synchrotron radiation from relativistic
electrons accelerated in the remnants of core-collapse supernovae
(nonthermal emission). Because the stars that contribute significantly
to the radio emission have lifetimes
)
stars (Condon et al. 1992).
The 10% of the continuum emission at 1.4 GHz comes from
free-free emission from extremely massive main-sequence stars (thermal
emission) and almost 90% is synchrotron radiation from relativistic
electrons accelerated in the remnants of core-collapse supernovae
(nonthermal emission). Because the stars that contribute significantly
to the radio emission have lifetimes
![]() yr
and the relativistic electrons have lifetimes
yr
and the relativistic electrons have lifetimes
![]() yr,
the current radio luminosity is nearly proportional to the rate of
massive star-formation during the past
yr,
the current radio luminosity is nearly proportional to the rate of
massive star-formation during the past
![]() yr
(Condon et al. 2002):
yr
(Condon et al. 2002):
where
Table 1
compiles also all the 1.4 GHz radio-continuum flux data available for
our WR galaxy sample in the literature. The 1.4 GHz
luminosity, ![]() ,
can be computed using the expression given by Yun et al. (2001):
,
can be computed using the expression given by Yun et al. (2001):
where the result is given in units of W Hz-1, the distance d is expressed in Mpc and
Radio-continuum observations at several cm wavelengths are used to
quantify the thermal and nonthermal contributions, and thereby
distinguish older and supernova-rich regions from younger and mostly
thermal areas (i.e., Deeg et al. 1993; Beck et al.
2000; Cannon et al. 2004,
2005). These observations also permit detecting of extremely young,
dense, heavily embedded star clusters (Kobulnicky & Johnson 1999;
Johnson & Kobulnicky 2003).
Although radio data at frequencies different from 1.4 GHz are
not usually available for this kind of galaxy, we applied the equation
provided by Dopita et al. (2002),
to obtain an estimation of the thermal emission at 1.4 GHz,
Table 2: FIR and FUV data for the WR galaxy sample analyzed in this work.
2.2 FIR data
Many of the problems found to derive the S FR
from optical data can be avoided by measuring the far-infrared (FIR)
and submillimeter spectral energy distributions (SEDs). These are
determined by the re-radiation as thermal continuum by the dust grains
of stellar photospheric radiation absorbed in the visible and UV
regions of the spectrum. Assuming that the dust completely surrounds
the star-forming regions, it acts as a bolometer reprocessing the
luminosity produced by the stars. Therefore, the S FR
can be also computed
using theoretical stellar flux distributions and evolutionary models.
Kennicutt (1998)
provides the following correlation between the S FR
(in units of ![]() yr-1)
and the far-infrared flux:
yr-1)
and the far-infrared flux:
where
with f60 and f100 the flux densities (in Jy) for 60
Assuming that all the UV and blue radiation from massive stars
is absorbed by grains and is re-emitted as thermal radiation in the
40-120 ![]() m
band, Condon (1992)
derives the following relation between S FR
and
m
band, Condon (1992)
derives the following relation between S FR
and ![]() (in units of W Hz-1):
(in units of W Hz-1):
i.e.,
| (9) |
with
Roussel et al. (2001) provide
an alternative S FR calibration using the
15 ![]() m
luminosity:
m
luminosity:
where
![\begin{figure}
\par\includegraphics[angle=0,width=18cm,clip]{14295fg01.eps}
\end{figure}](/articles/aa/full_html/2010/13/aa14295-10/img74.png)
|
Figure 1: Example of GALEX images, showing the FUV emission in HCG 31, Haro 15 and SBS 0926+606. Regions within each object have been labeled following the notation given in Paper I. |
| Open with DEXTER | |
The warm dust mass can be estimated using the 60 and 100 ![]() m fluxes and
applying the relation given by Huchtmeier et al. (1995),
m fluxes and
applying the relation given by Huchtmeier et al. (1995),
![$\displaystyle M_{\rm dust} = 4.78 d^2 f_{\rm 100~ \mu m} \Bigg(\exp\Big[2.94\Big(\frac{f_{\rm 100~ \mu m}}{f_{\rm 60~ \mu m}}\Big)^{0.4}\Big]-1
\Bigg),$](/articles/aa/full_html/2010/13/aa14295-10/img75.png)
where the distance is expressed in Mpc, the flux densities are in Jy, and the result is given in
We used the far-infrared (FIR) data provided by the Infrared
Astronomical Satellite (IRAS) to obtain the monochromatic
fluxes at 12, 25, 60, and 100 ![]() m. These data were used to independently estimate
the S FR and to derive the warm dust mass
within each galaxy. We also checked if the galaxies follow the
FIR-radio relationship. Table 2 compiles all
the FIR data found for our sample of WR galaxies, and three of
them have no useful measurements at these frequencies.
m. These data were used to independently estimate
the S FR and to derive the warm dust mass
within each galaxy. We also checked if the galaxies follow the
FIR-radio relationship. Table 2 compiles all
the FIR data found for our sample of WR galaxies, and three of
them have no useful measurements at these frequencies.
2.3 FUV data
In the past few years, the GALaxy Evolution eXplorer
(GALEX) satellite has been providing astonishing ultraviolet (UV)
images of galaxies and revealing recent star-formation activity in
their external regions (i.e., Gil de Paz 2005, 2007; Thilker
et al. 2005;
Koribalski & López-Sánchez 2009). The
GALEX point spread function in the central 0.5![]() has a full width at half-maximum of
has a full width at half-maximum of ![]() 5 arcsec, matching the spatial
resolution of our optical/NIR images quite nicely.
We searched for GALEX observations of the galaxies that compose our
sample in the far-UV-band (FUV,
1350-1750 Å), all of them have useful FUV data
except four objects (Mkn 1087, Mkn 1199,
SBS 0948+532 and III Zw 107).
5 arcsec, matching the spatial
resolution of our optical/NIR images quite nicely.
We searched for GALEX observations of the galaxies that compose our
sample in the far-UV-band (FUV,
1350-1750 Å), all of them have useful FUV data
except four objects (Mkn 1087, Mkn 1199,
SBS 0948+532 and III Zw 107).
In general, the FUV emission of our sample galaxies matches
their optical emission fairly closely. In many cases, FUV emission is
much more extended than the H![]() emission. Figure 1
shows the examples of the GALEX FUV images of HCG 31,
Haro 15, and SBS 0926+606. As we can see when
comparing with our optical images (see Paper I), the
star-forming regions are clearly observed in FUV. Brief comments about
three galaxies follow.
emission. Figure 1
shows the examples of the GALEX FUV images of HCG 31,
Haro 15, and SBS 0926+606. As we can see when
comparing with our optical images (see Paper I), the
star-forming regions are clearly observed in FUV. Brief comments about
three galaxies follow.
- The eastern tail of SBS 0926+606 B is
quite bright in the FUV image, suggesting an extended distribution of
massive OB stars that we do not detect in our deep H
 image (see Fig. 15 and Sect. 3.10.1 in
Paper I);
image (see Fig. 15 and Sect. 3.10.1 in
Paper I);
- the star-forming galaxy #15 in Tol 1457-262 is clearly detected in the FUV emission, but the faint galaxy #16 is not seen (Fig. 31 and Sect. 3.18.1 in Paper I); and
- in Arp 252, FUV emission is detected not only at the center of the galaxies (ESO 566-8 and ESO 566-7) but also throughout the tails and in tidal dwarf candidates c, e, and d (see Fig. 34 and Sect. 3.19.1 in Paper I).
where
The seven column in Table 2 indicates the region within each system for which we derived the FUV flux. The FIR emission provided by IRAS does not allow distinguishing between these regions, but FUV data provided by GALEX does. In Arp 252, region A is galaxy ESO 566-8 and region B is galaxy ESO 566-7 (see Sect. 3.19 in Paper I).
Table 3: X-ray data available for our WR galaxy sample.
2.4 X-ray data
Finally, we also looked for the X-ray data available for our
WR galaxy sample. Only four objects
(HCG 31 AC, IRAS 08339+6517, Tol 9
and NGC 5253) have been observed at these high frequencies;
their X-ray luminosities are compiled in Table 3. In the case of
Tol 9, the upper limit to the X-ray luminosity was derived
from the upper limit to the X-ray flux reported by Fabbiano
et al. (1982),
![]() erg cm-2 s-1,
and assuming a distance of 86.6 Mpc (see
Table 1, Paper I). We then multiplied the derived
X-ray luminosity by 0.72 to correct for the X-ray range.
Beside these data, we also use (see Sect. 3.3) the
WR galaxy sample that Stevens & Strickland (1998a,b)
observed in X-ray.
erg cm-2 s-1,
and assuming a distance of 86.6 Mpc (see
Table 1, Paper I). We then multiplied the derived
X-ray luminosity by 0.72 to correct for the X-ray range.
Beside these data, we also use (see Sect. 3.3) the
WR galaxy sample that Stevens & Strickland (1998a,b)
observed in X-ray.
3 Analysis of the star-formation rates
The S FR, defined as the stellar mass
formed per unit time, is the standard parameter used to quantify the
star-formation activity in galaxies. Determination of the S FR
is fundamental to a proper understanding of the formation and evolution
of the galaxies. As said in the introduction, different techniques
involving different data sets from UV to radio
often yield different S FR results. Part of
the problem is related to the unknown amount of extinction within each
particular galaxy (Calzetti 2001),
such as the amount of dust obscuration depending on the galaxy mass,
galaxy type, the chemical evolutionary state, gas content, or even if
the galaxy is interacting or merging with another independent object.
As explained in the previous section, FIR and radio data provide an
extinction-free estimation of the S FR,
while FUV emission nicely traces the very young stellar component.
Here, we analyzed all the available multiwavelength data for our sample
of WR galaxies, including our reddening-corrected H![]() estimations (see Paper I), to determine the S FR
within these objects in a comprehensive way.
estimations (see Paper I), to determine the S FR
within these objects in a comprehensive way.
Table 4:
FUV, U, B, H![]() ,
H, FIR, 15
,
H, FIR, 15 ![]() m, 60
m, 60 ![]() m,
and 1.4 GHz luminosities for all galaxies analyzed in this
work.
m,
and 1.4 GHz luminosities for all galaxies analyzed in this
work.
Table 5:
S FR values (in units of ![]() yr-1)
derived for each galaxy using different luminosities and calibrations.
yr-1)
derived for each galaxy using different luminosities and calibrations.
![\begin{figure}
\par\includegraphics[width=16.5cm,clip]{14295fg02.eps}
\end{figure}](/articles/aa/full_html/2010/13/aa14295-10/img94.png)
|
Figure 2:
Comparison between the H |
| Open with DEXTER | |
We used the values listed in Table 4 to estimate the S FR
that each object experiences, following the different multiwavelength
techniques explained in the previous section. Table 5 compiles all S FR
values derived for each galaxy. The values of the H![]() -based S FR
listed in this table were extracted from Paper I and consider
the Kennicutt (1998)
calibration. Recently, Calzetti et al. (2007)
re-calibrated the relationship between the H
-based S FR
listed in this table were extracted from Paper I and consider
the Kennicutt (1998)
calibration. Recently, Calzetti et al. (2007)
re-calibrated the relationship between the H![]() -luminosity and the S FR;
the H
-luminosity and the S FR;
the H![]() -based
values of the S FR provided by Calzetti
et al. (2007)
are 0.67 times the values derived using the Kennicutt (1998)
calibration.
-based
values of the S FR provided by Calzetti
et al. (2007)
are 0.67 times the values derived using the Kennicutt (1998)
calibration.
From Table 5,
it is evident that the agreement between values obtained with different
methods is usually good, although sometimes we find clear discrepancies
(i.e. POX 4, NGC 5253). For systems that involve two
or more galaxies (HCG 31, SBS 0926+606,
Tol 1457-262, and Arp 252), we list both the global
and individual S FRs, because the FIR and
the radio data do not have enough spatial resolution to distinguish the
emission coming from different members, but FUV and H![]() data do. We also considered HCG 31 F1 and F2 as a
single entity (HCG 31 F) because the available
H I data include both TDG
candidates.
data do. We also considered HCG 31 F1 and F2 as a
single entity (HCG 31 F) because the available
H I data include both TDG
candidates.
Figure 2
compares our H![]() -based
S FR (corrected for both extinction and [N II]
contribution as explained in Appendix C of Paper I)
with the S FR estimations derived from FIR,
15
-based
S FR (corrected for both extinction and [N II]
contribution as explained in Appendix C of Paper I)
with the S FR estimations derived from FIR,
15 ![]() m,
60
m,
60 ![]() m,
and 1.4 GHz luminosities. The diagram involving
m,
and 1.4 GHz luminosities. The diagram involving
![]() seems
to show a higher scatter at higher S FR,
but this calibration is more uncertain. As a particular case,
Arp 252 always shows a disagreement between the S FR
derived from H
seems
to show a higher scatter at higher S FR,
but this calibration is more uncertain. As a particular case,
Arp 252 always shows a disagreement between the S FR
derived from H![]() and other parameters, noticeable with the 1.4 GHz luminosity.
The main object within Arp 252 is the bright galaxy
ESO 566-8. This behavior, together with the
FIR-radio-continuum relation not being satisfied in this system (see
below), strongly suggest that ESO 566-8 has some activity
different to its starbursting nature (an AGN or a radio-galaxy),
something we already commented on when we analyzed this system (see
Sect. 3.19.2 of Paper I). The rest of the objects
agree fairly well when comparing values obtained from different
calibrations. As previous authors have
pointed out (i.e. Dopita et al. 2002; James
et al. 2005),
the correction of the H
and other parameters, noticeable with the 1.4 GHz luminosity.
The main object within Arp 252 is the bright galaxy
ESO 566-8. This behavior, together with the
FIR-radio-continuum relation not being satisfied in this system (see
below), strongly suggest that ESO 566-8 has some activity
different to its starbursting nature (an AGN or a radio-galaxy),
something we already commented on when we analyzed this system (see
Sect. 3.19.2 of Paper I). The rest of the objects
agree fairly well when comparing values obtained from different
calibrations. As previous authors have
pointed out (i.e. Dopita et al. 2002; James
et al. 2005),
the correction of the H![]() fluxes for both extinction and [N II]
emission is vital to a reliable estimation of the SFR using H
fluxes for both extinction and [N II]
emission is vital to a reliable estimation of the SFR using H![]() -images.
-images.
Although the agreement between the H![]() -based S FR
and the S FRs derived using FIR and radio
luminosities is good, we observe that the values provided using the H
-based S FR
and the S FRs derived using FIR and radio
luminosities is good, we observe that the values provided using the H![]() luminosity are slightly higher than those estimated using the other
calibrations. The difference seems to be higher at lower H
luminosity are slightly higher than those estimated using the other
calibrations. The difference seems to be higher at lower H![]() -luminosities.
A linear fit to the data (Fig. 2)
confirms this trend. The zero-points of the fits (0.59, 0.52, 0.58,
0.68 for the H
-luminosities.
A linear fit to the data (Fig. 2)
confirms this trend. The zero-points of the fits (0.59, 0.52, 0.58,
0.68 for the H![]() -FIR,
H
-FIR,
H![]() -1.4 GHz,
H
-1.4 GHz,
H![]() -60
-60 ![]() m, and H
m, and H![]() -15
-15 ![]() m relations,
respectively) indicate that, for S FR = 1
m relations,
respectively) indicate that, for S FR = 1 ![]() yr-1,
the value of the S FR provided by H
yr-1,
the value of the S FR provided by H![]() -luminosity
is
-luminosity
is ![]() 0.6 times
the S FR values estimated using the other
relations. Bell (2003)
concludes that both radio and FIR luminosities underestimate the S FR
for low-luminosity galaxies because the nonthermal emission seems to be
suppressed by a factor of 2-3 in dwarf objects. However, the difference
is not significant if we use the Calzetti et al. (2007)
calibration instead of the Kennicutt (1998)
calibration to derive the H
0.6 times
the S FR values estimated using the other
relations. Bell (2003)
concludes that both radio and FIR luminosities underestimate the S FR
for low-luminosity galaxies because the nonthermal emission seems to be
suppressed by a factor of 2-3 in dwarf objects. However, the difference
is not significant if we use the Calzetti et al. (2007)
calibration instead of the Kennicutt (1998)
calibration to derive the H![]() -based
S FR.
-based
S FR.
The comparison of the FUV-based with the H![]() -based S FR
(Fig. 3)
also shows good agreement: except for some few objects (remarkably
SBS 0926+606 B
-based S FR
(Fig. 3)
also shows good agreement: except for some few objects (remarkably
SBS 0926+606 B![]() ),
both relations provide similar values. We also observe that the
FUV-based S FRs seem to be slightly lower
than the H
),
both relations provide similar values. We also observe that the
FUV-based S FRs seem to be slightly lower
than the H![]() -based
S FRs. A linear fit to the data (shown in
Fig. 3
with a continuous green line and with a correlation coefficient of r=0.927)
indicates that the FUV-based S FR is, on
average,
-based
S FRs. A linear fit to the data (shown in
Fig. 3
with a continuous green line and with a correlation coefficient of r=0.927)
indicates that the FUV-based S FR is, on
average, ![]() 0.71
times the H
0.71
times the H![]() -based
S FR. This value is similar to the factors
found before when comparing the H
-based
S FR. This value is similar to the factors
found before when comparing the H![]() -based S FR
with the FIR- and radio-based S FRs.
Interestingly, all these numbers are coincident with the ratio between
the Kennicutt (1998)
and the Calzetti et al. (2007)
calibrations to the S FR using the H
-based S FR
with the FIR- and radio-based S FRs.
Interestingly, all these numbers are coincident with the ratio between
the Kennicutt (1998)
and the Calzetti et al. (2007)
calibrations to the S FR using the H![]() flux,
flux, ![]() (H
(H![]() )/
)/
![]() (H
(H![]() )=0.67. We therefore conclude
that the new H
)=0.67. We therefore conclude
that the new H![]() -based
calibration provided by Calzetti et al. (2007) should
be preferred over the widely-used Kennicutt (1998)
calibration when computing the S FR from H
-based
calibration provided by Calzetti et al. (2007) should
be preferred over the widely-used Kennicutt (1998)
calibration when computing the S FR from H![]() luminosities. The S FR estimated for each
object by
considering all available multiwavelength data and listed in last
column of Table 5,
was computed considering the Calzetti et al. (2007) value.
Finally, we must say that there is increasing evidence that the H
luminosities. The S FR estimated for each
object by
considering all available multiwavelength data and listed in last
column of Table 5,
was computed considering the Calzetti et al. (2007) value.
Finally, we must say that there is increasing evidence that the H![]() luminosity underestimates the S FR relative
to the FUV luminosity in dwarf galaxies with S FR
luminosity underestimates the S FR relative
to the FUV luminosity in dwarf galaxies with S FR ![]() 0.01
0.01 ![]() yr-1
(i.e., Lee et al. 2009;
Pflamm-Altenburg et al. 2009), so the
FUV-based S FR should be preferred over the
H
yr-1
(i.e., Lee et al. 2009;
Pflamm-Altenburg et al. 2009), so the
FUV-based S FR should be preferred over the
H![]() -based S FR
in those systems.
-based S FR
in those systems.
3.1 LB-SFR and LU-SFR relations for starburst galaxies
Just for comparison, we also estimated the S FR from the B-luminosity using the calibration provided by Gallagher et al. (1984). SFRB represents the star-formation activity that occurred in the past few hundred Myr, while the rest of the calibrations trace the massive stars and the nebular emission of the gas that only last for some few tens of Myr. For our galaxy sample, SFRB is always lower than the S FR derived from the other calibrations, as we should expect because of the starbursting nature of the analyzed galaxies. The value of the S FRB in Mkn 1087 using the Gallagher et al. (1984) equation is only half of what is estimated from other calibrators, noting its luminous blue compact galaxy (LCBG) nature (López-Sánchez et al. 2004b).
We used our data to establish a new relation between the S FR
and the B-luminosity, which should ony be applied
in starburst galaxies and just as a first estimation of the actual S FR.
The left panel of Fig. 4
shows the relation between LB
(in solar units) and the assumed S FR for
all our galaxies. Despite some clear discrepancies between some
galaxies that show very different S FR for
a similar B-luminosity (for example, just compare
members G and F of HCG 31), we see a good agreement, having galaxies
with higher B-luminosities higher star-formation
activity. The discrepancies are a consequence of the different
star-formation histories of the galaxies (relative contribution and age
of the underlying stellar population, metallicity, age of the most
recent star-formation event). A linear fit to our data provides the
relation
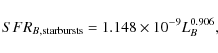
where LB is expressed in units of
![\begin{figure}
\par\includegraphics[width=8.5cm,clip]{14295fg03.eps}\protect
\end{figure}](/articles/aa/full_html/2010/13/aa14295-10/img98.png)
|
Figure 3:
Comparison between the H |
| Open with DEXTER | |
We also computed a relation between the S FR
and the U-luminosity for our sample galaxies. The
right panel of Fig. 4
shows such a relation. A linear fit to the data yields
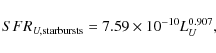
with LU expressed in units of
3.2 Comparison of SFR and metallicity
The left panel of Fig. 5
compares the assumed S FR with the oxygen
abundance computed for each galaxy. We estimated the average S FR
values in the low (12+log(O/H) < 7.8),
intermediate
(7.8 < 12+log(O/H) < 8.3),
and high (12+log(O/H) > 8.3) metallicity
regimes. As we see, the dispersion in the intermediate-metallicity
range is quite high, but that is just the consequence of the
star-formation
history of each particular galaxy (see Paper IV), because both
very dwarf objects (i.e., Mkn 5, SBS 1054+365) and
large and bright star-forming galaxies (i.e., Tol 1456-262,
III Zw 107) lie in this metallicity regime, and they
share a relatively similar chemical history. Besides the large
dispersion in the intermediate-metallicity regime, it is clear that
galaxies with higher metallicity have higher global S FRs.
That is a consequence of the building of the galaxies, because more
massive objects are more metal-rich than less massive galaxies (see
below), so that when the starburst is initiated, galaxies with higher
mass (and with higher metallicities) will create stars at a higher rate
than those found in smaller objects. The comparison of the S FR
per B-luminosity, S FR/LB
with the metallicity (Fig. 5,
right) also
shows a tremendous dispersion for 12+log(O/H) between 8.0 and 8.2.
However, we observe that S FR/LB
decreases with increasing oxygen abundance indicating that galaxies
with lower metallicity (therefore, less massive objects) have stronger
burst of star-formation than those found in higher metallicity (more
massive) objects.
SBS 0948+532 has the highest S FR/LB
in our sample, indicating the strength of the starburst, as we saw when
we analyzed its photometric properties (see Sect. 3.11 in
Paper I). On the other hand, SBS 1319+579 has low S FR/LB
than BCDGs with similar characteristics, indicating the peculiarity of
this galaxy. We see below that other properties of
SBS 1319+579 show additional discrepancies with the average
behavior in BCDGs, suggesting that the star-formation activity has been
somewhat suppressed in this object. For example, the gas depletion
timescale is extremely long for a starburst galaxy, (
![]() Gyr, see
Table 6).
Gyr, see
Table 6).
![\begin{figure}
\par\begin{tabular}{cc}
\includegraphics[angle=270,width=8cm,clip...
...ngle=270,width=8cm,clip]{14295fg04b.eps}\\
\end{tabular}\protect %
\end{figure}](/articles/aa/full_html/2010/13/aa14295-10/img101.png)
|
Figure 4: Assumed S FR vs. B-luminosity (left panel) and U-luminosity (right panel) for the analyzed galaxies. Luminosities are plotted in solar units. The best fit (in logarithm scale) to our data is plotted with a continuous red line. The previous calibration given by Gallagher et al. (1984) between the S FR and the B-luminosity is shown by a discontinuous green line. |
| Open with DEXTER | |
![\begin{figure}
\par\begin{tabular}{cc}
\includegraphics[angle=270,width=8cm,clip...
...gle=270,width=8cm,clip]{14295fg05b.eps}\\
\end{tabular}
\protect
\end{figure}](/articles/aa/full_html/2010/13/aa14295-10/img102.png)
|
Figure 5: S FR vs. 12+log(O/H) (left) and S FR/LB vs. 12+log(O/H) (right) for our sample of WR galaxies. The red-dotted line indicates a fit to our data. Green diamonds in the left panel plot the average value obtained in the low, intermediate, and high-metallicity regimes. |
| Open with DEXTER | |
3.3 An LX-SFR relation for starburst galaxies
Although several relations between the X-ray luminosity and the S FR
have been proposed (i.e., Ranalli et al. 2003; Lou
& Bian 2005)
they do not seem to be appropriate for young starbursting systems. For
example, as we explained in the analysis of the LCBG
IRAS 08339+6517 (López-Sánchez et al. 2006), the
relation provided by Ranalli et al. (2003) gives a
higher S FR value (61.8 ![]() yr-1)
than the estimations obtained using other frequencies (6-8
yr-1)
than the estimations obtained using other frequencies (6-8 ![]() yr-1).
Stevens & Strickland (1998a)
show that the X-ray luminosities in WR galaxies are
substantially higher than those found in non-WR galaxies with
similar B-luminosity. That is a consequence of the
higher rate of superbubbles and supernova explosions in
WR galaxies.
yr-1).
Stevens & Strickland (1998a)
show that the X-ray luminosities in WR galaxies are
substantially higher than those found in non-WR galaxies with
similar B-luminosity. That is a consequence of the
higher rate of superbubbles and supernova explosions in
WR galaxies.
We used the sample of WR galaxies analyzed by Stevens
& Strickland (1998a,b)
to get a tentative calibration between S FR
and ![]() for this kind of object. These authors obtained X-ray data in the
0.2-2.0 keV range using the satellite ROSAT. We checked which
of these galaxies also possess FIR data from the IRAS satellite, and
established a relation between
for this kind of object. These authors obtained X-ray data in the
0.2-2.0 keV range using the satellite ROSAT. We checked which
of these galaxies also possess FIR data from the IRAS satellite, and
established a relation between
![]() and
and ![]() ,
as shown in Fig. 6.
Only 18 galaxies have available data for both luminosities.
NGC 5253 was included in the Stevens & Strickland (1998a,b)
analysis, but they indicate that the X-ray emission in this object is
very peculiar. The X-ray emission measured in NGC 5408 may be
unrelated to the galaxy. Neglecting the contribution of these two
galaxies, the linear fit to the data thus gives
,
as shown in Fig. 6.
Only 18 galaxies have available data for both luminosities.
NGC 5253 was included in the Stevens & Strickland (1998a,b)
analysis, but they indicate that the X-ray emission in this object is
very peculiar. The X-ray emission measured in NGC 5408 may be
unrelated to the galaxy. Neglecting the contribution of these two
galaxies, the linear fit to the data thus gives
| (16) |
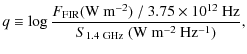
where the correlation coefficient r=0.929. Considering the calibration given by Kennicutt (1998) between
As seen in Fig. 6, our new S FR-
Table 6: Additional FIR and radio properties.
![\begin{figure}
\par\includegraphics[width=9cm,clip]{14295fg06.eps}\protect
\end{figure}](/articles/aa/full_html/2010/13/aa14295-10/img109.png)
|
Figure 6:
X-ray luminosity in the 0.2-2.0 keV range vs. FIR luminosity
for the sample of WR galaxies analyzed by Stevens &
Strickland (1998a,b).
The red continuous line is the best fit to the data, excluding the
values for NGC 5253 and NGC 5408. The green
discontinuous line is the relation obtained using the S FR- |
| Open with DEXTER | |
4 FIR/radio correlation
We used the luminosity data shown in Table 4 to check that our
WR galaxies follow the FIR/radio correlation. As shown by
Condon et al. (1992),
the FIR/radio correlation is much tighter for starbursts than for
active galaxies. Figure 7
(left) plots the 1.4 GHz luminosity vs. the 60 ![]() m luminosity
for our sample galaxies and the relation between both quantities found
by Yun et al. (2001),
m luminosity
for our sample galaxies and the relation between both quantities found
by Yun et al. (2001),
while Fig. 7 (right) shows
![$\displaystyle \log ~ L_{1.49~\rm {GHz}} [{\rm W\ Hz^{-1}}] = 1.1 \log ~ L_{\rm FIR}\ [L_{\odot}] + 10.45.$](/articles/aa/full_html/2010/13/aa14295-10/img111.png)
Bell (2003) pointed out that the radio-FIR correlation is linear not because both radio and FIR emission track S FR, but rather because they fail to track S FR in independent, but coincidentally quite similar, ways. Further analysis (i.e., Hunt et al. 2005) also found that this relation does not hold for some low-metallicity or young starbursts galaxies. However, as seen in Fig. 7, all analyzed objects except Mkn 5 (which has a very uncertain value for FIR) and Arp 252 (ESO 566-8 hosts some kind of nuclear activity) follow both relations. This indicates that the galaxies are starbursting systems and are not active galaxies (Seyfert or AGNs). We already reached this conclusion when we analyzed the diagnostic diagrams involving several emission-line ratios (see Paper III). Figure 7 includes a linear fit (in logarithmic scale) to our data (neglecting Mkn 5, for which the FIR values have high uncertainties). The relation given by Condon et al. (1991) seems to be slightly displaced with respect our observational data, although we also see some small discrepancies in the Yun et al. (2001) relation for the faintest objects.
The non-AGN nature of our sample of WR galaxies is
also supported by the analysis of the q parameter
an the FIR spectral index. The q parameter is
defined as the logarithmic ratio of FIR to radio flux density,
and it is very robust for most galaxy populations:
![\begin{figure}
\par\includegraphics[width=18cm,clip]{14295fg07.eps}\protect
\end{figure}](/articles/aa/full_html/2010/13/aa14295-10/img114.png)
|
Figure 7:
1.4 GHz radio-continuum luminosity vs. the 60 |
| Open with DEXTER | |
![\begin{figure}
\par\includegraphics[angle=270,width=9cm,clip]{14295fg08.eps}\protect
\end{figure}](/articles/aa/full_html/2010/13/aa14295-10/img115.png)
|
Figure 8:
Comparison of the B-luminosity (in solar units) and
the logarithmic nonthermal to thermal ratio, |
| Open with DEXTER | |
Table 7:
Keplerian mass (
![]() ), dynamical mass (
), dynamical mass (
![]() ), neutral gas mass (
), neutral gas mass (
![]() ), ionized gas mass (
), ionized gas mass (
![]() ), warm dust mass (
), warm dust mass (
![]() ), mass of the ionizing star
cluster (
), mass of the ionizing star
cluster (![]() ),
total stellar mass (
),
total stellar mass (
![]() ), and baryonic mass (
), and baryonic mass (
![]() )
of the galaxies analyzed in this work.
)
of the galaxies analyzed in this work.
Table 6
also compiles the nonthermal to thermal ratio R of
the galaxies with available 1.4 GHz radio-continuum data. The
thermal flux at 1.4 GHz was computed by applying Eq. (5). The majority
of the galaxies show the typical value for star-forming galaxies,
![]() Dopita
et al. (2002).
The low value in R found in POX 4 and
NGC 5253 may be because the H
Dopita
et al. (2002).
The low value in R found in POX 4 and
NGC 5253 may be because the H![]() flux has been overestimated, although the situation of
NGC 5253 is far from clear (López-Sánchez et al. 2010a). The
value obtained for SBS 1054+365 is unreliable, we consider
that it or the 1.4 GHz flux was underestimated (very probably)
or that the H
flux has been overestimated, although the situation of
NGC 5253 is far from clear (López-Sánchez et al. 2010a). The
value obtained for SBS 1054+365 is unreliable, we consider
that it or the 1.4 GHz flux was underestimated (very probably)
or that the H![]() flux was overestimated. However, the high value found in
Arp 252 (the emission comes mainly from ESO 566-8),
flux was overestimated. However, the high value found in
Arp 252 (the emission comes mainly from ESO 566-8),
![]() ,
is real and indicates that the thermal flux at 1.4 GHz is less
than 0.5%. As reported by several authors (i.e., Klein et al.
1984, 1991; Bell 2003),
dwarf galaxies seem to have a lower nonthermal-to-thermal emission
ratio than normal spiral galaxies. The values obtained for the R
parameter in our galaxy sample tend to be lower at lower B-luminosities,
as shown in Fig. 8.
The difference between dwarf and larger galaxies is often interpreted
as the higher efficiency of cosmic-ray confinement in more massive
galaxies (e.g., Klein et al. 1984; Price & Duric 1992;
Niklas et al. 1997;
Bell 2003).
,
is real and indicates that the thermal flux at 1.4 GHz is less
than 0.5%. As reported by several authors (i.e., Klein et al.
1984, 1991; Bell 2003),
dwarf galaxies seem to have a lower nonthermal-to-thermal emission
ratio than normal spiral galaxies. The values obtained for the R
parameter in our galaxy sample tend to be lower at lower B-luminosities,
as shown in Fig. 8.
The difference between dwarf and larger galaxies is often interpreted
as the higher efficiency of cosmic-ray confinement in more massive
galaxies (e.g., Klein et al. 1984; Price & Duric 1992;
Niklas et al. 1997;
Bell 2003).
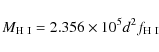
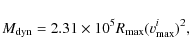
5 Analysis of the masses
![\begin{figure}
\par\includegraphics[width=16.5cm,clip]{14295fg09.eps}\protect
\end{figure}](/articles/aa/full_html/2010/13/aa14295-10/img118.png)
|
Figure 9:
Ionized gas mass (
|
| Open with DEXTER | |
![\begin{figure}
\par\includegraphics[angle=270,width=17.5cm,clip]{14295fg10.eps}\protect
\end{figure}](/articles/aa/full_html/2010/13/aa14295-10/img119.png)
|
Figure 10:
Dynamical mass (
|
| Open with DEXTER | |
For this work, we estimated the ionized gas mass
![]() ,
using the H
,
using the H![]() images presented in Paper I; neutral gas mass
images presented in Paper I; neutral gas mass
![]() ,
using H I data at 21 cm compiled
from the literature; mass of the ionizing star cluster
,
using H I data at 21 cm compiled
from the literature; mass of the ionizing star cluster ![]() ,
using H
,
using H![]() and W(H
and W(H![]() ),
see Paper I; warm dust mass
),
see Paper I; warm dust mass
![]() ,
using the FIR fluxes; Keplerian mass
,
using the FIR fluxes; Keplerian mass
![]() ,
via the kinematics of the ionized gas; and dynamical mass
,
via the kinematics of the ionized gas; and dynamical mass
![]() ,
using the H I kinematics.
All these data are compiled in Table 7. The value of
,
using the H I kinematics.
All these data are compiled in Table 7. The value of
![]() compiled
in this table is for the entire system: all galaxies in the
HCG 31 group, members A and B in SBS 0926+606, all
galaxies in Tol 1457-262, and ESO 566-8 and
ESO 566-7 in Arp 252. We neglect the contribution of
the FIR emission in dwarf objects associated to larger galaxies
(companion objects surrounding Mkn 1087, Mkn 1199,
IRAS 08339+6519, and POX 4). The estimation of
compiled
in this table is for the entire system: all galaxies in the
HCG 31 group, members A and B in SBS 0926+606, all
galaxies in Tol 1457-262, and ESO 566-8 and
ESO 566-7 in Arp 252. We neglect the contribution of
the FIR emission in dwarf objects associated to larger galaxies
(companion objects surrounding Mkn 1087, Mkn 1199,
IRAS 08339+6519, and POX 4). The estimation of
![]() and
and
![]() for each
galaxy was explained in Paper II. We just remember
that, as the extension of the neutral gas is usually larger than the
stellar component, our estimations of
for each
galaxy was explained in Paper II. We just remember
that, as the extension of the neutral gas is usually larger than the
stellar component, our estimations of
![]() are very
probably underestimated. Furthermore, nonrotational movements
would yield an overestimation of the total mass. Only interferometric
H I analysis can
definitely provide a more precise determination of the dynamical mass
for each system. However, we may use our
are very
probably underestimated. Furthermore, nonrotational movements
would yield an overestimation of the total mass. Only interferometric
H I analysis can
definitely provide a more precise determination of the dynamical mass
for each system. However, we may use our
![]() values as a
rough estimation of the total mass of the galaxies. Their
comparison with
values as a
rough estimation of the total mass of the galaxies. Their
comparison with ![]() ,
,
![]() ,
,
![]() ,
,
![]() ,
and their associated mass-to-light ratios will give clues to the galaxy
type, dynamics and the fate of the neutral gas.
,
and their associated mass-to-light ratios will give clues to the galaxy
type, dynamics and the fate of the neutral gas.
We first compared all mass determinations with the optical
luminosity of the galaxies. Figure 9 shows the
relations between ![]() ,
,
![]() ,
,
![]() ,
and
,
and ![]() with the absolute B-magnitude. As we should expect,
besides some scatter, all mass determinations clearly increase with
increasing optical luminosity. We performed a linear fit to the data,
and the results are
with the absolute B-magnitude. As we should expect,
besides some scatter, all mass determinations clearly increase with
increasing optical luminosity. We performed a linear fit to the data,
and the results are
with correlation coefficients of 0.899, 0.922, 0.912, and 0.928, respectively. Some deviations to the fits are found in Mkn 1199 (that possesses a relatively low
Figure 10
plots the dynamical mass (which represents the total mass of the
galaxy) versus the absolute magnitude in several broad-band filters (B,
V, R, and J).
We find a clear correlation between these quantities, and a linear fit
to the data yields
with correlation coefficients r of 0.922, 0.931, 0.940, and 0.907, respectively. Slopes in all fits are quite similar. The most important deviations to these fits are found in clearly interacting systems (Mkn 1199 and HCG 31 AC) but also in Mkn 5 and SBS 1054+365.
We compared the Keplerian mass (derived from the kinematics of
the ionized gas) with the dynamical mass (estimated from the kinematics
of the neutral gas). Figure 11 plots both sets
of values. As expected, ![]() is lower than
is lower than ![]() for almost all cases (
for almost all cases (
![]() =
=
![]() is shown in Fig. 11).
Although the dispersion is high - and we remember that
is shown in Fig. 11).
Although the dispersion is high - and we remember that
![]() and/or
and/or
![]() may be
overestimate because of interaction features - we performed a
tentative fit to the data, which yields
may be
overestimate because of interaction features - we performed a
tentative fit to the data, which yields
with a correlation coefficient r=0.827. This relation is included in Fig. 11. As explained in Sect. 3.13 of Paper II,
Using Eqs. (25)-(28) and 29, we computed a
tentative value for the dynamical mass in the galaxies because of lack
of H I data. We included
the results in Table 7,
and plotted these points in Fig. 11. As we can see,
they match the positions of the galaxies for which
![]() was derived
from H I data,
but we will not consider these points in the subsequent analysis.
was derived
from H I data,
but we will not consider these points in the subsequent analysis.
We prefer to use our NIR data to derive
a proper value for the stellar mass of all the galaxies. Following the
description provided by Kirby et al. (2008), we may
assume an H-band mass-to-light ratio of
![]() to
compute the stellar mass,
to
compute the stellar mass,
![]() ,
from the H-luminosity (compiled for all objects in
Table 4).
This assumption is supported by both observations (Bell 2003; Kirby
et al. 2008)
and theory (de Jong 1996),
and it considers a 12 Gyr old solar metallicity stellar
population with a constant S FR and
Salpeter initial mass function. The H-band
mass-to-light ratio may therefore be somewhat overestimated for our
young galaxies. Combining the H-band derived
stellar mass and the H I mass
(we neglect the ionized gas, molecular gas, and dust contributions),
the total baryonic mass,
,
from the H-luminosity (compiled for all objects in
Table 4).
This assumption is supported by both observations (Bell 2003; Kirby
et al. 2008)
and theory (de Jong 1996),
and it considers a 12 Gyr old solar metallicity stellar
population with a constant S FR and
Salpeter initial mass function. The H-band
mass-to-light ratio may therefore be somewhat overestimated for our
young galaxies. Combining the H-band derived
stellar mass and the H I mass
(we neglect the ionized gas, molecular gas, and dust contributions),
the total baryonic mass, ![]() ,
can be computed via
,
can be computed via
| (30) |
where the factor 1.32 corrects the H I mass for the presence of helium. The derived values for both
As we should expect, the comparison between the dynamical and
the baryonic masses (Fig. 12)
indicates that ![]() is always higher than
is always higher than ![]() ,
except for IRAS 08339+6517, which has expelled a considerable
fraction of its neutral gas to the intergalactic medium and shows
disturbed H I kinematics
(Cannon et al. 2004)
with a long tidal stream that makes it impossible to get a good
estimation of
,
except for IRAS 08339+6517, which has expelled a considerable
fraction of its neutral gas to the intergalactic medium and shows
disturbed H I kinematics
(Cannon et al. 2004)
with a long tidal stream that makes it impossible to get a good
estimation of ![]() (López-Sánchez et al. 2006).
Besides the uncertainties in
(López-Sánchez et al. 2006).
Besides the uncertainties in ![]() ,
this indicates the presence of dark matter in all systems. The dark
matter contribution would be even higher if, as we said, our values of
,
this indicates the presence of dark matter in all systems. The dark
matter contribution would be even higher if, as we said, our values of
![]() are
underestimated because of the uncertainty in the extension of the
H I disk. In all cases,
except in those galaxies for which interferometric data were available,
we used the maximum of the radius of the optical extent to compute
are
underestimated because of the uncertainty in the extension of the
H I disk. In all cases,
except in those galaxies for which interferometric data were available,
we used the maximum of the radius of the optical extent to compute
![]() .
Figure 12
indicates the position of
.
Figure 12
indicates the position of ![]() =
=
![]() if
if
![]() is computed
assuming that the extension of the neutral gas is
2.5 times the size of the optical extent. Indeed, only
interferometric H I maps
and a detailed analysis of the rotation of the neutral gas
(de Blok et al. 2008;
Westmeier et al. 2010)
can better estimate of the dynamical masses of galaxies. This issue is
even more important if interactions are disturbing the rotation pattern
of the H I gas. A clear
example of this is Tol 9 within the Klemola 13 group.
Our interferometric H I map
(López-Sánchez et al. 2008b,
2010b)
shows that the neutral gas cloud in which this BCG is embedded includes
not only Tol 9 but also some nearby dwarf galaxies. Indeed,
this H I cloud seems to
rotate as a single entity, and shows a long tidal tail in the direction
of other galaxies in the group. However, the maximum of the H I emission
is located exactly at Tol 9.
is computed
assuming that the extension of the neutral gas is
2.5 times the size of the optical extent. Indeed, only
interferometric H I maps
and a detailed analysis of the rotation of the neutral gas
(de Blok et al. 2008;
Westmeier et al. 2010)
can better estimate of the dynamical masses of galaxies. This issue is
even more important if interactions are disturbing the rotation pattern
of the H I gas. A clear
example of this is Tol 9 within the Klemola 13 group.
Our interferometric H I map
(López-Sánchez et al. 2008b,
2010b)
shows that the neutral gas cloud in which this BCG is embedded includes
not only Tol 9 but also some nearby dwarf galaxies. Indeed,
this H I cloud seems to
rotate as a single entity, and shows a long tidal tail in the direction
of other galaxies in the group. However, the maximum of the H I emission
is located exactly at Tol 9.
The important aspect to emphasize here is that, besides the
unknown amount of dark matter, strongly interacting systems, such as
HCG 31 AC or Tol 1457-262, lie outside the
observed main trend, because they have dynamical masses that are almost
14 and 7 times their baryonic masses. Mkn 1087,
Mkn 1199, and Tol 9, which are in clear interaction
with nearby objects, also have higher
![]() than
expected. Consequently, SBS 1054+365 and Mkn 5,
which clearly have dynamical masses that are more than one order of
magnitude higher than those expected for dwarf galaxies with
than
expected. Consequently, SBS 1054+365 and Mkn 5,
which clearly have dynamical masses that are more than one order of
magnitude higher than those expected for dwarf galaxies with
![]()
![]()
![]() ,
may also have highly perturbed H I kinematics.
The same situation may be happening in NGC 5253, which has a
dynamical mass that is almost an order of magnitude higher than
expected for a galaxy with
,
may also have highly perturbed H I kinematics.
The same situation may be happening in NGC 5253, which has a
dynamical mass that is almost an order of magnitude higher than
expected for a galaxy with ![]()
![]()
![]() .
.
![\begin{figure}
\par\includegraphics[angle=270,width=9cm,clip]{14295fg11.eps}\protect
\end{figure}](/articles/aa/full_html/2010/13/aa14295-10/img140.png)
|
Figure 11:
Keplerian mass (
|
| Open with DEXTER | |
![\begin{figure}
\par\includegraphics[angle=270,width=9cm,clip]{14295fg12.eps}\protect
\end{figure}](/articles/aa/full_html/2010/13/aa14295-10/img141.png)
|
Figure 12:
Comparison between the baryonic mass (
|
| Open with DEXTER | |
![\begin{figure}
\par\includegraphics[angle=270,width=9cm,clip]{14295fg13.eps}\protect
\end{figure}](/articles/aa/full_html/2010/13/aa14295-10/img143.png)
|
Figure 13:
Relation between |
| Open with DEXTER | |
6 Mass-metallicity relations
Our data set allows investigating the mass-metallicity (M-Z)
relation of star-forming galaxies. The relationship between metallicity
and stellar mass provides important clues to galaxy formation and
evolution; however, the luminosity is commonly used instead of the mass
to analyze such correlations (i.e, Paper IV and references
within). Observationally, the M-Z
relation arises because low-mass galaxies have higher gas fractions
than higher mass galaxies (i.e., Boselli et al. 2001; Kewley
& Ellison 2008).
Theoretically, the mean stellar metallicity of the galaxies increases
with age as a consequence of the chemical enrichment of the ISM, while
the stellar mass increases with time as galaxies undergo merging
processes (e.g., Somerville & Primack 1999; Calura
et al. 2004).
Once the NIR luminosities or the optical-NIR
SED are known, ![]() can be estimated relatively closely using stellar evolutionary
synthesis models, as we explained in the previous section. The main
problem with studying the M-Z relation
lies in all the uncertainties involving determining an accurate oxygen
abundance, such as different methods yielding very different results
(see Paper IV and Kewley & Ellison 2008). Here, the
oxygen abundance of the majority of the galaxies was computed using the
direct method, but Pilyugin (2001a)
calibration has been applied to computing the metallicity of some few
massive objects (Mkn 1087, Haro 15,
IRAS 08339+6517, ESO 566-7, ESO 566-8), as
we explained in Paper IV.
can be estimated relatively closely using stellar evolutionary
synthesis models, as we explained in the previous section. The main
problem with studying the M-Z relation
lies in all the uncertainties involving determining an accurate oxygen
abundance, such as different methods yielding very different results
(see Paper IV and Kewley & Ellison 2008). Here, the
oxygen abundance of the majority of the galaxies was computed using the
direct method, but Pilyugin (2001a)
calibration has been applied to computing the metallicity of some few
massive objects (Mkn 1087, Haro 15,
IRAS 08339+6517, ESO 566-7, ESO 566-8), as
we explained in Paper IV.
Figure 13 shows the relations between the stellar mass and the oxygen abundance, and Fig. 14 shows the relations between the baryonic mass (left panel) and the dynamical mass (right panel) with the oxygen abundance. From Figs. 13 and 14 it is quite evident that a M-Z relation is satisfied for our sample galaxies. Although there is still a considerable dispersion for some objects, the comparison with the luminosity-metallicity relation (see Fig. 17 and Sect. 5 of Paper IV) suggests a closer correlation when using the stellar, baryonic, or the dynamical masses than the absolute optical/NIR magnitudes.
The ![]() diagram (Fig. 13)
shows a large dispersion for galaxies with 12+log(O/H)
diagram (Fig. 13)
shows a large dispersion for galaxies with 12+log(O/H) ![]() 8,
as there are dwarf galaxies with
8,
as there are dwarf galaxies with
![]()
![]() (HCG 31 F and E, SBS 1054+365) and large
systems with
(HCG 31 F and E, SBS 1054+365) and large
systems with ![]()
![]() (UM 420, Tol 1457-262 Obj 1) within this
metallicity range. The origin of this dispersion is that the low-mass
systems are TDG candidates, which have higher oxygen abundance than
expected for their mass (not the case of SBS 1054+365), while
the high-mass objects are very probably a merger of two independent
galaxies (so their oxygen abundance is much lower than expected for a
single, more massive galaxy). Neglecting the TDG candidates and the
galaxies in the processing of merging, a linear fit to the data yields
(UM 420, Tol 1457-262 Obj 1) within this
metallicity range. The origin of this dispersion is that the low-mass
systems are TDG candidates, which have higher oxygen abundance than
expected for their mass (not the case of SBS 1054+365), while
the high-mass objects are very probably a merger of two independent
galaxies (so their oxygen abundance is much lower than expected for a
single, more massive galaxy). Neglecting the TDG candidates and the
galaxies in the processing of merging, a linear fit to the data yields
where x = 12+log(O/H). This relation has a correlation coefficient of r=0.849 (Fig. 13). Our
![\begin{figure}
\par\begin{tabular}{cc}
\includegraphics[angle=270,width=9cm,clip...
...raphics[angle=270,width=9cm,clip]{14295fg14b.eps}\\
\end{tabular}
\end{figure}](/articles/aa/full_html/2010/13/aa14295-10/img148.png)
|
Figure 14:
Relation between |
| Open with DEXTER | |
Interestingly, Kewley & Ellison (2008) did not
derive any ![]() relation using oxygen abundances determined with the
relation using oxygen abundances determined with the ![]() method, since the SDSS catalog contains very few metal-poor and
starbursting galaxies, and the scatter of the available data is huge.
These authors finally conclude that the choice of the metallicity
calibration has the strongest effect on the M-Z
relation, because a considerable variation in shapes and y-intercepts
is found. Many of their fits suggest a flatter M-Z
relation at higher masses, something that was previously noticed by
Tremonti et al. (2004).
These authors explain this issue as a consequence of effective galactic
winds that remove metals from the low-mass galaxies (
method, since the SDSS catalog contains very few metal-poor and
starbursting galaxies, and the scatter of the available data is huge.
These authors finally conclude that the choice of the metallicity
calibration has the strongest effect on the M-Z
relation, because a considerable variation in shapes and y-intercepts
is found. Many of their fits suggest a flatter M-Z
relation at higher masses, something that was previously noticed by
Tremonti et al. (2004).
These authors explain this issue as a consequence of effective galactic
winds that remove metals from the low-mass galaxies (
![]()
![]() ). Although
our data do not allow exploration of this issue at high masses, we do
not see any trend from this effect.
). Although
our data do not allow exploration of this issue at high masses, we do
not see any trend from this effect.
It is very interesting that Tol 9, in which we detect
a clear example of galactic wind, has a relatively low stellar mass for
its expected metallicity. Probably that indicates the strength and
youth of the star-formation phenomena in this BCG. We should expect
that the position of this object in the
![]() -O/H
diagram
will move to higher masses and lower metallicities if the
star-formation processes continue and if the fresh new material is
expelled far from the galaxy via the effect of galactic winds.
-O/H
diagram
will move to higher masses and lower metallicities if the
star-formation processes continue and if the fresh new material is
expelled far from the galaxy via the effect of galactic winds.
The linear fits to the
![]() and
and
![]() -Z
relations, which do not consider TDG candidates and mergers in
progress, are
-Z
relations, which do not consider TDG candidates and mergers in
progress, are
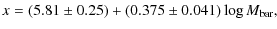
|
(32) | ||
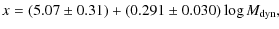
|
(33) |
where x=12+log(O/H). The correlation coefficients are r=0.821 and r=0.929 for the
In summary, the scatter observed in the luminosity-metallicity and in the mass-metallicity relationships of star-forming galaxies are a consequence of both the nature and the star-formation histories experienced by these objects. Only a detailed analysis of each system can give the clues needed to understand the evolution of the global properties in star-forming galaxies and their comparison between dwarf, normal, and massive galaxies.
Table 8: Mass-to-light ratios of all mass estimations compiled in Table 7.
7 Schmidt-Kennicutt relation
We now investigate whether the studied galaxies obey the Schmidt-Kennicutt scaling laws of star-formation. It is well known that a tight correlation exists between the average S FR per unit area and the mean surface density of the cold gas on galactic scales. Such a correlation is usually parameterized via a power-law relation (Schmidt 1959, 1963; Kennicutt 1998; Kennicutt et al. 2007) that has proven to be very useful as an input scaling law for analytical and numerical models of galaxy evolution (e.g., Kay et al. 2002).
![\begin{figure}
\par\includegraphics[angle=270,width=9cm,clip]{14295fg15.eps}\protect
\vspace*{2mm}
\end{figure}](/articles/aa/full_html/2010/13/aa14295-10/img169.png)
|
Figure 15:
Relation between the S FR/area and the
H I gas density for our
galaxy sample. We show two values per galaxy, one assuming the H |
| Open with DEXTER | |
Figure 15
shows, on a logarithm scale, the S FR per
unit area versus the surface density of the H I gas
(
![]() /area) for all the galaxies
for which we have H I measurements.
We plot two values for each galaxy, one assuming the H
/area) for all the galaxies
for which we have H I measurements.
We plot two values for each galaxy, one assuming the H![]() -based S FR
using Kennicutt (1998)
calibration and other considering the S FR
assumed combining all multiwavelength data (last column in
Table 5).
Almost both values are quite similar in all galaxies except in some
objects, especially POX 4 and NGC 5253. The majority
of the galaxies are located close to the relation given by Kennicutt
et al. (2007),
which is the best fit to the data of star-forming regions within the
nearby Sbc galaxy M 51. These authors also include the
molecular gas to get this relation, but we have not considered it in
our galaxy sample. The assumption that neglecting the molecular gas is
valid in low-mass, low-metallicity galaxies, because of both the
difficulty of detecting CO and the uncertainties of the correspondence
between CO and H2 in low-metallicity objects
(i.e., Wilson 1995;
Taylor et al. 1998;
Braine et al. 2004).
However, we should expect some molecular gas contribution in more
massive galaxies, such as IRAS 08339+6517, Mkn 1087
and Mkn 1199.
-based S FR
using Kennicutt (1998)
calibration and other considering the S FR
assumed combining all multiwavelength data (last column in
Table 5).
Almost both values are quite similar in all galaxies except in some
objects, especially POX 4 and NGC 5253. The majority
of the galaxies are located close to the relation given by Kennicutt
et al. (2007),
which is the best fit to the data of star-forming regions within the
nearby Sbc galaxy M 51. These authors also include the
molecular gas to get this relation, but we have not considered it in
our galaxy sample. The assumption that neglecting the molecular gas is
valid in low-mass, low-metallicity galaxies, because of both the
difficulty of detecting CO and the uncertainties of the correspondence
between CO and H2 in low-metallicity objects
(i.e., Wilson 1995;
Taylor et al. 1998;
Braine et al. 2004).
However, we should expect some molecular gas contribution in more
massive galaxies, such as IRAS 08339+6517, Mkn 1087
and Mkn 1199.
From Fig. 15,
it is evident that our data agree much more with the relation given by
Kennicutt et al. (2007)
than with the relation obtained by Kennicutt (1998) for
star-forming galaxies (and not regions within galaxies). Interestingly,
a recent study of the star-formation activity within UV-rich regions
found in the outskirts of the galaxy pair NGC 1512/1510
(Koribalski & López-Sánchez 2009) yield
the same result.
We plotted the H![]() -based
S FR using the Kennicutt (1998)
calibration because both Kennicutt (1998) and
Kennicutt et al. (2007)
relations use this calibration. When using the H
-based
S FR using the Kennicutt (1998)
calibration because both Kennicutt (1998) and
Kennicutt et al. (2007)
relations use this calibration. When using the H![]() -based S FR
derived from the Calzetti et al. (2007)
calibration, the agreement of our data with the Kennicutt
et al. (2007)
relation will be even closer. Some clear disagreements with the scaling
laws of star-formation are Mkn 1199 and NGC 5253
(both seem to be H I deficient;
the molecular gas component in Mkn 1199 would not explain its
position in the diagram, as it would require that
-based S FR
derived from the Calzetti et al. (2007)
calibration, the agreement of our data with the Kennicutt
et al. (2007)
relation will be even closer. Some clear disagreements with the scaling
laws of star-formation are Mkn 1199 and NGC 5253
(both seem to be H I deficient;
the molecular gas component in Mkn 1199 would not explain its
position in the diagram, as it would require that ![]() 40% of the
total neutral hydrogen mass is H2,
but the star-formation has been probably enhanced in NGC 5253)
and III Zw 107 and SBS 1319+579 (that show
lower S FR than predicted by their
H I gas amount). We then
conclude that some external factors are indeed affecting the normal
star-formation activity in these three galaxies.
40% of the
total neutral hydrogen mass is H2,
but the star-formation has been probably enhanced in NGC 5253)
and III Zw 107 and SBS 1319+579 (that show
lower S FR than predicted by their
H I gas amount). We then
conclude that some external factors are indeed affecting the normal
star-formation activity in these three galaxies.
8 Analysis of the mass-to-light ratios
![\begin{figure}
\par\includegraphics[width=16.5cm,clip]{14295fg16.eps}\protect
\end{figure}](/articles/aa/full_html/2010/13/aa14295-10/img170.png)
|
Figure 16: Comparison between the stellar mass and some mass-to-light ratios for our sample galaxies. |
| Open with DEXTER | |
Table 8 compiles all the mass-to-B luminosity ratios derived in this work. Some interesting relations are plotted in Figure 16, which compares some mass-to-light ratios with the stellar mass derived from the H-band luminosity.
The H I mass-to-light
ratio of a galaxy is a distance-independent quantity that compares the
H I mass with the
luminosity in the B-band. This property correlates
with many galaxy parameters, such as the galaxy type, galaxy color, or
galaxy mass (Roberts & Haynes 1994). Indeed, the comparison of
the ![]() ratio with the stellar mass in our sample galaxy clearly indicates that
less massive galaxies have a higher mass fraction of neutral gas. The
majority of the galaxies have a H I-mass-to-light
ratio between 0.1 and 1.0, in agreement with previous estimations in
star-forming dwarf galaxies (Salzer et al. 2002; Huchtmeier
et al. 2005).
We note some peculiar objects in this diagram. The H I-mass
of Tol 9 has been overestimated because the H I cloud
in which it is embedded includes several dwarf galaxies (López-Sánchez
et al. 2008b,
2010b). On
the other hand, two galaxies (Mkn 5 and NGC 5253) are
very H I-deficient. In particular,
NGC 5253 is very far from the typical position of the
galaxies, showing an
ratio with the stellar mass in our sample galaxy clearly indicates that
less massive galaxies have a higher mass fraction of neutral gas. The
majority of the galaxies have a H I-mass-to-light
ratio between 0.1 and 1.0, in agreement with previous estimations in
star-forming dwarf galaxies (Salzer et al. 2002; Huchtmeier
et al. 2005).
We note some peculiar objects in this diagram. The H I-mass
of Tol 9 has been overestimated because the H I cloud
in which it is embedded includes several dwarf galaxies (López-Sánchez
et al. 2008b,
2010b). On
the other hand, two galaxies (Mkn 5 and NGC 5253) are
very H I-deficient. In particular,
NGC 5253 is very far from the typical position of the
galaxies, showing an ![]() of
of ![]() 0.07
0.07
![]() .
This ratio for Mkn 1199 is also slightly low, even for a
massive galaxy. As already suggested (Sect. 3.4.3 of
Paper II), Mkn 1199 may have lost part of its neutral
gas in the interaction process with its NE companion. Neglecting the
contribution of Tol 9, Mkn 5, and NGC 5253,
a linear fit provides the empirical relation
.
This ratio for Mkn 1199 is also slightly low, even for a
massive galaxy. As already suggested (Sect. 3.4.3 of
Paper II), Mkn 1199 may have lost part of its neutral
gas in the interaction process with its NE companion. Neglecting the
contribution of Tol 9, Mkn 5, and NGC 5253,
a linear fit provides the empirical relation
| (34) |
which has a correlation coefficient of r=0.858.
We do not find any high
![]() ratio
(>1
ratio
(>1
![]() )
in our sample galaxy, except in the case of the TDG candidate
HCG 31 F, which has 1.53
)
in our sample galaxy, except in the case of the TDG candidate
HCG 31 F, which has 1.53
![]() .
High H I mass-to-light
ratios have been reported in a few galaxies. The detailed analysis of
the gas-rich low surface brightness dwarf irregular galaxy
ESO 215-G009 performed by Warren et al. (2004) confirms
an extremely high
.
High H I mass-to-light
ratios have been reported in a few galaxies. The detailed analysis of
the gas-rich low surface brightness dwarf irregular galaxy
ESO 215-G009 performed by Warren et al. (2004) confirms
an extremely high ![]() of
of ![]()
![]() in this galaxy, for which the
H I disk
extends
in this galaxy, for which the
H I disk
extends ![]() times the Holmberg radius. They conclude that ESO 215-G009,
which is very isolated (no neighbors identified out to 1 Mpc),
has a low S FR that probably remained
unchanged throughout the galaxy's existence. In a subsequent paper
(Warren et al. 2006)
these authors suggest that high
times the Holmberg radius. They conclude that ESO 215-G009,
which is very isolated (no neighbors identified out to 1 Mpc),
has a low S FR that probably remained
unchanged throughout the galaxy's existence. In a subsequent paper
(Warren et al. 2006)
these authors suggest that high
![]() galaxies
do not lack the baryons needed to create stars, but are
underluminous since they lack either the internal or external
stimulation for more extensive star-formation.
galaxies
do not lack the baryons needed to create stars, but are
underluminous since they lack either the internal or external
stimulation for more extensive star-formation.
Warren et al. (2007)
have derived an empirical upper envelope for
![]() as
a function of the absolute B-magnitude, which
accounts for the maximum amount of atomic hydrogen gas a galaxy of a
particular luminosity can retain in the Universe today. All our sample
galaxies satisfy this empirical relation.
as
a function of the absolute B-magnitude, which
accounts for the maximum amount of atomic hydrogen gas a galaxy of a
particular luminosity can retain in the Universe today. All our sample
galaxies satisfy this empirical relation.
![\begin{figure}
\par\includegraphics[width=9cm,clip]{14295fg17.eps}\protect
\end{figure}](/articles/aa/full_html/2010/13/aa14295-10/img176.png)
|
Figure 17:
Comparison of the
|
| Open with DEXTER | |
The derived ![]() ratios for our galaxy sample lie in the range
10-3-10-4
ratios for our galaxy sample lie in the range
10-3-10-4
![]() .
Although the scatter of our data is high (a tentative linear fit gives
a very low correlation coefficient), they indicate that the
.
Although the scatter of our data is high (a tentative linear fit gives
a very low correlation coefficient), they indicate that the
![]() ratio
slightly decreases with increasing stellar mass, suggesting that
the ionized gas to stars ratio is higher in dwarf galaxies.
SBS 0948+532 is far away from the rest of the objects because
of its very high H
ratio
slightly decreases with increasing stellar mass, suggesting that
the ionized gas to stars ratio is higher in dwarf galaxies.
SBS 0948+532 is far away from the rest of the objects because
of its very high H![]() flux (see Sect. 3.11 in Paper I). On the other hand,
the ionizing star cluster mass-to-light ratio,
flux (see Sect. 3.11 in Paper I). On the other hand,
the ionizing star cluster mass-to-light ratio,
![]() ,
seems to be constant with the stellar mass, showing an average value
of
,
seems to be constant with the stellar mass, showing an average value
of ![]() 0.0022
0.0022
![]() .
Two galaxies, SBS 1319+579 and the companion object of
IRAS 08339+6517 lie apart from this tendency, as we also saw
in Fig. 9.
.
Two galaxies, SBS 1319+579 and the companion object of
IRAS 08339+6517 lie apart from this tendency, as we also saw
in Fig. 9.
The ![]() ratio seems to decrease slightly with the stellar mass. However, the
analysis of this diagram is difficult, because interactions noticeably
modify the estimation of the dynamical mass. Usually, perturbed
kinematics yield to higher
ratio seems to decrease slightly with the stellar mass. However, the
analysis of this diagram is difficult, because interactions noticeably
modify the estimation of the dynamical mass. Usually, perturbed
kinematics yield to higher ![]() (HGC 31 AC, Mkn 1199, Tol 1457-262,
Tol 9), but sometimes the existence of tidal tails with a
rather constant velocity give a lower
(HGC 31 AC, Mkn 1199, Tol 1457-262,
Tol 9), but sometimes the existence of tidal tails with a
rather constant velocity give a lower
![]() than the
real one (IRAS 08339+6517). SBS 1319+579 (a
probable merging of two dwarf objects), and
IRAS 08339+6517 Comp (in interaction with the main
galaxy of the system) also shows somewhat high
than the
real one (IRAS 08339+6517). SBS 1319+579 (a
probable merging of two dwarf objects), and
IRAS 08339+6517 Comp (in interaction with the main
galaxy of the system) also shows somewhat high
![]() ratios.
We suggest that galaxies Mkn 5 and
SBS 1054+365, which lie far from the rest of the objects, have
perturbed kinematics, with
ratios.
We suggest that galaxies Mkn 5 and
SBS 1054+365, which lie far from the rest of the objects, have
perturbed kinematics, with ![]() overestimated in both cases.
overestimated in both cases.
Figure 17
compares the ratio between the gas and the stellar masses with the
oxygen abundance. Clearly,
![]() decreases
with increasing metallicity, indicating that the importance
of the stellar component to the total mass is higher in more massive
galaxies. We should expect this result, which is qualitatively the
inverse behavior of the
decreases
with increasing metallicity, indicating that the importance
of the stellar component to the total mass is higher in more massive
galaxies. We should expect this result, which is qualitatively the
inverse behavior of the ![]() ratio with the stellar mass. A tentative linear fit to the data
(excluding Tol 9) is plotted in Fig. 17) and provides
ratio with the stellar mass. A tentative linear fit to the data
(excluding Tol 9) is plotted in Fig. 17) and provides
| (35) |
where x = 12+log(O/H), and it has a correlation coefficient of r=0.655. Following this analysis, we should expect that galaxies with 12+log(O/H)
Finally, we compare some mass-to-light ratios with the colors
of the galaxies. Amorín et al. (2009) report that
the underlying component (host) of blue compact galaxies is redder with
decreasing ![]() .
We do not find any correlation between the
.
We do not find any correlation between the
![]() ratio
and the optical colors of the underlying component, but we did
not perform a detailed analysis of the structural parameters of the
host underlying the starburst as Amorín et al. (2009) did. The
comparison of the global B-R
color and the neutral gas mass-to-light ratio is shown in the left
panel of Fig. 18,
and has a huge scatter. We should call that Mkn 1199,
Mkn 5 and NGC 5253 seem to be H I deficient
and that IRAS 08339+6517 is a luminous blue compact galaxy
(López-Sánchez et al. 2006),
so their real positions in this diagram are uncertain. Although a
tentative fit to the data suggests that galaxies with redder B-V colors
have lower
ratio
and the optical colors of the underlying component, but we did
not perform a detailed analysis of the structural parameters of the
host underlying the starburst as Amorín et al. (2009) did. The
comparison of the global B-R
color and the neutral gas mass-to-light ratio is shown in the left
panel of Fig. 18,
and has a huge scatter. We should call that Mkn 1199,
Mkn 5 and NGC 5253 seem to be H I deficient
and that IRAS 08339+6517 is a luminous blue compact galaxy
(López-Sánchez et al. 2006),
so their real positions in this diagram are uncertain. Although a
tentative fit to the data suggests that galaxies with redder B-V colors
have lower ![]() ratios, the huge scatter does not allow us to confirm such tendency.
ratios, the huge scatter does not allow us to confirm such tendency.
However, we do observe a clear relation between the
stellar-to-light ratio and the global B-R
color of the galaxies (right panel of Fig. 18). This tendency
seems to also be a consequence of the building of the galaxies, since
more massive galaxies have experienced more star-formation events than
less massive objects, so they tend to show redder stellar populations
than dwarf galaxies. This result also agrees quite well with the
observed tendencies that ![]() ratio decreases with the stellar mass and that
ratio decreases with the stellar mass and that
![]() ratio
decreases with increasing metallicity.
ratio
decreases with increasing metallicity.
9 Dust properties in star-forming galaxies
Our data set allows us to investigate the properties and effects of the
dust content in low-metallicity star-forming galaxies. Figure 19 plots the
reddening coefficient, c(H![]() )
-obtained using our optical spectra- as a function of the warm dust
mass,
)
-obtained using our optical spectra- as a function of the warm dust
mass, ![]() ,
derived from FIR data-. Neglecting the data for UM 420 (
,
derived from FIR data-. Neglecting the data for UM 420 (
![]() is overestimated because of
the FIR contribution by the foreground
galaxy UGC 01809), we see a clear correlation between both
quantities: galaxies with higher amounts of warm dust (and hence,
following Fig. 9,
higher luminosity) show higher extinction. This conclusion agrees with
other results in this work, such as the correlation between c(H
is overestimated because of
the FIR contribution by the foreground
galaxy UGC 01809), we see a clear correlation between both
quantities: galaxies with higher amounts of warm dust (and hence,
following Fig. 9,
higher luminosity) show higher extinction. This conclusion agrees with
other results in this work, such as the correlation between c(H![]() )
and the oxygen abundance discussed in Paper IV. More
important, this result indicates that most of the dust is inside the
galaxy and not in the line of sight. Detailed analysis of the dust
distribution within nearby galaxies (i.e. Muñoz-Mateos et al. 2009) have found
clear relationships between the dust content and general properties of
nearby spiral galaxies, such as galaxy type, luminosity, and
metallicity. As the extinction was derived from our optical spectra
(see Paper II), we here independently confirm that the dust
content and therefore the extinction in dwarf galaxies depend on their
metallicities and luminosities, and very probably also on their
star-formation histories. A proper estimation of the amount of dust
within such objects is needed to perform appropriate statistical
analysis involving larger galaxy samples.
)
and the oxygen abundance discussed in Paper IV. More
important, this result indicates that most of the dust is inside the
galaxy and not in the line of sight. Detailed analysis of the dust
distribution within nearby galaxies (i.e. Muñoz-Mateos et al. 2009) have found
clear relationships between the dust content and general properties of
nearby spiral galaxies, such as galaxy type, luminosity, and
metallicity. As the extinction was derived from our optical spectra
(see Paper II), we here independently confirm that the dust
content and therefore the extinction in dwarf galaxies depend on their
metallicities and luminosities, and very probably also on their
star-formation histories. A proper estimation of the amount of dust
within such objects is needed to perform appropriate statistical
analysis involving larger galaxy samples.
![\begin{figure}
\par\includegraphics[width=16.5cm,clip]{14295fg18.eps}\protect
\end{figure}](/articles/aa/full_html/2010/13/aa14295-10/img181.png)
|
Figure 18:
Relation between the |
| Open with DEXTER | |
We now investigate the dust-to-gas ratio,
![]() ,
of our sample galaxies, a very important quantity when studying the
chemical enrichment of the ISM, as it accounts for the amount of metals
locked up into dust grains through the stellar yields. The correlation
between the
,
of our sample galaxies, a very important quantity when studying the
chemical enrichment of the ISM, as it accounts for the amount of metals
locked up into dust grains through the stellar yields. The correlation
between the ![]() and the oxygen abundance has been reported in many studies (i.e.,
Lisenfeld & Ferrara 1998;
James et al. 2002;
Draine et al. 2007;
Muñoz-Mateos et al. 2009).
Figure 20
shows the dust-to-gas ratio as a function of the oxygen abundance. The
gas mass was computed assuming only the H I and
the He I gas, but not
the contribution of the molecular gas, which is not important in dwarf
low-metallicity objects.
The derived dust-to-gas ratio of each galaxy for which we have both
H I and FIR data are
compiled in the last column of Table 8. From
Fig. 20,
it is evident that objects with higher metallicities tend to have
higher
and the oxygen abundance has been reported in many studies (i.e.,
Lisenfeld & Ferrara 1998;
James et al. 2002;
Draine et al. 2007;
Muñoz-Mateos et al. 2009).
Figure 20
shows the dust-to-gas ratio as a function of the oxygen abundance. The
gas mass was computed assuming only the H I and
the He I gas, but not
the contribution of the molecular gas, which is not important in dwarf
low-metallicity objects.
The derived dust-to-gas ratio of each galaxy for which we have both
H I and FIR data are
compiled in the last column of Table 8. From
Fig. 20,
it is evident that objects with higher metallicities tend to have
higher ![]() ratios, such as the amount of dust increases and the neutral gas is
consumed while galaxies are experiencing new star-formation phenomena.
The linear fit to our data provides this tentative relation
ratios, such as the amount of dust increases and the neutral gas is
consumed while galaxies are experiencing new star-formation phenomena.
The linear fit to our data provides this tentative relation
| (36) |
with x = 12+log(O/H) and correlation coefficient of r=0.637. Mkn 5 lies away from the the majority of the points, but this object seems to be very deficient in H I, so we did not include this point in the fit. Although with higher uncertainties, we observe that more massive objects also tend to have higher
Draine et al. (2007)
provide a relation between
![]() and
the oxygen abundance - computed following the Pilyugin &
Thuan (2005)
calibration - in a sample of spiral and irregular galaxies, which we
may rewrite as
and
the oxygen abundance - computed following the Pilyugin &
Thuan (2005)
calibration - in a sample of spiral and irregular galaxies, which we
may rewrite as
| (37) |
where x = 12+log(O/H) (Fig. 20). The factor 6.48 was derived from
![\begin{figure}
\par\includegraphics[angle=270,width=9cm,clip]{14295fg19.eps}\protect
\end{figure}](/articles/aa/full_html/2010/13/aa14295-10/img187.png)
|
Figure 19:
Reddening coefficient, c(H |
| Open with DEXTER | |
![\begin{figure}
\par\includegraphics[width=9cm,clip]{14295fg20.eps}\protect
\end{figure}](/articles/aa/full_html/2010/13/aa14295-10/img188.png)
|
Figure 20:
Dust-to-gas ratio,
|
| Open with DEXTER | |
Recently, Muñoz-Mateos et al. (2009) have
analyzed the radial dust-to-gas profiles for a larger sample of spiral
galaxies
and find a steeper relation between
![]() and
the metallicity, which they explain because the outskirts of spiral
galaxies seem to have a much lower
and
the metallicity, which they explain because the outskirts of spiral
galaxies seem to have a much lower
![]() than
the central regions (see their Fig. 16).
These authors suggest a link with the behavior found in dwarf galaxies,
because in the external regions of the spiral galaxies the neutral gas
has not yet undergone star-formation. However, this trend could also be
a consequence of the radial decrease in the star-formation efficiency
found in nearby spirals (i.e., Thilker et al. 2007; Leroy
et al. 2008).
than
the central regions (see their Fig. 16).
These authors suggest a link with the behavior found in dwarf galaxies,
because in the external regions of the spiral galaxies the neutral gas
has not yet undergone star-formation. However, this trend could also be
a consequence of the radial decrease in the star-formation efficiency
found in nearby spirals (i.e., Thilker et al. 2007; Leroy
et al. 2008).
![\begin{figure}
\par\begin{tabular}{cc}
\includegraphics[angle=270,width=8cm,clip...
...angle=270,width=8cm,clip]{14295fg21b.eps}\\
\end{tabular}\protect
\end{figure}](/articles/aa/full_html/2010/13/aa14295-10/img189.png)
|
Figure 21:
(Left panel) Comparison of the observed oxygen
abundance and the one predicted by simple closed-box chemical evolution
models with instantaneous recycling and constant S FRs.
The continuous green line indicates the expected trend if the galaxies
are closed boxes with an oxygen yield
|
| Open with DEXTER | |
We may check these hypotheses by comparing our data with the relation
provided by Muñoz-Mateos et al. (2009). However,
we should slightly modify their equation, because these authors used
the Kobulnicky & Kewley (2004) method
to derive the metallicities, and this calibration overestimates the
oxygen abundances provided by the direct ![]() method in 0.2-0.4 dex (see Paper IV). The modified
relation that is plotted with a dashed yellow line in Fig. 20 is
method in 0.2-0.4 dex (see Paper IV). The modified
relation that is plotted with a dashed yellow line in Fig. 20 is
| (38) |
where x = 12+log(O/H). We see that, except for Mkn 5, all our data have lower
10 Comparison with the closed-box model
To study the environment effects of the gas content and the chemical
enrichment in galaxies, it is common to compare them with the so-called
closed-box chemical evolution model (Schmidt 1963; Searle
& Sargent 1972;
Edmunds 1990).
According to this model, a galaxy initially consists of gas with no
stars and no metals. The stellar IMF is assumed to be constant in time.
Stars that end their lives as supernovae are assumed to enrich the ISM
with metals immediately. Throughout its life, the galaxy experiences
instantaneous recycling, and the products of stellar nucleosynthesis
are neither diluted by infalling pristine gas nor lost via outflow of
enriched gas. As results, the metallicity at any given time is only
determined by the fraction of baryons that remain in gaseous form.
The model can be written as
where
The left panel of Fig. 21 compares the
observed oxygen abundances to those predicted by closed-box models,
which are plotted with lines with different ![]() .
The green continuous line indicates the model with
.
The green continuous line indicates the model with
![]() ,
which is the theoretical yield of oxygen expected for stars with
rotation following Meynet & Maeder (2002) models
(van Zee & Haynes 2006).
As we can see, the majority of the galaxies show oxygen abundances
lower than the expected by the closed-box models. The yield of oxygen
that best fits our data (the effective yield) is
,
which is the theoretical yield of oxygen expected for stars with
rotation following Meynet & Maeder (2002) models
(van Zee & Haynes 2006).
As we can see, the majority of the galaxies show oxygen abundances
lower than the expected by the closed-box models. The yield of oxygen
that best fits our data (the effective yield) is
![]() ,
in agreement with previous results found in the literature (i.e., Lee
et al. 2003;
van Zee & Haynes 2006;
Lee et al. 2007).
The sample galaxies are generally not well reproduced by the simple
closed box model, and therefore inflow of pristine gas or outflow of
enriched gas have played an important role in their chemical evolution.
,
in agreement with previous results found in the literature (i.e., Lee
et al. 2003;
van Zee & Haynes 2006;
Lee et al. 2007).
The sample galaxies are generally not well reproduced by the simple
closed box model, and therefore inflow of pristine gas or outflow of
enriched gas have played an important role in their chemical evolution.
Interestingly, there is a galaxy that hardly follows the predictions given by the theoretical closed box model, but take the opposite direction from the rest of the galaxies. Indeed, HCG 31 F shows a much higher oxygen abundance than expected following the closed box model. The explanation of this behavior is that this object is a TDG that was very probably formed from the material stripped from HCG 31 AC during the fly-by encounter between member G and the A+C complex (López-Sánchez et al. 2004a). The TDG has acreted a large fraction of the pre-enriched H I gas available in the arm-like structure and now hosts very intense star-formation.
Finally, the comparison of the effective yield derived in each
object with some global galaxy parameters (dynamical and baryonic mass,
absolute magnitude, gas mass-to-luminosity ratio, and surface S FR)
does not show any clear trend. This result is almost the same as
observed by van Zee & Haynes (2006) in the
analysis of a sample of isolated, dwarf, irregular galaxies. The
difference is that these authors reported a strong correlation with the
gas mass-to-luminosity ratio, which they explain as gas-rich galaxies
that are more likely to be closed boxes. But, as we see in the right
panel of Fig. 21,
such a tight correlation is not satisfied by our data, although we do
observe the trend that galaxies with higher
![]() /LB
ratios have lower effective yields. Therefore, for intense star-forming
and gas-rich galaxies, the closed box model is also not valid. We then
conclude that environment effects are playing a crucial role in the
evolution of these galaxies.
/LB
ratios have lower effective yields. Therefore, for intense star-forming
and gas-rich galaxies, the closed box model is also not valid. We then
conclude that environment effects are playing a crucial role in the
evolution of these galaxies.
11 Quantification of the interaction features
Table 9: Interaction features in our WR galaxy sample.
Throughout this paper series we have compiled new evidence of the interaction-induced star-formation activity in starburst galaxies, in particular in dwarf galaxies. Alternative mechanisms, such as the stochastic self-propagating star-formation (Gerola et al. 1980) model (which assumes statistical fluctuations of S FR) or the ideas of the cyclic gas reprocessing of the ISM (Davé & Oppenheimer 1988) or gas compression by shocks due to the mass lost by galactic winds followed by the cooling of the ISM (Thuan 1991; Hirashita 2000), fail to explain some observational characteristics and the triggering mechanism of dwarf starburst galaxies (i.e., García-Lorenzo et al. 2008; Cairós et al. 2009). In the previous section, we demonstrated that the closed-box model is not valid for explaining the chemical evolution experienced by our sample of galaxies, emphasizing the idea that environment effects are needed to understand their observed properties. Indeed, the interaction/merger scenario naturally explains the starburst activity in these objects as just a consequence of the evolution of the galaxies throughout the cosmic time following hierarchical formation models (Kauffmann & White 1993; Kaufmann et al. 1997; Springel et al. 2005). These models predict that most galaxies have formed by merging small clouds of protogalactic gas and that galaxy interactions between dwarf objects are very common at high redshifts.
However, the interaction features in dwarf objects are, in many cases, not evident because of the lack of deep and high-resolution images and spectra (Méndez & Esteban 2000) and detailed multiwavelength analyses. It is well known that interactions in dwarf galaxies are usual not with nearby giant galaxies (Campos-Aguilar et al. 1993; Telles & Terlevich 1995; Telles & Maddox 2000) but with low surface brightness galaxies (Wilcots et al. 1996; Noeske et al. 2001; Pustilnik et al. 2001), or H I clouds (e.g., Taylor et al. 1993, 1995, 1996; Thuan et al. 1999; van Zee et al. 2001; Begum et al. 2006; Ekta et al. 2006; Hutchmeier et al. 2008; López-Sánchez & Esteban 2008). Méndez & Esteban (2000) suggested, for the first time, that interactions with or between dwarf objects could be the main star formation triggering mechanism in dwarf galaxies. Later, Östlin et al. (2001) and Bergvall & Östlin (2002) suggested that a merger between two galaxies with different metallicities or infall of intergalactic clouds could very probably explain the starburst activity in the most luminous BCDGs. Since then, studies of individual objects have also shown that interactions do play a decisive role in the evolution of these systems (Johnson et al. 2004; Bravo-Alfaro et al. 2004; 2006; Cumming et al. 2008; García-Lorenzo et al. 2008; James et al. 2009, 2010).
Our exhaustive multiwavelength analysis of starburst galaxies,
that combined broad-band optical/NIR and H![]() photometry, optical spectroscopy, and X-ray, UV, FIR, 21-cm H I line,
and 1.4 GHz radio-continuum data compiled from the literature
allowed us to perform a quantitative analysis of the interaction
features detected in each object. A summary of the results found in
each individual system of our WR galaxy sample is presented in
Appendix A.
To quantify the interaction features, we compile in Table 9 some
interaction indicators classified in several categories, which we
describe below.
photometry, optical spectroscopy, and X-ray, UV, FIR, 21-cm H I line,
and 1.4 GHz radio-continuum data compiled from the literature
allowed us to perform a quantitative analysis of the interaction
features detected in each object. A summary of the results found in
each individual system of our WR galaxy sample is presented in
Appendix A.
To quantify the interaction features, we compile in Table 9 some
interaction indicators classified in several categories, which we
describe below.
- 1.
- Morphological features, such as the detection of faint plumes or bridges (Haro 15, IRAS 08339+6517, SBS 0926+606 B, SBS 1211+540, III Zw 107, Tol 9, Tol 1457-262, Arp 252), prominent tails (HCG 31, Mkn 1087, IRAS 08208+2816, UM 420, SBS 0948+532, Arp 252), disturbed morphology (HCG 31, POX 4, Tol 1457-262), TDGs candidates (HCG 31, Mkn 1087, SBS 0926+606 B, Arp 252) or mergers.
- 2.
- Kinematical features detected in the analysis of the ionized gas (see Paper II) and the neutral gas (only in those systems for which interferometer H I maps are available). The kinematical evidence found in the ionized gas of our sample galaxy includes: presence of objects with velocities decoupled from the main rotation pattern (Mkn 1087, Haro 15), sinusoidal velocity patterns that suggest a merging process (HCG 31 AC, Mkn 1199, IRAS 08208+2816, SBS 0926+606 A, III Zw 107, Object 1 in Tol 1457-262), reversals in the velocity distribution (Tol 9, Arp 252), indications of tidal streaming (HCG 31, IRAS 08208+2816, SBS 1319+579, Tol 9), or the presence of TDG candidates (HCG 31 F1 and F2, Mkn 1087, IRAS 08339+6517, POX 4, Tol 1457-262).
- 3.
- Chemical abundance differences within several star-forming regions within the same system: Mkn 1087, Haro 15, and Mkn 1199 are clearly interacting with dwarf galaxies with lower O/H and N/O ratios. NGC 5253, IRAS 08208+2816, and Tol 1457-262 contain zones of different chemical composition. In the case of NGC 5253, this is produced by localized pollution of massive stars, but in the cases of IRAS 08208+2816 and Tol 1457-262 the different chemical compositions seem to be caused by the regions corresponding to different galaxies in interaction.
- 4.
- Furthermore, our multiwavelength analysis has provided us
further indications of galaxies that do not follow their expected
behavior. The analysis of the mass-to-light ratios indicates very low
 in
SBS 1319+579 and NGC 5253, high
in
SBS 1319+579 and NGC 5253, high
 in
SBS 0948+532, low
in
SBS 0948+532, low
 in
SBS 1319+579, and high
in
SBS 1319+579, and high
 in
HCG 31 AC, Mkn 1199, Mkn 5,
SBS 1054+365, Tol 9, and Tol 1457-262. Other
evidence includes low H I mass
content from single-dish data (Mkn 1199, Mkn 5), very
extended H I emission
embedding several nearby galaxies as HCG 31 (VM03) and
Tol 9 (LS08, LS+10b), high
in
HCG 31 AC, Mkn 1199, Mkn 5,
SBS 1054+365, Tol 9, and Tol 1457-262. Other
evidence includes low H I mass
content from single-dish data (Mkn 1199, Mkn 5), very
extended H I emission
embedding several nearby galaxies as HCG 31 (VM03) and
Tol 9 (LS08, LS+10b), high
 (Mkn 5,
IRAS 08339+65 Comp,
SBS 1211+540, SBS 1319+579), or strong deviations
from the star-formation law (Mkn 1199, SBS 1319+579
and NGC 5253). These features may have been produced by
interactions (loss of H I mass,
enhancing of the star-formation activity, perturbed dynamics), but they
are just indirect evidence that should be confirmed by new deep
observations (i.e., H I maps).
(Mkn 5,
IRAS 08339+65 Comp,
SBS 1211+540, SBS 1319+579), or strong deviations
from the star-formation law (Mkn 1199, SBS 1319+579
and NGC 5253). These features may have been produced by
interactions (loss of H I mass,
enhancing of the star-formation activity, perturbed dynamics), but they
are just indirect evidence that should be confirmed by new deep
observations (i.e., H I maps).
Evident mergers between independent objects with relatively similar masses (major mergers) have been detected in HCG 31 AC, SBS 0926+606 A, IRAS 08208+2816 and Tol 1457+262. The galaxy pair Arp 252, which is composed of ESO 566-7 and ESO 566-8, also seems to be experiencing the first stages of a major merger. Minor mergers are found in Haro 15 and Mkn 1199. UM 420 seems also to be experiencing a merger, as deep 2D optical spectroscopy (James et al. 2009) suggests. All these galaxies have a very high degree of interaction.
Mkn 1087, IRAS 08339+6517, POX 4, SBS 0926+606 B, III Zw 107, and Tol 9 are clearly interacting with nearby dwarf objects. In the case of POX 4, we still have to investigate (López-Sánchez et al. 2010b) whether its dwarf companion galaxy is a TDG candidate and the interaction was with a nearby diffuse H I cloud, or if this object actually is an independent dwarf galaxy that has crossed the main body of POX 4 (Méndez & Esteban 1997). These six galaxies have a high degree of interaction.
On the other hand, we find probable evidence of interaction in
SBS 0948+532 (enhanced star-formation activity, long optical
tail, probable disturbed kinematics of the ionized gas),
SBS 1211+540 (diffuse optical plumes, minor merger
indications), SBS 1319+579 (peculiar
![]() ,
,
![]() ,
and
,
and ![]() ratios, perturbed kinematics suggesting merging or tidal stream
phenomena). The H I data
of NGC 5253 shows disturbed morphology and kinematics
(López-Sánchez et al. 2008a),
suggesting that this BCDG has disrupted or recently accreted a dwarf
gas-rich companion (Kobulnicky & Skillman 2008;
López-Sánchez et al. 2010a).
ratios, perturbed kinematics suggesting merging or tidal stream
phenomena). The H I data
of NGC 5253 shows disturbed morphology and kinematics
(López-Sánchez et al. 2008a),
suggesting that this BCDG has disrupted or recently accreted a dwarf
gas-rich companion (Kobulnicky & Skillman 2008;
López-Sánchez et al. 2010a).
Only Mkn 5, SBS 1054+364, and
SBS 1415+437 do not show evidences of interaction in our
exhaustive multiwavelength study. However, Mkn 5 seems to be
H I-deficient and seems to possess
a perturbed neutral gas kinematics because of its relatively high
![]() ratio.
SBS 1054+364 also shows a high
ratio.
SBS 1054+364 also shows a high
![]() ratio
that may suggest perturbed H I kinematics.
Furthermore, the chemical abundance of this galaxy is much higher than
expected from its baryonic mass. On the other hand,
SBS 1415+437 shows a relatively low oxygen abundance for its
baryonic mass.
ratio
that may suggest perturbed H I kinematics.
Furthermore, the chemical abundance of this galaxy is much higher than
expected from its baryonic mass. On the other hand,
SBS 1415+437 shows a relatively low oxygen abundance for its
baryonic mass.
Considering all indicators, we find that 13 up to 20 systems (68% of our WR galaxy sample) are classified with a high or very high degree of interaction. Four of these objects (HCG 31, Mkn 1199, IRAS 08339+6517 and Arp 252) show well known evidence of interaction, but our analysis reinforces the evidence and improves our knowledge of these systems. Only three galaxies (Mkn 5, SBS 1054+364, and SBS 1415+437) do not show interaction features, but they show considerable divergences from some properties when comparing them with similar objects. It is thus evident that the majority of the analyzed galaxies (17 up to 20) are interacting or merging with or between dwarf objects. Our analysis therefore demonstrates the importance of the low-luminosity galaxies, H I clouds, and dwarf objects in the evolution of the galaxies. Interactions with dwarf galaxies may also initiate star-formation events in normal spiral galaxies, such that it occurs in the external arms of Mkn 1199, in Haro 15, in the surroundings of Mkn 1087, or in the impressive galaxy pair NGC 1512/1510 (Koribalski & López-Sánchez 2009). Definitively, interaction between dwarf galaxies is one of the main triggering mechanisms of the star-formation in starburst galaxies, but these dwarf objects are only detected when deep optical images and spectroscopy and complementary H I observations are obtained.
12 Conclusions
We have presented a comprehensive analysis of a sample of 20 starburst galaxies that show the presence of a substantial population of very young massive stars, most of them classified as WR galaxies. In this paper, the last of the series, we analyzed the global properties of our galaxy sample using all multiwavelength data, which include X-ray, FUV, FIR, and radio (both H I spectral line at 21 cm and 1.4 GHz radio-continuum) results. Each system was carefully analyzed considering all available data (those specifically obtained for this work and those compiled from literature) with the final aim of understanding its chemical and dynamical evolution, its stellar, dust, gas, and dark matter content, the relative importance of its stellar populations (WR, young, intermediate-age and old stars) and its star-formation properties. We produced the most complete, detailed, and exhaustive data set of this kind of galaxies, so far, involving multiwavelength data and a careful analysis of each individual object following the same procedures and equations. Our main conclusions are the following:
- 1.
- We compared the values of the S FR
derived from several indicators that consider fluxes at different
wavelengths. The results agree well within the experimental errors and
with our H-based
values obtained after correcting for reddening and [N II]
contribution. However, we consider that the new H-based calibration provided by
Calzetti et al. (2007)
should be preferred over the well-known and extensively used Kennicutt (1998)
calibration. Additionally, we checked that the FUV-based S FR
very often shows similar results to those obtained using the emission
of the ionized gas, providing a powerful tool to analyze independently
the star-formation activity in both global and local scales.
- 2.
- We checked that the S FR/LB ratio decreases with increasing metallicity. We derived empirical relationships between the U-band, B-band, and X-ray luminosities and the S FR, which can only be used in starburst galaxies and as a first estimation of the real S FR value.
- 3.
- All objects except one in our galaxy sample satisfy the FIR-radio correlation, indicating that they are pure star-forming systems. Only the galaxy ESO 566-8 lies away from the FIR-radio correlation because it seems to host some kind of nuclear activity. The nonthermal-to-thermal ratio seems to increases with increasing luminosity, suggesting that the cosmic-ray confinement is more efficient in massive galaxies than in dwarf objects.
- 4.
- We provided empirical relationships between the ionized gas
mass, neutral gas mass, dust mass, stellar mass, and dynamical mass
with the B-luminosity. Although all mass
estimations increase with increasing luminosity, we find important
deviations to the general trend in some objects, which seem to be
consequence of peculiarities in these galaxies. The comparison between
the dynamical mass (derived from the kinematics of the neutral gas)
with the Keplerian mass (obtained from the kinematics of the ionized
gas) and the stellar mass (from the H-band
luminosity) provides further clues about systems in which the dynamics
seem to be highly perturbed. We remark the importance of this study,
because it is not common to find in the literature a comprehensive and
detailed analysis of a sample of galaxies for which the total
(dynamical or stellar) mass, the reddening-corrected luminosity in
optical and NIR filters, and the
 -based
oxygen abundance, have been derived in a coherent way.
-based
oxygen abundance, have been derived in a coherent way. - 5.
- We investigated some mass-metallicity relations and
compared with previous results found in the literature. As pointed out
by Kewley & Ellison (2008),
the choice of the metallicity calibration has a strong effect in the
derived M-Z relation. The
tightness of the
 calibration indicates that that the dark matter content also increases
with metallicity. The scatter in the
calibration indicates that that the dark matter content also increases
with metallicity. The scatter in the
 and
and
 relations
are consequence of both the nature (dwarf galaxies, TDG
candidates, mergers) and the star-formation histories experienced in
each galaxy.
relations
are consequence of both the nature (dwarf galaxies, TDG
candidates, mergers) and the star-formation histories experienced in
each galaxy. - 6.
- We found that our sample galaxies agree well with the Schmidt-Kennicutt scaling law of star-formation derived by Kennicutt et al. (2007), which considers individual star-forming regions within M 51. Some important deviation are found in NGC 5253 and Mkn 1199, which are very H I-deficient, and in SBS 1319+579, where the star-formation activity seems to be supressed.
- 7.
- The study of the mass-to-light ratios reinforces some of
the results found in our analysis. We found that the
neutral-gas-mass-to-luminosity ratio clearly decreases with increasing
mass, as it seems to happen with the ionized-gas-mass-to-luminosity
ratio. The ionizing-cluster-mass-to-luminosity ratio, however, seems to
be constant with metallicity. The fact that we do not find any dwarf
galaxy high
ratio indicates that they have not experienced a lonely life. The
analysis of the
 ratio suggests that this kind of galaxies have equal amount of neutral
and stellar masses for metallicities 12+log(O/H)
ratio suggests that this kind of galaxies have equal amount of neutral
and stellar masses for metallicities 12+log(O/H)  8.2-8.3.
The stellar-mass-to-luminosity ratio clearly increases with the B-R
color.
8.2-8.3.
The stellar-mass-to-luminosity ratio clearly increases with the B-R
color.
- 8.
- We found that the reddening coefficient derived from the
Balmer decrement clearly increases the warm dust mass, indicating that
the extinction is mainly internal to the galaxy and not in the
line-of-sight. We confirmed that the dust-to-gas ratio increases with
the metallicity, and suggested that the low
 ratios
in dwarf low-metallicity galaxies is a consequence of the large
reserves of unenriched neutral gas. However, the low
ratios
observed at the outskirts of spiral galaxies seem to be a result
of the decreasing star-formation efficiency in these regions.
ratios
in dwarf low-metallicity galaxies is a consequence of the large
reserves of unenriched neutral gas. However, the low
ratios
observed at the outskirts of spiral galaxies seem to be a result
of the decreasing star-formation efficiency in these regions.
- 9.
- The comparison of our data with the closed-box model clearly indicates that environment effects have played an important role in the evolution of the analyzed galaxies. The main effective yield we derived for our data agrees quite well with results found in the literature, in particular with results found in other starburst or irregular dwarf galaxies.
Based on observations made with NOT (Nordic Optical Telescope), INT (Isaac Newton Telescope), and WHT (William Herschel Telescope) operated on the island of La Palma jointly by Denmark, Finland, Iceland, Norway, and Sweden (NOT) or the Isaac Newton Group (INT, WHT) in the Spanish Observatorio del Roque de Los Muchachos of the Instituto de Astrofísica de Canarias. Based on observations made at the Centro Astronómico Hispano Alemán (CAHA) at Calar Alto, operated by the Max-Planck Institut für Astronomie and the Instituto de Astrofísica de Andalucía (CSIC). Based on observations made with the ATCA (Australia Telescope Compact Array), which is funded by the Commonwealth of Australia for operation as a National Facility managed by CSIRO. Á.R. L-S thanks César Esteban (his formal Ph.D. supervisor) for all the help and very valuable explanations, talks, and discussions over these years. He also acknowledges Jorge García-Rojas, Sergio Simón-Díaz and José Caballero for their help and friendship during his Ph.D. studies, extending this acknowledgement to everyone at the Instituto de Astrofísica de Canarias (Spain). The author is indebted to the people at the CSIRO Astronomy and Space Science/Australia Telescope National Facility (ATNF), especially Bärbel Koribalski, for their support and friendship while translating his Ph.D. The author also thanks Bärbel Koribalski for her help analyzing HIPASS data and all the talks and discussions about radio-astronomy. The author is very grateful to A&A language editor, Joli Adams, for her kindly revision of the manuscript. Á.R. L.-S. deeply thanks the Universidad de La Laguna (Tenerife, Spain) for forcing him to translate his Ph.D. Thesis from English to Spanish; he had to translate it from Spanish to English for this publication. This was the main reason of the delay of the publication of this research, because the main results shown here were already included in the Ph.D. dissertation (in Spanish) which the author finished in 2006 (López-Sánchez 2006). This work was partially funded by the Spanish Ministerio de Ciencia y Tecnología (MCyT) under projects AYA2004-07466 and AYA2007-63030. This research made use of the NASA/IPAC Extragalactic Database (NED), which is operated by the Jet Propulsion Laboratory, California Institute of Technology, under contract with the National Aeronautics and Space Administration. The Galaxy Evolution Explorer (GALEX) is a NASA Small Explorer, launched in April 2003. We gratefully acknowledge NASA's support for construction, operation, and science analysis for the GALEX mission. The Infrared Astronomical Satellite (IRAS) mission was a collaborative effort by the United States (NASA), the Netherlands (NIVR), and the United Kingdom (SERC). This research has made extensive use of the SAO/NASA Astrophysics Data System Bibliographic Services (ADS).
Appendix A: Final summary of individual galaxies
In this Appendix we compile the main results found in our
multiwavelength analysis of each individual system within our sample of
WR galaxies. In Papers I we described the optical/NIR
broad-band and H![]() photometry and in Paper II the intermediate-resolution optical
spectroscopy analysis, of 16 up to 20 galaxies studied in this work.
The analysis of the additional 4 systems were presented in previous
papers: NGC 1741 (member AC within the HCG 31 group)
in López-Sánchez et al. (2004a),
Mkn 1087 and their surrounding galaxies in López-Sánchez
et al. (2004b),
the luminous blue compact galaxy IRAS 08339+6517 in López-Sánchez
et al. (2006),
and NGC 5253 in López-Sánchez et al. (2007).
Paper III compiled the localization of the WR-rich star
clusters within the galaxies and the analysis of their massive stellar
populations. Paper IV compiles the global analysis of colors,
and the physical properties and chemical abundances of the ionized gas.
This paper, the last in the series, completes our multiwavelength
analysis involving X-ray, UV, FIR, and radio data in both the 21-cm
H I line and the
1.4 GHz radio-continuum.
photometry and in Paper II the intermediate-resolution optical
spectroscopy analysis, of 16 up to 20 galaxies studied in this work.
The analysis of the additional 4 systems were presented in previous
papers: NGC 1741 (member AC within the HCG 31 group)
in López-Sánchez et al. (2004a),
Mkn 1087 and their surrounding galaxies in López-Sánchez
et al. (2004b),
the luminous blue compact galaxy IRAS 08339+6517 in López-Sánchez
et al. (2006),
and NGC 5253 in López-Sánchez et al. (2007).
Paper III compiled the localization of the WR-rich star
clusters within the galaxies and the analysis of their massive stellar
populations. Paper IV compiles the global analysis of colors,
and the physical properties and chemical abundances of the ionized gas.
This paper, the last in the series, completes our multiwavelength
analysis involving X-ray, UV, FIR, and radio data in both the 21-cm
H I line and the
1.4 GHz radio-continuum.
- NGC 1741 hosts a very strong
star-formation event, which is very probably a consequence of the
merging of two spiral galaxies. NGC 1741 is the main member
(AC) of the galaxy group HCG 31, and it is interacting with
other galaxies in the group, including Mkn 1090
(HCG 31 G). We detect both the blue and red
WR bumps in its brightest region, as well as the nebular He II
 4686 line.
HCG 31 AC seems to have a slightly higher N/O ratio.
Some dwarf objects (members E, F1, F2, and H) are tidal dwarf galaxy
(TDG) candidates. See López-Sánchez et al. (2004a) for
details.
4686 line.
HCG 31 AC seems to have a slightly higher N/O ratio.
Some dwarf objects (members E, F1, F2, and H) are tidal dwarf galaxy
(TDG) candidates. See López-Sánchez et al. (2004a) for
details.
- Mkn 1087 is a LCBG in interaction with the nearby galaxy KPG 103a and with a dwarf surrounding galaxy (N companion). Deep optical images show long stellar tails connecting the main body of the galaxy with diffuse objects, some of them hosting star-formation activity, and several TDG candidates. Although WR features were previously reported by other authors, we do not detect any. See López-Sánchez et al. (2004b) for details.
- Haro 15 probably is a medium-size Sc spiral in interaction with two nearby dwarf objects. Knot A shows a very high star-formation activity and WR features; its disturbed kinematics suggests that it is experiencing a minor merger with Haro 15. Knot B is an independent object because of its morphology, decoupled kinematics and chemical abundances.
- Mkn 1199 is a system composed by an
Sb-Sc spiral and a dwarf galaxy, both in clear interaction, as they may
be at the first stages of a minor merger. The interaction has triggered
the star-formation activity in some areas of the main galaxy. Both the
blue and red WR bumps are detected in the central region of
Mkn 1199, which has solar metallicity. It seems that a
substantial fraction of the H I gas
has been expelled to the intergalactic medium because of its low
ratio.
- Mkn 5 is a BCDG with a strong star-forming burst located in the external part of the galaxy. The blue WR bump is detected in this starbursting region, which also possesses an important underlying old stellar component. We do not find any evidence of interaction, but the amount of H I gas of the galaxy is very low compared with what is expected for a BCDG. Furthermore, its dynamical mass is higher than expected for an dwarf galaxy with similar properties. Both results suggest that Mkn 5 has lost its neutral gas in some moment in its past and still has disturbed H I kinematics.
- IRAS 08208+2816 is a luminous infrared galaxy (LIRG) showing two long tails with very high star-formation activity. The kinematics of the ionized gas clearly indicate merger features and two long tidal tails with TDG candidates. The chemical abundances of the brightest knots also seem to be different. We detect both the blue and red WR bumps in the central region, which possesses a high N/O ratio.
- IRAS 08339+6517 is an LIRG and an LCBG in clear interaction with a nearby dwarf galaxy. The majority of the H I gas of the system has been expelled to the intergalactic medium because of this interaction (Cannon et al. 2004). Our deep optical images reveal a faint stellar plume coincident with the H I tail and a disturbed morphology in the outskirts of the galaxy. A particular bright knot may be a TDG candidate of the remnant of a previous minor merger. We detect weak WR features in its central burst and quantified the star-formation history of the galaxy (López-Sánchez et al. 2006).
- POX 4 is a morphology-disturbed,
low-metallicity BCDG showing strong star-forming bursts throughout the
galaxy. It seems to be in interaction with a nearby dwarf object that
may have passed through the main body of the galaxy, which is the
origin of its ring-like morphology (Méndez & Esteban 1997) and
kinematics. However, this object may also be a TDG candidate originated
by the interaction with a nearby and diffuse H I cloud
(López-Sánchez et al. 2010b).
The He II 4686 emission line is clearly
detected in its brightest region, as well as both the blue and the red
WR bump s.
- UM 420: is a blue compact galaxy, but
not a dwarf object, hosting intense star-formation activity. Besides it
is located at 237 Mpc, we observe a central region and two
kind of bright H
tails pointing towards different directions. Its kinematics is also
perturbed. It has a very low metallicity for an object with its
absolute optical/NIR luminosities, suggesting that
it is a merging of two independent galaxies. We detect the He II
4686
emission line but not the blue WR bump in its brightest
region. We found a probable N/O enrichment in the central region. Its
colors and properties are somewhat contaminated by the spiral disk of
the foreground galaxy UGC 1809, located at 97 Mpc.
- SBS 0926+606: is a galaxy pair with high
star-formation activity. Member A is a BCDG that shows a double
nucleus; both its morphology and kinematics strongly suggests that it
is a galaxy merger. We do not detect any WR features in this
galaxy but only the He II 4686
emission line. On the other hand, member B (another BCDG) hosts less
star-formation activity, but it also shows hints of interactions, in
particular a long diffuse optical tail that shows a TDG candidate. SBS
0926+606 B has a huge emission in UV; the
S FR derived from the FUV
luminosity is more than one order of magnitude higher than the H-based S FR.
The system still hosts a huge amount of neutral gas.
- SBS 0948+532: is a very compact and blue
object that hosts very high star-formation activity. Its
ratio
is very high in comparison with objects with similar properties.
Although usually classified as BCDGs, its total B-luminosity
indicates that it is not a dwarf object. We detect a faint optical tail
mainly composed of old stars and with slightly disturbed kinematics. We
observed the nebular and broad He II 4686 lines.
- SBS 1054+365: is a very nearby BCDG
showing several star-forming regions embedded in a elliptical envelope
composed of old stars. The kinematics of the ionized gas seem to be
slightly disturbed. The main starbursting region shows the nebular and
broad He II 4686 lines. Although we do not
detect any clear interaction feature, its dynamical mass is too high in
comparison with that observed in similar objects, and its metallicity
is too high for a dwarf object. Further studies are needed to clarify
its nature.
- SBS 1211+540: is a very low-metallicity
BCDG. It is composed of two bright H
regions surrounded by a relatively old stellar component. This BCDG
seems to show a higher metallicity than expected for a dwarf object
with the same properties. The detection of two faint optical tails and
its disturbed kinematics suggest that this galaxy is experiencing its
first stages of a merger process. Although reported previously, we do
not detect any WR features.
- SBS 1319+579: is a cometary-like BCDG
showing two chains of intense star-forming regions over an underlying
low-luminosity component dominated by old stars. We detect a very faint
blue WR feature in the brightest knot. The analysis of the
kinematics of the ionized gas strongly suggests that it is composed of
two objects in interaction, which it is happening edge-on. Although
there is plenty of neutral gas, the star-formation is not very
efficient, showing very low
and
ratios
in comparison with similar objects. Furthermore, it does not
satisfy the Schmidt-Kennicutt law of star-formation and the H I dynamics
seem to be perturbed. We consider that the neutral gas has been
expelled from the galaxy, but interferometric observations are needed
to probe it.
- SBS 1415+437: is a very low-metallicity
BCDG that hosts a very strong star-forming region in which the nebular
He II 4686 emission line is
observed. It possesses a large old stellar population underlying the
starburst. We do not detect any optical nearby companions, and it does
not show any evidence of interactions.
- III Zw 107: is a BCDG showing two strong
star-forming bursts embedded in an irregular envelope. A diffuse
prominent tail is detected in this object. The broad He II
4686
line is found in the brightest knot, which shows a slightly higher N/O
ratio. The neutral gas may have been expelled and/or dispersed. This
galaxy is likely composed of two dwarf objects in process of
interaction or merging.
- Tol 9: is a BCG that belongs to the
Klemola 13 galaxy group. It is an elliptical-shaped galaxy with intense
nebular emission and chemically evolved. We detected morphological and
kinematical patterns that suggest interaction features. Our deep H
image reveals an extended filamentary structure with two main features
that are located almost perpendicular to the main optical axis of the
galaxy. The probable origin of this structure is a galactic wind. We
detected both the blue and red WR bumps in the central region.
The H I morphology and
kinematics are quite intriguing, because this galaxy and two
surrounding dwarf objects are embedded in the same H I cloud
(López-Sánchez et al. 2008b,
2010b).
- Tol 1457-262: is a system composed of two bright objects and two dwarf galaxies, all showing nebular emission. We detect the nebular He II line in the brightest knots of the main object. The regions within this system show chemical differences and peculiar kinematics. The neutral gas content seems to be very high, and its dynamics highly perturbed, although detailed H I map should be required to quantify this. We consider that this system is a galaxy group in which its members interact.
- Arp 252: is a galaxy pair composed by
two spiral galaxies, ESO 566-8 (A) and ESO 566-7 (B),
in the first stages of a major merger. This object shows two long tails
mainly composed by old stars but hosting some star-forming regions and
TDG candidates. ESO 566-8 shows the broad and nebular He II
4686
emission line and the red WR bump. Its N/O is quite high for a
galaxy with its oxygen abundance. ESO 566-8 has a strong
star-formation and may host some kind of nuclear activity, because the
FIR/radio relation is not satisfied in it. Although it was previously
observed by other authors, we do not observe any WR feature in
ESO 566-7.
- NGC 5253: is a very nearby BCDG showing
many peculiarities with respect to objects of similar characteristics.
We detect clear broad WR features in the central regions,
indicating the presence of both WNL and WCE stars. We confirmed a
localized N enrichment in certain zones in the center
of the galaxy and suggested a possible slight He overabundance in the
same areas. We demonstrated that the enrichment pattern agrees with
that expected for the pollution by the ejecta of WR stars. The
amount of enriched material needed to produce the observed
overabundance is consistent with the mass lost by the number of
WR stars estimated in the starbursts (see López-Sánchez
et al. 2007,
for details). Although the kinematics of the ionized gas is somewhat
peculiar, stellar kinematics seem to be the consequence of rotation.
Our optical study has not revealed any disturbed feature of a recent
interaction process. However, its H I morphology
is disturbed and its kinematics are quite intriguing, because it does
not show any sign of regular rotation. The origin of this anomaly is
most likely the disruption/accretion of a dwarf gas-rich companion or
the interaction with another galaxy in the M 83 subgroup
(Kobulnicky & Skillman 2008;
López-Sánchez et al. 2008a,
2010a).
Furthermore, its
and
 ratios are very low and it does not satisfy the Schmidt-Kennicutt law
of star-formation.
ratios are very low and it does not satisfy the Schmidt-Kennicutt law
of star-formation.
References
- Alloin, D., Collin-Souffrin, S., Joly, M., & Vigroux, L. 1979, A&A, 78, 200 [NASA ADS] [Google Scholar]
- Amorín, R. O., Muñoz-Tuñón, C., Aguerri, J. A. L., Cairós, L. M., & Caon, N. 2007, A&A, 467, 541 [NASA ADS] [CrossRef] [EDP Sciences] [Google Scholar]
- Amorín, R., Aguerri, J. A. L., Muñoz-Tuñón, C., & Cairós, L. M. 2009, A&A, 501, 75 [NASA ADS] [CrossRef] [EDP Sciences] [Google Scholar]
- Arp, H. C. 1966, ApJS, 14, 1 [NASA ADS] [CrossRef] [Google Scholar]
- Arribas, S., Bushouse, H., Lucas, R. A., Colina, L., & Borne, K. D. 2004, AJ, 127, 2522 [NASA ADS] [CrossRef] [Google Scholar]
- Barnes, D. G., Staveley-Smith, L., de Blok, W. J. G., et al. 2001, MNRAS, 322, 486 [NASA ADS] [CrossRef] [Google Scholar]
- Barone, L. T., Heithausen, A., Hüttemeister, S., Fritz, T., & Klein, U. 2002, MNRAS, 317, 649 [Google Scholar]
- Barton, E. J., Geller, M. J., & Kenyon, S. J. 2000, ApJ, 530, 660 [NASA ADS] [CrossRef] [Google Scholar]
- Basu-Zych, A. R., Gon calves, T. S., Overzier, R., et al. 2009, ApJ, 699, 118 [Google Scholar]
- Begum, A., Chengalur, J. N., Karachentsev, I. D., Kaisin, S. S., & Sharina, M. E. 2006, MNRAS, 365, 1220 [NASA ADS] [CrossRef] [Google Scholar]
- Begum, A., Chengalur, J. N., Karachentsev, I. D., Sharina, M. E., & Kaisin, S. S. 2008, MNRAS, 386, 1667 [NASA ADS] [CrossRef] [Google Scholar]
- Bekki, K. 2008, MNRAS, 388, 10 [Google Scholar]
- Bell, E. F. 2003, ApJ, 586, 794 [Google Scholar]
- Bell, E. F., & de Jong, R. S. 2000, MNRAS, 312, 497 [NASA ADS] [CrossRef] [Google Scholar]
- Bergvall, N., & Östlin, G. 2002, A&A, 390, 891 [NASA ADS] [CrossRef] [EDP Sciences] [Google Scholar]
- Bessell, M. S., Castelli, F., & Plez, B. 1998, A&A, 333, 231 [NASA ADS] [Google Scholar]
- Bomans, D. J. 2005, proceedings of The Evolution of the Starburst: The 331st Wilhelm and Else Heraeus Seminar, AIPC, 783, 98 [Google Scholar]
- Bomans, D. J., van Eymeren, J. Dettmar, R.-J., Weis, K., & Hopp, U. 2007, NewAR, 51, 141 [Google Scholar]
- Boselli, A., Gavazzi, G., Donas, J., & Scodeggio, M. 2001, AJ, 121, 753 [NASA ADS] [CrossRef] [Google Scholar]
- Bothun, G. D., Romanishin, W., Strom, S. E., & Strom, K. M. 1984, AJ, 89, 1300 [NASA ADS] [CrossRef] [Google Scholar]
- Braine, J., Lisenfeld, U., Due, P.-A., & Leon, S. 2000, Nature, 403, 867 [NASA ADS] [CrossRef] [PubMed] [Google Scholar]
- Braine, J., Duc, P.-A., Lisenfeld, U., et al. 2001, A&A, 378, 51 [NASA ADS] [CrossRef] [EDP Sciences] [Google Scholar]
- Braine, J., Duc, P.-A., Lisenfeld, U., et al. 2004, in Recycling Intergalactic and Interstellar Matter, ed. P. A. Duc, J. Braine, & E. Brinks, IAU Symp., 217, 518 [Google Scholar]
- Bravo-Alfaro, H., Brinks, E., Baker, A. J., Walter, F., & Kunth, D. 2004, AJ, 127, 264 [NASA ADS] [CrossRef] [Google Scholar]
- Bravo-Alfaro, H., Coziol, R., & Brinks, E. 2006, RevMexAA, 42, 261 [Google Scholar]
- Brinchmann, J., Kunth, D., & Durret, F. 2008, A&A, 485, 657 [NASA ADS] [CrossRef] [EDP Sciences] [Google Scholar]
- Broeils, A. H., & van Woerden, H. 1994, A&AS, 107, 129 [Google Scholar]
- Bruzual, G., & Charlot, S. 2003, MNRAS, 344, 1000, BC03 [NASA ADS] [CrossRef] [Google Scholar]
- Cairós, L. M., Vílchez, J. M., González Pérez, J. N., Iglesias-Páramo, J., & Caon, N. 2001a, ApJS, 133, 321 [NASA ADS] [CrossRef] [Google Scholar]
- Cairós, L. M., Caon, N., Vílchez, J. M., González-Pérez, J. N. & Muñoz-Tuñón, C. 2001b, ApJS, 136, 393 [NASA ADS] [CrossRef] [Google Scholar]
- Cairós, L. M., Caon, N., Zurita, C., et al. 2009, A&A, 507, 1291 [NASA ADS] [CrossRef] [EDP Sciences] [Google Scholar]
- Calura, F., Matteucci, F. & Menci, N. 2004, MNRAS, 353, 500 [NASA ADS] [CrossRef] [Google Scholar]
- Calzetti, D. 2001, PASP, 113, 1149 [Google Scholar]
- Calzetti, D., Kennicutt, R. C., Engelbracht, C. W., et al. 2007, ApJ, 666, 870 [NASA ADS] [CrossRef] [Google Scholar]
- Campos-Aguilar, A., Moles, M., & Masegosa, J. 1993, AJ, 106 1784 [NASA ADS] [CrossRef] [Google Scholar]
- Cannon, J. M., Skillman, E. D., Kunth, D., et al. 2004, ApJ, 608, 768 [NASA ADS] [CrossRef] [Google Scholar]
- Cardamone, C., Schawinski, K., Sarzi, M., et al. 2009, MNRAS, 399, 1191 [NASA ADS] [CrossRef] [Google Scholar]
- Cardelli, J. A., Clayton, G. C., & Mathis J. S. 1989, ApJ, 345, 245 [NASA ADS] [CrossRef] [Google Scholar]
- Casasola, V., Bettoni, D., & Galletta, G. 2004, A&A, 422, 941 [NASA ADS] [CrossRef] [EDP Sciences] [Google Scholar]
- Clayton, D. D., & Pantelaki, I. 1993, PhR, 227, 293 [Google Scholar]
- Colina, L., Bohlin, R. C., & Castelli, F. 1996, AJ, 112, 307 [NASA ADS] [CrossRef] [Google Scholar]
- Colina, L., Arribas, S., & Monreal-Ibero, A. 2005, ApJ, 621, 725 [NASA ADS] [CrossRef] [Google Scholar]
- Condon, J. J. 1992, ARA&A, 30, 575 [NASA ADS] [CrossRef] [MathSciNet] [Google Scholar]
- Condon, J. J., Helou, G., Sanders, D. B., & Soifer, B. T. 1990, ApJS, 73, 359 [NASA ADS] [CrossRef] [Google Scholar]
- Condon, J. J., Anderson, M. L., & Helou, G. 1991, ApJ, 376, 95 [NASA ADS] [CrossRef] [Google Scholar]
- Condon, J. J., Cotton, W. D., Greisen, E. W., et al. 1998, AJ, 115, 1693 [NASA ADS] [CrossRef] [Google Scholar]
- Condon, J. J., Cotton, W. D., & Broderick, J. J. 2002, AJ, 124, 675 [NASA ADS] [CrossRef] [Google Scholar]
- Crowther, P. A. 2007, ARA&A, 45, 177 [NASA ADS] [CrossRef] [Google Scholar]
- Crowther, P. A., & Hadfield, L. J. 2006, A&A, 449, 711 [NASA ADS] [CrossRef] [EDP Sciences] [Google Scholar]
- Cumming, R. J., Fathi, K., Östlin, G., et al. 2008, A&A, 479, 725 [NASA ADS] [CrossRef] [EDP Sciences] [Google Scholar]
- Davé, R., & Oppenheimer, B. D. 2007, MNRAS, 374, 427 [NASA ADS] [CrossRef] [Google Scholar]
- Davies, J. I., & Phillipps, S. 1988, MNRAS, 233, 553 [NASA ADS] [CrossRef] [Google Scholar]
- Davoust, E., & Contini, T. 2004, A&A, 416, 515 [NASA ADS] [CrossRef] [EDP Sciences] [Google Scholar]
- de Blok, W. J. G., Walter, F., Brinks, E., et al. 2008, AJ, 136, 2648 [NASA ADS] [CrossRef] [Google Scholar]
- de Jong, R. S. 1996, A&A, 313, 377 [NASA ADS] [Google Scholar]
- De Lucia, G., Kauffmann, G., & White, S. D. M. 2004, MNRAS, 374, 323 [Google Scholar]
- Denicoló, G., Terlevich, R., & Terlevich, E. 2002, MNRAS, 330, 69 [NASA ADS] [CrossRef] [Google Scholar]
- de Naray, R. K., McGaugh, S. S., & de Blok, W. J. G. 2004, MNRAS, 355, 887 [NASA ADS] [CrossRef] [Google Scholar]
- De Rossi, M. E., Tissera, P. B., & Scannapieco, C. 2006, MNRAS, 374, 323 [Google Scholar]
- Díaz, A. I., & Pérez-Montero, E. 2000, MNRAS, 312, 130 [NASA ADS] [CrossRef] [Google Scholar]
- Dopita, M. A., & Evans, I. N. 1986, ApJ, 307, 431 [NASA ADS] [CrossRef] [Google Scholar]
- Dopita, M. A., Kewley, L. J., Heisler, C. A., & Sutherland, R. S. 2000, ApJ, 542, 224 [NASA ADS] [CrossRef] [Google Scholar]
- Dopita, M. A., Pereira, M., Kewley, L. J., & Capaccioli, M. 2002, ApJS, 143, 47 [NASA ADS] [CrossRef] [Google Scholar]
- Draine, B. T., Dale, D. A., Bendo, G., et al. 2007, ApJ, 663, 866 [NASA ADS] [CrossRef] [Google Scholar]
- Dubois, Y., & Teyssier, R. 2007, EAS, 24, 95 [EDP Sciences] [Google Scholar]
- Duc, P.-A., & Mirabel, I. F. 1998, A&A, 338, 813 [NASA ADS] [Google Scholar]
- Duc, P. A., Brinks, E., Springel, V., et al. 2000, AJ, 120, 1238 [NASA ADS] [CrossRef] [Google Scholar]
- Edmunds, M. G. 1990, MNRAS, 246, 678 [NASA ADS] [Google Scholar]
- Edmunds, M. G., & Pagel, B. E. J. 1978, MNRAS, 185, 77 [NASA ADS] [CrossRef] [Google Scholar]
- Edmunds, M. G., & Pagel, B. E. J. 1984, MNRAS, 211, 507 [NASA ADS] [CrossRef] [Google Scholar]
- Ekta, C. J. N., & Pustilnik, S. A. 2006, MNRAS, 372, 853 [NASA ADS] [CrossRef] [Google Scholar]
- Ekta, C. J. N., & Pustilnik, S. A. 2008, MNRAS, 391, 881 [NASA ADS] [CrossRef] [Google Scholar]
- Emonts, B. H. C., Morganti, R., Oosterloo, T. A., et al. 2006, AN, 327, 139 [NASA ADS] [CrossRef] [Google Scholar]
- English, J., Koribalski, B. S., Bland-Hawthorn, J., Freeman, K. C., & McCain, C. F. 2010, AJ, 139, 102 [NASA ADS] [CrossRef] [Google Scholar]
- Erb, D. K., Shapley, A. E., Steidel, C. C., et al. 2003, ApJ, 591, 101 [NASA ADS] [CrossRef] [Google Scholar]
- Erb, D. K., Shapley, A. E., Pettini, M., et al. 2006, ApJ, 644, 813 [NASA ADS] [CrossRef] [Google Scholar]
- Esteban, C., & Peimbert, M. 1995, A&A, 300, 78 [NASA ADS] [Google Scholar]
- Esteban, C., Bresolin, F., Peimbert, M., et al. 2009, ApJ, 700, 654 [NASA ADS] [CrossRef] [Google Scholar]
- Fabbiano, G., Feigelson, E., & Zamorani, G. 1982, ApJ, 256, 397 [NASA ADS] [CrossRef] [Google Scholar]
- Ferland, G. J., Korista, K. T., Verner, D. A., et al. 1998, PASP, 110, 761 [Google Scholar]
- Fioc, M., & Rocca-Volmerange, B. 1997, A&A, 326, 950 [NASA ADS] [Google Scholar]
- Gallagher, J. S. III, Hunter, D. A., & Tutukov, A. V. 1984, ApJ, 284, 544 [NASA ADS] [CrossRef] [Google Scholar]
- García-Lorenzo, B., Cairós, L. M., Caon, N., Monreal-Ibero, A., & Kehrig, C. 2008, ApJ, 677, 201 [NASA ADS] [CrossRef] [Google Scholar]
- García-Rojas, J., & Esteban, C. 2007, ApJ, 670, 457 [NASA ADS] [CrossRef] [Google Scholar]
- Garnett, D. R. 1992, AJ, 103, 1330 [NASA ADS] [CrossRef] [Google Scholar]
- Garnett, D. R. 2002, ApJ, 581, 1019 [NASA ADS] [CrossRef] [MathSciNet] [Google Scholar]
- Genzel, R., Lutz, D., Sturm, E., et al. 1998, ApJ, 498, 579 [NASA ADS] [CrossRef] [Google Scholar]
- Gerola, H., Seiden, P. E., & Schulman, L. S. 1980, ApJ, 242, 517 [NASA ADS] [CrossRef] [Google Scholar]
- Giovanelli, R., Haynes, M. P., Kent, B. R., et al. 2005, AJ, 130, 2598 [NASA ADS] [CrossRef] [Google Scholar]
- Gil de Paz, A., Madore, B. F., & Pevunova, O. 2003, ApJS, 147, 29 [NASA ADS] [CrossRef] [Google Scholar]
- Gil de Paz, A., Madore, B. F., Boissier, S., et al. 2005, ApJ, 627, 29 [Google Scholar]
- Gil de Paz, A., Madore, B. F., Boissier, S., et al. 2007, ApJ, 661, 115 [NASA ADS] [CrossRef] [Google Scholar]
- Gordon, D., & Gottesman, S. T. 1981, AJ, 86, 161 [NASA ADS] [CrossRef] [Google Scholar]
- Guzman, R., Gallego, J., Koo, D. C., et al. 1997, ApJ, 489, 559 [NASA ADS] [CrossRef] [Google Scholar]
- Hägele, G. F., Díez, Á. I., Terlevich, E., et al. 2008, MNRAS, 383, 209 [NASA ADS] [CrossRef] [Google Scholar]
- Heckamn, T. M. 1999, Ap&SS, 266, 3 [NASA ADS] [CrossRef] [Google Scholar]
- Henry, R. B. C., Edmunds, M. G., & Köppen, J. 2000, ApJ, 541, 660 [NASA ADS] [CrossRef] [Google Scholar]
- Hidalgo-Gámez, A. M., & Olofsson, K. 1998, A&A, 334, 45 [NASA ADS] [Google Scholar]
- Hibbard, J. E., & van Gorkom, J. H. 1996, AJ, 111, 655 [NASA ADS] [CrossRef] [Google Scholar]
- Hibbard, J. E., van Gorkom, J. H., Rupen, M. P., & Schiminovich, D. 2001b, An HI Rogues Gallery, Gas and Galaxy Evolution, ASP Conf. Ser., 240, 657 [Google Scholar]
- Hirashita, H. 2000, PASJ, 52, 107 [NASA ADS] [Google Scholar]
- Hirashita, H., Inoue, A. K., Kamaya, H., & Shibai, H. 2001, A&A, 366, 83 [NASA ADS] [CrossRef] [EDP Sciences] [Google Scholar]
- Hopkins, A. M., Schulte-Ladbeck, R. E., & Drozdovsky, I. O. 2002, AJ, 124, 862 [NASA ADS] [CrossRef] [Google Scholar]
- Huchtmeier, W. K., Sage, L. J., & Henkel, C. 1995, A&A, 300, 675 [NASA ADS] [Google Scholar]
- Huchtmeier, W. K., Krishna, G., & Petrosian, A. 2005, A&A, 434, 887 [NASA ADS] [CrossRef] [EDP Sciences] [Google Scholar]
- Huchtmeier, W. K., Petrosian, A., Krishna, G., & Kunth, D. 2007, A&A, 462, 919 [NASA ADS] [CrossRef] [EDP Sciences] [Google Scholar]
- Huchtmeier, W. K., Petrosian, A., Krishna, G., McLean, B., & Kunth, D. 2008, A&A, 492, 367 [NASA ADS] [CrossRef] [EDP Sciences] [Google Scholar]
- Izotov, Y. I., & Thuan, T. X. 1998, ApJ, 500, 188 [NASA ADS] [CrossRef] [Google Scholar]
- Izotov, Y. I., & Thuan, T. X. 1999, ApJ, 511, 639 [NASA ADS] [CrossRef] [Google Scholar]
- Izotov, Y. I., & Thuan, T. X. 2004, ApJ, 616, 768 [CrossRef] [Google Scholar]
- Izotov, Y. I., Papaderos, P., Guseva, N. G., Fricke, K. J., & Thuan, T. X. 2004, A&A, 421, 539 [NASA ADS] [CrossRef] [EDP Sciences] [Google Scholar]
- Izotov, Y. I., Stasinska, G., Meynet, G., Guseva, N. G., & Thuan, T. X. 2006, A&A, 448, 955 [NASA ADS] [CrossRef] [EDP Sciences] [Google Scholar]
- James, A., Dunne, L., Eales, S., & Edmunds, M. G. 2002, MNRAS, 335, 753 [NASA ADS] [CrossRef] [Google Scholar]
- James, P. A., Shane, N. S., Knapen, J. H., Etherton, J., & Percival, S. M. 2005, A&A, 429, 851 [NASA ADS] [CrossRef] [EDP Sciences] [Google Scholar]
- James, B. L., Tsamis, Y. G., Barlow, M. J., et al. 2009, MNRAS, 398, 2 [NASA ADS] [CrossRef] [Google Scholar]
- James, B. L., Tsamis, Y. G., & Barlow, M. J. 2010, MNRAS, 401, 759 [NASA ADS] [CrossRef] [Google Scholar]
- Jansen, R. A., Franx, M., Fabricant, D., & Caldwell, N. 2000, ApJS, 126, 271 [NASA ADS] [CrossRef] [Google Scholar]
- Jensen, E. B., Strom, K. M., & Strom, S. E. 1976, ApJ, 209, 748 [NASA ADS] [CrossRef] [Google Scholar]
- Johnson, K. E., & Kobulnicky, H. A. 2003, ApJ, 597, 923 [NASA ADS] [CrossRef] [Google Scholar]
- Johnson, K. E., Indebetouw, R., Watson, C., & Kobulnicky, H. A. 2004, AJ, 128, 610 [NASA ADS] [CrossRef] [Google Scholar]
- Joseph, R. D., & Wright, G. S. 1985, MNRAS, 214, 87 [NASA ADS] [Google Scholar]
- Karachentsev, I. D., Karachentseva, V. E., Huchtmeier, W. K., & Makarov, D. I. 2004, AJ, 127, 2031 [Google Scholar]
- Kauffmann, G., & White, S. D. M. 1993, MNRAS, 261, 921 [NASA ADS] [CrossRef] [Google Scholar]
- Kaufman, M., Brinks, E., Elmegreen, D. M., et al. 1997, AJ, 114, 2323 [NASA ADS] [CrossRef] [Google Scholar]
- Kauffmann, G., Heckman, T. M., Tremonti, C., et al. 2003, MNRAS, 346, 1055 [Google Scholar]
- Kay, S. T., Pearce, F. R., Frenk, C. S., & Jenkins, A. 2002, MNRAS, 330, 113 [NASA ADS] [CrossRef] [Google Scholar]
- Kennicutt, R. C. Jr. 1998, ApJ, 498, 541 [NASA ADS] [CrossRef] [Google Scholar]
- Kennicutt, R. C. Jr., Bresolin, F., & Garnett, D. R. 2003, ApJ, 591, 801 [CrossRef] [Google Scholar]
- Kennicutt, R. C. Jr., Calzetti, D., Walter, F., et al. 2007, ApJ, 671, 333 [NASA ADS] [CrossRef] [Google Scholar]
- Kewley, L. J., & Dopita, M. A. 2002, ApJS, 142, 35 [NASA ADS] [CrossRef] [Google Scholar]
- Kewley, L. J., & Ellison, S. E. 2008, ApJ, 681, 1183 [NASA ADS] [CrossRef] [Google Scholar]
- Kewley, L. J., Dopita, M. A., Sutherland, R. S., Heisler, C. A., & Trevena, J. 2001, ApJS, 556, 121 [Google Scholar]
- Kinman, T. D., & Davidson, K. 1981, ApJ, 243, 127 [NASA ADS] [CrossRef] [Google Scholar]
- Kirby, E. M., Jerjen, H., Ryder, S. D., & Driver, S. P. 2008, AJ, 136, 1866 [NASA ADS] [CrossRef] [Google Scholar]
- Kobulnicky, H. A., & Skillman, E. D. 1998, ApJ, 497, 601 [NASA ADS] [CrossRef] [Google Scholar]
- Kobulnicky, H. A., & Johnson, K. E. 1999, ApJ, 627, 154 [NASA ADS] [CrossRef] [Google Scholar]
- Kobulnicky, H. A., & Kewley, L. J. 2004, ApJ, 617, 240 [NASA ADS] [CrossRef] [Google Scholar]
- Kobulnicky, H. A., & Skillman, E. D. 2008, AJ, 135, 527 [NASA ADS] [CrossRef] [Google Scholar]
- Kobulnicky, H. A., Skillman, E. D., Roy, J.-R., Walsh, J. R., & Rosa, M. R. 1997, ApJ, 277, 679 [NASA ADS] [CrossRef] [Google Scholar]
- Kobulnicky, H. A., Kennicutt, R. C. Jr., & Pizagno, J. L. 1999, ApJ, 514, 544 [NASA ADS] [CrossRef] [Google Scholar]
- Kobulnicky, H. A., Willmer, C. N. A., Phillips, A. C., et al. 2003, ApJ, 599, 1006 [NASA ADS] [CrossRef] [Google Scholar]
- Koribalski, B. 1996, ASPC, 106, 238 [NASA ADS] [Google Scholar]
- Koribalski, B., & Dickey, J. M. 2004, MNRAS, 348, 1255 [NASA ADS] [CrossRef] [Google Scholar]
- Koribalski, B., & Manthey, E. 2005, MNRAS, 358, 202 [NASA ADS] [CrossRef] [Google Scholar]
- Koribalski, B. S., & López-Sánchez, Á. R. 2009, MNRAS, 400, 1749 [NASA ADS] [CrossRef] [Google Scholar]
- Koribalski, B., Gordon, S., & Jones, K. 2003, MNRAS, 339, 1203 [NASA ADS] [CrossRef] [Google Scholar]
- Koribalski, B. S.,Staveley-Smith, L., Kilborn, V. A., et al. 2004, AJ, 128, 16 [NASA ADS] [CrossRef] [Google Scholar]
- Lambas, D. G., Tissera, P. B., Alonso, M. S., & Coldwell, G. 2003, MNRAS, 346, 1189 [NASA ADS] [CrossRef] [Google Scholar]
- Larson, R. B., & Tinsley, B. M. 1978, ApJ, 219, 46 [NASA ADS] [CrossRef] [Google Scholar]
- Lee, H., McCall, M. L., Kingsburgh, R. L., Ross, R., & Stevenson, C. C. 2003, AJ, 125, 146 [NASA ADS] [CrossRef] [Google Scholar]
- Lee, J. C., Salzer, J. J., & Melbourne, J. 2004, ApJ, 616, 752L [NASA ADS] [CrossRef] [Google Scholar]
- Lee, H., Zucker, D. B., & Grebel, E. K. 2007, MNRAS, 376, 820 [NASA ADS] [CrossRef] [Google Scholar]
- Lee, J. C., Gil de Paz, A., Tremonti, C., et al. 2009, ApJ, 706, 599 [NASA ADS] [CrossRef] [Google Scholar]
- Leitherer, C., Schaerer, D., Goldader, J. D., et al. 1999, ApJS, 123, 3, STARBURST 99 [NASA ADS] [CrossRef] [Google Scholar]
- Lequeux, J., Peimbert, M., Rayo, J. F., Serrano, A., & Torres-Peimbert, S. 1979, A&A, 80, 155 [NASA ADS] [Google Scholar]
- Leroy, A. K., Walter, F., Brinks, E., et al. 2008, AJ, 136, 2782 [NASA ADS] [CrossRef] [Google Scholar]
- Liang, Y. C., Yin, S. Y., Hammer, F., et al. 2006, ApJ, 652, 257 [NASA ADS] [CrossRef] [Google Scholar]
- Lilly, S. J., Carollo, C. M., & Stockton, A. N. 2003, ApJ, 597, 730 [NASA ADS] [CrossRef] [Google Scholar]
- Lisenfeld, U., & Ferrara, A. 1998, ApJ, 496, 145 [NASA ADS] [CrossRef] [Google Scholar]
- Lonsdale, C. J., Persson, S. E., & Matthews, K. 1984, ApJ, 287, 95 [NASA ADS] [CrossRef] [Google Scholar]
- López-Sánchez, Á. R. 2006, Ph.D. Thesis, Universidad de la Laguna, Tenerife, Spain [Google Scholar]
- López-Sánchez, Á. R., & Esteban, C. 2008, A&A, 491, 131, Paper I [NASA ADS] [CrossRef] [EDP Sciences] [Google Scholar]
- López-Sánchez, Á. R., & Esteban, C. 2009, A&A, 508, 615, Paper II [NASA ADS] [CrossRef] [EDP Sciences] [Google Scholar]
- López-Sánchez, Á. R., & Esteban, C. 2010a, A&A, 516, 104, Paper III [Google Scholar]
- López-Sánchez, Á. R., & Esteban, C. 2010b, A&A, 517, A85, Paper IV [NASA ADS] [CrossRef] [EDP Sciences] [Google Scholar]
- López-Sánchez, Á. R., Esteban, C., & Rodríguez, M. 2004a, ApJS, 153, 243 [NASA ADS] [CrossRef] [Google Scholar]
- López-Sánchez, Á. R., Esteban, C., & Rodríguez, M. 2004b, A&A, 428,445 [NASA ADS] [CrossRef] [EDP Sciences] [Google Scholar]
- López-Sánchez, Á. R., Esteban, C., & García-Rojas, J. 2006, A&A, 449, 997 [NASA ADS] [CrossRef] [EDP Sciences] [Google Scholar]
- López-Sánchez, Á. R., Esteban, C., García-Rojas, J., Peimbert, M., & Rodríguez, M. 2007, ApJ, 656, 168 [NASA ADS] [CrossRef] [Google Scholar]
- López-Sánchez, Á. R., Koribalski, B., & Esteban, C. 2008a, proc. of Galaxies in the Local Volume (Springer), 53 [Google Scholar]
- López-Sánchez, Á. R., Koribalski, B., Esteban, C., & Hibbard, J. 2008b, proc. of Galaxies in the Local Volum (Springer), 301 [Google Scholar]
- López-Sánchez, Á. R., Koribalski, B. S., van Eymeren, J., et al. 2010a, MNRAS, in prep., NGC 5253 [Google Scholar]
- López-Sánchez, Á. R., Koribalski, B. S., Esteban, C., et al. 2010b, MNRAS, in prep., Tol 9 [Google Scholar]
- Lou, Y.-Q., & Bian, F.-Y. 2005, MNRAS, 358, 1231 [NASA ADS] [CrossRef] [Google Scholar]
- Mac Low, M.-M., & Ferrara, A. 1999, ApJ, 513, 142 [NASA ADS] [CrossRef] [Google Scholar]
- Marlowe, A. T., Heckman, T. M., Wyse, R. F. G., & Schommer, R. 1995, ApJ, 438, 563 [NASA ADS] [CrossRef] [Google Scholar]
- Mathewson, D. S., Ford, V. L., & Buchhorn, M. 1992, ApJS, 81, 413 [NASA ADS] [CrossRef] [Google Scholar]
- McCall, M. L., Rybski, P. M., & Shields, G. A. 1985, ApJS, 57, 1 [NASA ADS] [CrossRef] [Google Scholar]
- McGaugh, S. S. 1991, ApJ, 380, 140 [NASA ADS] [CrossRef] [Google Scholar]
- McGaugh, S. S. 1994, ApJ, 426, 135 [NASA ADS] [CrossRef] [Google Scholar]
- McGaugh, S. S., & de Blok, W. J. G. 1997, ApJ, 481, 689 [NASA ADS] [CrossRef] [Google Scholar]
- Mendes de Oliveira, C. L., Temporin, S., Cypriano, E. S., et al. 2006, AJ, 132, 570 [NASA ADS] [CrossRef] [Google Scholar]
- Méndez, D. I., & Esteban, C. 1997, ApJ, 488, 652 [NASA ADS] [CrossRef] [Google Scholar]
- Méndez, D. I., & Esteban, C. 1999, AJ, 118, 2733 [Google Scholar]
- Méndez, D. I., & Esteban, C. 2000, A&A, 359, 493 [NASA ADS] [Google Scholar]
- Meyer, M. J., Zwaan, M. A., Webster, R. L., et al. 2004, MNRAS, 350, 1195 [NASA ADS] [CrossRef] [Google Scholar]
- Meynet, G., & Maeder, A. 2002, A&A, 390, 561 [NASA ADS] [CrossRef] [EDP Sciences] [Google Scholar]
- Meynet G., & Maeder A. 2005, A&A, 429, 581 [Google Scholar]
- Morrissey, P., & GALEX Science Team 2005, BAAS, 37, 1454 [NASA ADS] [Google Scholar]
- Muñoz-Mateos, J. C., Gil de Paz, A., Zamorano, J., et al. 2009, ApJ, 703, 1569 [NASA ADS] [CrossRef] [Google Scholar]
- Nagao, T., Maiolino, R., & Marconi, A. 2006, A&A, 459, 85 [NASA ADS] [CrossRef] [EDP Sciences] [Google Scholar]
- Niklas, S., Klein, U., & Wielebinski, R. 1997, A&A, 322, 19 [NASA ADS] [Google Scholar]
- Nikolic, B., Cullen, H. & Alexander, P. 2004, MNRAS, 355, 874 [NASA ADS] [CrossRef] [Google Scholar]
- Noeske, K. G., Iglesias-Páramo, J., Vílchez, J. M., Papaderos, P., & Fricke, K. J. 2001, A&A, 371, 806 [NASA ADS] [CrossRef] [EDP Sciences] [Google Scholar]
- Noeske, K. G., Papaderos, P., Cairós, L. M., & Fricke, K. J. 2003, A&A, 410, 481 [NASA ADS] [CrossRef] [EDP Sciences] [Google Scholar]
- Noeske, K. G., Papaderos, P., Cairós, L. M., & Fricke, K. J. 2005, A&A, 429, 115 [NASA ADS] [CrossRef] [EDP Sciences] [Google Scholar]
- Oey, M. S., & Shields, J. C. 2000, ApJ, 539, 687 [NASA ADS] [CrossRef] [Google Scholar]
- Östlin, G., Amram, P., Bergvall, N., et al. 2001, A&A, 374, 800 [NASA ADS] [CrossRef] [EDP Sciences] [Google Scholar]
- Östlin, G., Cumming, R. J., Amram, P., et al. 2004, A&A, 419, 43 [Google Scholar]
- Overzier, R. A., Abbott, R., Adhikari, R., et al. 2009, ApJ, 706, 203 [NASA ADS] [CrossRef] [Google Scholar]
- Pagel, B. E. J., Edmunds, M. G., Blackwell, D. E., Chun, M. S., & Smith, G. 1979, MNRAS, 189, 95 [NASA ADS] [CrossRef] [Google Scholar]
- Papaderos, P., Guseva, N. G., Izotov, Y. I., et al. 2006, A&A, 457, 45 [NASA ADS] [CrossRef] [EDP Sciences] [Google Scholar]
- Paturel, G., Theureau, G., Bottinelli, L., et al. 2003, A&A, 412, 57 [NASA ADS] [CrossRef] [EDP Sciences] [Google Scholar]
- Peimbert, M. 1967, ApJ, 150, 825 [NASA ADS] [CrossRef] [Google Scholar]
- Peimbert, M., Peimbert, A., Esteban, C., et al. 2007, RMxAC, 29, 72 [NASA ADS] [Google Scholar]
- Peña, M., & Ayala, S. 1993, RevMexAA, 27, 171 [Google Scholar]
- Pérez-Montero, E., & Díaz, A. I. 2005, MNRAS, 361, 1063 [NASA ADS] [CrossRef] [Google Scholar]
- Pettini, M., & Pagel, B. E. J. 2004, MNRAS, 348, 59 [Google Scholar]
- Pettini, M., Shapley, A. E., Steidel, C. C., et al. 2001, ApJ, 554, 981 [NASA ADS] [CrossRef] [Google Scholar]
- Pflamm-Altenburg, J., Weidner, C., & Kroupa, P. 2009, MNRAS, 395, 394 [NASA ADS] [CrossRef] [Google Scholar]
- Pilyugin, L. S. 2000, A&A, 362, 325 [NASA ADS] [Google Scholar]
- Pilyugin, L. S. 2001a, A&A, 369, 594 [NASA ADS] [CrossRef] [EDP Sciences] [Google Scholar]
- Pilyugin, L. S. 2001b, A&A, 374, 412 [NASA ADS] [CrossRef] [EDP Sciences] [Google Scholar]
- Pilyugin, L. S., & Thuan, T. X. 2005, ApJ, 631, 231 [NASA ADS] [CrossRef] [MathSciNet] [Google Scholar]
- Pilyugin, L. S., Thuan, T. X., & Vílchez, J. M. 2003, A&A, 397, 487 [NASA ADS] [CrossRef] [EDP Sciences] [Google Scholar]
- Pilyugin, L. S., Vílchez, J. M., & Contini, T. 2004, A&A, 425, 849 [NASA ADS] [CrossRef] [EDP Sciences] [Google Scholar]
- Piovan, L., Tantalo, R., & Chiosi, C. 2006, MNRAS, 366, 923 [NASA ADS] [Google Scholar]
- Pustilnik, S. A., Kniazev, A. Y., Lipovetsky, V. A., & Ugryumov, A. V. 2001, A&A, 373, 24 [NASA ADS] [CrossRef] [EDP Sciences] [Google Scholar]
- Pustilnik, S. A., Martin, J.-M., Huchtmeier, W. K., et al. 2002, A&A, 389, 405 [NASA ADS] [CrossRef] [EDP Sciences] [Google Scholar]
- Pustilnik, S., Kniazev, A., Pramskij, A., et al. 2004, A&A 419, 469 [NASA ADS] [CrossRef] [EDP Sciences] [Google Scholar]
- Putman, M. E., Staveley-Smith, L., Freeman, K. C., Gibson, B. K., & Barnes, D. G. 2003, ApJ, 586, 170 [NASA ADS] [CrossRef] [Google Scholar]
- Ranalli, P., Comastri, A., & Setti, G. 2003, A&A, 399, 39 [NASA ADS] [CrossRef] [EDP Sciences] [Google Scholar]
- Richer, M. G., & McCall, M. L. 1995, ApJ, 445, 642 [NASA ADS] [CrossRef] [Google Scholar]
- Robert, M. S. 1975, in Galaxies and the Universe, with an index prepared by Gustav A. Tammann, Published by the University of Chicago Press, ed. A. Sandage, M. Sandage, & J. Kristian ( Chicago: IL USA), Stars and Stellar Systems, 9, 309 [Google Scholar]
- Roberts, M. S., & Haynes, M. P. 1994, ARA&A, 32, 115 [NASA ADS] [CrossRef] [Google Scholar]
- Roussel, H., Sauvage, M., Vigroux, L., & Bosma, A. 2001, A&A, 372, 427 [NASA ADS] [CrossRef] [EDP Sciences] [MathSciNet] [Google Scholar]
- Rubin, V. C., Ford, W. K., Jr., & Whitmore, B. C. 1984, ApJ, 281, L21 [NASA ADS] [CrossRef] [Google Scholar]
- Salim, S., Rich, R. M., Charlot, S., et al. 2007, ApJS, 173, 267 [NASA ADS] [CrossRef] [Google Scholar]
- Salpeter, E. E., & Hoffman, G. L. 1996, ApJ, 465, 595 [NASA ADS] [CrossRef] [Google Scholar]
- Salzer, J. J., Rosenberg, J. L., Weisstein, E. W., Mazzarella, J. M., & Bothun, G. D. 2002, AJ, 124, 191 [NASA ADS] [CrossRef] [Google Scholar]
- Salzer, J. J., Lee, J. C., Melbourne, J., et al. 2005, ApJ, 624, 661 [NASA ADS] [CrossRef] [Google Scholar]
- Sanders, D. B. 1997, RMxAC, 6, 42 [NASA ADS] [Google Scholar]
- Sanders, D. B., & Mirabel, I. F. 1996, ARA&A, 34, 749 [NASA ADS] [CrossRef] [Google Scholar]
- Sargent, W. L. W., & Searle, L. 1970, ApJ, 162, L155 [NASA ADS] [CrossRef] [Google Scholar]
- Schaerer, D., & Vacca, W. D. 1998, ApJ, 497, 618 (SV98) [NASA ADS] [CrossRef] [Google Scholar]
- Schaerer, D., Contini, T., & Pindao, M. 1999, A&AS, 136, 35 [NASA ADS] [CrossRef] [EDP Sciences] [Google Scholar]
- Schmidt, M. 1959, ApJ, 129, 243 [NASA ADS] [CrossRef] [Google Scholar]
- Schmidt, M. 1963, ApJ, 137, 758 [NASA ADS] [CrossRef] [Google Scholar]
- Searle, L., & Sargent, W. L. W. 1972, ApJ, 173, 25 [NASA ADS] [CrossRef] [Google Scholar]
- Silich, S. A., & Tenorio-Tagle, G. 1998, MNRAS, 299, 249 [NASA ADS] [CrossRef] [Google Scholar]
- Skillman, E. D., Kennicutt, R. C., & Hodge, P. W. 1989, ApJ, 347, 875 [NASA ADS] [CrossRef] [Google Scholar]
- Skillman, E. D., Côté, S., & Miller, B. W. 2003, AJ, 125, 593 [NASA ADS] [CrossRef] [Google Scholar]
- Solomon, P. M., & Sage, L. J. 1988, ApJ, 334, 613 [NASA ADS] [CrossRef] [Google Scholar]
- Somerville, R. S., & Primack, J. R. 1999, MNRAS, 310, 1087 [CrossRef] [Google Scholar]
- Schneider, S. E. 1989, ApJ, 343, 94 [NASA ADS] [CrossRef] [Google Scholar]
- Springel, V., & Hernquist, L. 2003, MNRAS, 339, 312 [NASA ADS] [CrossRef] [Google Scholar]
- Springel, V., White, S. D. M., Jenkins, A., et al. 2005, Nature, 435, 629 [NASA ADS] [CrossRef] [PubMed] [Google Scholar]
- Stasinska, G. 2002, RMxAC, 12, 62 [NASA ADS] [Google Scholar]
- Stasinska, G. 2005, A&A, 434, 507 [NASA ADS] [CrossRef] [EDP Sciences] [Google Scholar]
- Stasinska, G. 2006, A&A, 454, 127 [Google Scholar]
- Stasinska, G. 2009, Stellar Populations - planning for the next decade, ed. Bruzual & Charlot, proc. IAU symp., 262 [arXiv:astro-ph/0910.0175] [Google Scholar]
- Stasinska, G., Schaerer, D., & Leitherer, C. 2001, A&A, 370, 1 [Google Scholar]
- Steidel, C. C., Shapley, A. E., Pettini, M., et al. 2004, ApJ, 604, 534 [NASA ADS] [CrossRef] [Google Scholar]
- Stevens, I. R., & Strickland, D. K. 1998a, MNRAS, 294, 523 [NASA ADS] [CrossRef] [Google Scholar]
- Stevens, I. R., & Strickland, D. K. 1998b, MNRAS, 301, 215 [NASA ADS] [CrossRef] [Google Scholar]
- Storchi-Bergmann, T., Calzetti, D., & Kinney, A. L. 1994, ApJ, 429, 572 [NASA ADS] [CrossRef] [Google Scholar]
- Sutherland, R. S., & Dopita, M. A. 1993, ApJS, 88, 253 [NASA ADS] [CrossRef] [Google Scholar]
- Taylor, C. L., Brinks, E., & Skillman, E. D. 1993, AJ, 105, 128 [NASA ADS] [CrossRef] [Google Scholar]
- Taylor, C., Brinks, E., Grashuis, R. M., & Skillman, E. D. 1995, ApJS, 99, 427 [NASA ADS] [CrossRef] [Google Scholar]
- Taylor, C., Thomas, D., Brinks, E., & Skillman, E. D. 1996, ApJS, 107, 143 [NASA ADS] [CrossRef] [Google Scholar]
- Taylor, C. L., Kobulnicky, H. A., & Skillman, E. D. 1998, AJ, 116, 2746 [NASA ADS] [CrossRef] [Google Scholar]
- Telles, E., & Terlevich, R. J. 1995, MNRAS, 275, 1 [NASA ADS] [CrossRef] [Google Scholar]
- Telles, E., & Maddox, S. 2000, MNRAS, 311, 307 [NASA ADS] [CrossRef] [Google Scholar]
- Temporin, S., Weinberg, R., Galaz, G., & Kerber, F. 2003, ApJ, 587, 660 [NASA ADS] [CrossRef] [Google Scholar]
- Temporin, S., Staveley-Smith, L., & Florian, K. 2005, MNRAS, 356, 343 [NASA ADS] [CrossRef] [Google Scholar]
- Tenorio-Tagle, G., Muñoz-Tuñón, C., Pérez, E., Silich, S., & Telles, E. 2006, ApJ, 643, 186 [NASA ADS] [CrossRef] [Google Scholar]
- Teplitz, H. I., Malkan, M. A., Steidel, C. C., et al. 2000, ApJ, 542, 18 [NASA ADS] [CrossRef] [Google Scholar]
- Thilker, D. A., Bianchi, L., Boissier, S., et al. 2005, ApJ, 619, L79 [NASA ADS] [CrossRef] [Google Scholar]
- Thilker, D. A., Bianchi, L., Meurer, G., et al. 2007, ApJS, 173, 538 [NASA ADS] [CrossRef] [Google Scholar]
- Thuan, T. X. 1991, in Massive stars in starbursts, ed. C. Leitherer, N. R. Walborn, T. M. Heckman, & C. A. Norman (Cambridge: Cambridge University Press), 183 [Google Scholar]
- Thuan, T. X., Lipovetski, V. A., Martin, J.-M., & Pustilnik, S. A. 1999, A&ASS, 139, 1 [NASA ADS] [CrossRef] [EDP Sciences] [Google Scholar]
- Tissera, P. B., De Rossi, M. E., & Scannapieco, C. 2005, MNRAS, 364, L38 [NASA ADS] [CrossRef] [Google Scholar]
- Torres-Peimbert, S., Peimbert, M., & Fierro, J. 1989, ApJ, 345, 186 [NASA ADS] [CrossRef] [Google Scholar]
- Tremonti, C. A., Heckman, T. M., Kauffmann, G., et al. 2004, ApJ, 613, 898 [NASA ADS] [CrossRef] [Google Scholar]
- van Eymeren, J., Bomans, D. J., Weis, K., & Dettmar, R.-J. 2007, A&A, 474, 67 [NASA ADS] [CrossRef] [EDP Sciences] [Google Scholar]
- van Eymeren, J., Marcelin, M., Koribalski, B. S., et al. 2009, A&A, 505, 105 [NASA ADS] [CrossRef] [EDP Sciences] [Google Scholar]
- van Eymeren, J., Koribalski, B. S., López-Sánchez, Á. R., Dettmar, R.-J. & Bomans, D. J. 2010, A&A, submitted [Google Scholar]
- van Zee, L., & Haynes, M. P. 2006, ApJ, 636, 214 [NASA ADS] [CrossRef] [Google Scholar]
- van Zee, L., Salzer, J. J., & Haynes, M. P. 1998, ApJ, 497, 1 [Google Scholar]
- van Zee, L., Salzer, J. J., & Skillman, E. D. 2001, AJ, 122, 121 [NASA ADS] [CrossRef] [Google Scholar]
- Vázquez, G. A., & Leitherer, C. 2005, ApJ, 621, 695 [NASA ADS] [CrossRef] [Google Scholar]
- Verma, A., Lutz, D., Sturm, E., et al. 2003, A&A, 403, 829 [NASA ADS] [CrossRef] [EDP Sciences] [Google Scholar]
- Verdes-Montenegro, L., Yun, M. S., Williams, B. A., et al. 2001, A&A, 377, 812 [NASA ADS] [CrossRef] [EDP Sciences] [Google Scholar]
- Verdes-Montenegro, L., del Olmo, A., Iglesias-Páramo, J. I., et al. 2002, A&A, 396, 815 [NASA ADS] [CrossRef] [EDP Sciences] [Google Scholar]
- Verdes-Montenegro, L., del Olmo, A., Yun, M. S., & Perea, J. 2005, A&A, 430, 443 [NASA ADS] [CrossRef] [EDP Sciences] [Google Scholar]
- Vila-Costas, M. B., & Edmunds, M. G. 1993, MNRAS, 259, 121 [Google Scholar]
- Vila-Costas, M. B., & Edmunds, M. G. 1993, MNRAS, 265, 199 [NASA ADS] [CrossRef] [Google Scholar]
- Vílchez, J. M., & Esteban, C. 1996, MNRAS, 280, 720 [NASA ADS] [CrossRef] [Google Scholar]
- Walter, F., Brinks, E., de Blok, W. J. G., et al. 2008, AJ, 136, 2563 [NASA ADS] [CrossRef] [Google Scholar]
- Warren, B. E., Jerjen, H., & Koribalski, B. S. 2004, AJ, 128, 1152 [NASA ADS] [CrossRef] [Google Scholar]
- Warren, B. E., Jerjen, H., & Koribalski, B. S. 2006, AJ, 131, 2056 [NASA ADS] [CrossRef] [Google Scholar]
- Warren, B. E., Jerjen, H., & Koribalski, B. S. 2007, AJ, 134, 1849 [NASA ADS] [CrossRef] [Google Scholar]
- Weilbacher, P. M., Duc, P. A., & Fritze-von Alvensleben, U. 2003, A&A, 397, 545 [NASA ADS] [CrossRef] [EDP Sciences] [Google Scholar]
- Werk, J. K., Jangren, A., & Salzer, J. J. 2004, ApJ, 617, 1004 [NASA ADS] [CrossRef] [Google Scholar]
- Westmeier, T., Braun, R., & Koribalski, B. S. 2010, MNRAS, accepted, [1009.0317] [Google Scholar]
- White, S. D. M., & Frenk, C. S. 1991, ApJ, 379, 52 [NASA ADS] [CrossRef] [Google Scholar]
- Wilcots, E. M., Lehman, C., & Miller, B. 1996, AJ, 111, 1575 [NASA ADS] [CrossRef] [Google Scholar]
- Wilson, C. D. 1995, ApJ, 448, 97 [Google Scholar]
- Woosley, S. E., & Weaver, T. A. 1995, ApJS, 101, 181 [NASA ADS] [CrossRef] [Google Scholar]
- Wyse, R. F. G., & Silk, J. 1985, ApJ, 296, L1 [NASA ADS] [CrossRef] [Google Scholar]
- Yin, S. Y., Liang, Y. C., Hammer, F., et al. 2007, A&A, 462, 535 [NASA ADS] [CrossRef] [EDP Sciences] [Google Scholar]
- Yun, M. S., Ho, P. T. P., & Lo, K. Y. 1994, Nature, 372, 530 [NASA ADS] [CrossRef] [PubMed] [Google Scholar]
- Yun, M. S., Reddy, N. A., & Condon, J. J. 2001, ApJ, 554, 803 [NASA ADS] [CrossRef] [Google Scholar]
- York, D. G., Adelman, J., Anderson, J. E., Jr., et al. 2000, AJ, 120, 1579 [Google Scholar]
- Zaritsky, D., Kennicutt, R. C. Jr., & Huchra, J. P. 1994, ApJ, 420, 87 [NASA ADS] [CrossRef] [Google Scholar]
- Zasov, A. V., Kniazev, A. Y., Pustilnik, S. A., et al. 2000, A&AS, 144, 429 [Google Scholar]
Footnotes
- ...
SBS 0926+606 B
![[*]](/icons/foot_motif.png)
- As pointed out before, the FUV emission observed in SBS 0926+606 B is much more extended than the H
emission, so
the derived S FR is more than one order of magnitude higher when using the FUV than with the H
emission.
- ...
abundance
- As we concluded in Paper IV, this calibration provides
the best results to the oxygen abundances derived for our galaxies,
which were mainly computed following the direct
method.
All Tables
Table 1: Radio data compiled from the literature for our WR galaxy sample.
Table 2: FIR and FUV data for the WR galaxy sample analyzed in this work.
Table 3: X-ray data available for our WR galaxy sample.
Table 4:
FUV, U, B, H![]() ,
H, FIR, 15
,
H, FIR, 15 ![]() m, 60
m, 60 ![]() m,
and 1.4 GHz luminosities for all galaxies analyzed in this
work.
m,
and 1.4 GHz luminosities for all galaxies analyzed in this
work.
Table 5:
S FR values (in units of ![]() yr-1)
derived for each galaxy using different luminosities and calibrations.
yr-1)
derived for each galaxy using different luminosities and calibrations.
Table 6: Additional FIR and radio properties.
Table 7:
Keplerian mass (
![]() ), dynamical mass (
), dynamical mass (
![]() ), neutral gas mass (
), neutral gas mass (
![]() ), ionized gas mass (
), ionized gas mass (
![]() ), warm dust mass (
), warm dust mass (
![]() ), mass of the ionizing star
cluster (
), mass of the ionizing star
cluster (![]() ),
total stellar mass (
),
total stellar mass (
![]() ), and baryonic mass (
), and baryonic mass (
![]() )
of the galaxies analyzed in this work.
)
of the galaxies analyzed in this work.
Table 8: Mass-to-light ratios of all mass estimations compiled in Table 7.
Table 9: Interaction features in our WR galaxy sample.
All Figures
|
|
Figure 1: Example of GALEX images, showing the FUV emission in HCG 31, Haro 15 and SBS 0926+606. Regions within each object have been labeled following the notation given in Paper I. |
| Open with DEXTER | |
| In the text | |
|
|
Figure 2:
Comparison between the H |
| Open with DEXTER | |
| In the text | |
|
|
Figure 3:
Comparison between the H |
| Open with DEXTER | |
| In the text | |
|
|
Figure 4: Assumed S FR vs. B-luminosity (left panel) and U-luminosity (right panel) for the analyzed galaxies. Luminosities are plotted in solar units. The best fit (in logarithm scale) to our data is plotted with a continuous red line. The previous calibration given by Gallagher et al. (1984) between the S FR and the B-luminosity is shown by a discontinuous green line. |
| Open with DEXTER | |
| In the text | |
|
|
Figure 5: S FR vs. 12+log(O/H) (left) and S FR/LB vs. 12+log(O/H) (right) for our sample of WR galaxies. The red-dotted line indicates a fit to our data. Green diamonds in the left panel plot the average value obtained in the low, intermediate, and high-metallicity regimes. |
| Open with DEXTER | |
| In the text | |
|
|
Figure 6:
X-ray luminosity in the 0.2-2.0 keV range vs. FIR luminosity
for the sample of WR galaxies analyzed by Stevens &
Strickland (1998a,b).
The red continuous line is the best fit to the data, excluding the
values for NGC 5253 and NGC 5408. The green
discontinuous line is the relation obtained using the S FR- |
| Open with DEXTER | |
| In the text | |
|
|
Figure 7:
1.4 GHz radio-continuum luminosity vs. the 60 |
| Open with DEXTER | |
| In the text | |
|
|
Figure 8:
Comparison of the B-luminosity (in solar units) and
the logarithmic nonthermal to thermal ratio, |
| Open with DEXTER | |
| In the text | |
|
|
Figure 9:
Ionized gas mass (
|
| Open with DEXTER | |
| In the text | |
|
|
Figure 10:
Dynamical mass (
|
| Open with DEXTER | |
| In the text | |
|
|
Figure 11:
Keplerian mass (
|
| Open with DEXTER | |
| In the text | |
|
|
Figure 12:
Comparison between the baryonic mass (
|
| Open with DEXTER | |
| In the text | |
|
|
Figure 13:
Relation between |
| Open with DEXTER | |
| In the text | |
|
|
Figure 14:
Relation between |
| Open with DEXTER | |
| In the text | |
|
|
Figure 15:
Relation between the S FR/area and the
H I gas density for our
galaxy sample. We show two values per galaxy, one assuming the H |
| Open with DEXTER | |
| In the text | |
|
|
Figure 16: Comparison between the stellar mass and some mass-to-light ratios for our sample galaxies. |
| Open with DEXTER | |
| In the text | |
|
|
Figure 17:
Comparison of the
|
| Open with DEXTER | |
| In the text | |
|
|
Figure 18:
Relation between the |
| Open with DEXTER | |
| In the text | |
|
|
Figure 19:
Reddening coefficient, c(H |
| Open with DEXTER | |
| In the text | |
|
|
Figure 20:
Dust-to-gas ratio,
|
| Open with DEXTER | |
| In the text | |
|
|
Figure 21:
(Left panel) Comparison of the observed oxygen
abundance and the one predicted by simple closed-box chemical evolution
models with instantaneous recycling and constant S FRs.
The continuous green line indicates the expected trend if the galaxies
are closed boxes with an oxygen yield
|
| Open with DEXTER | |
| In the text | |
Copyright ESO 2010
Current usage metrics show cumulative count of Article Views (full-text article views including HTML views, PDF and ePub downloads, according to the available data) and Abstracts Views on Vision4Press platform.
Data correspond to usage on the plateform after 2015. The current usage metrics is available 48-96 hours after online publication and is updated daily on week days.
Initial download of the metrics may take a while.