| Issue |
A&A
Volume 521, October 2010
|
|
|---|---|---|
| Article Number | A26 | |
| Number of page(s) | 9 | |
| Section | Galactic structure, stellar clusters, and populations | |
| DOI | https://doi.org/10.1051/0004-6361/200912937 | |
| Published online | 15 October 2010 | |
Spectral classification and distance
determination of stars in nine southern Galactic H II
regions![[*]](/icons/foot_motif.png) (Research Note)
(Research Note)
M. C. Pinheiro - M. V. F. Copetti - V. A. Oliveira
Laboratório de Análise Numérica e Astrofísica, Departamento de Matemática e Programa de Pós-Graduação em Física, Universidade Federal de Santa Maria, 97119-900 Santa Maria, RS, Brazil
Received 20 July 2009 / Accepted 15 March
2010
Abstract
Aims. We attempt to identify the ionising stars and
to determine the photometric distances of nine southern Galactic H II
regions.
Methods. We carried out optical spectroscopy and UBV
photometry of the stellar content of these objects. The distance of
individual stars were obtained by spectroscopic parallax. To avoid
using a fixed value for the total-to-selective extinction ratio RV,
the reddening AV
was determined directly by the colour-difference approach by comparing
our V apparent magnitudes and the JHK
magnitudes from the 2MASS survey with the intrinsic colour indices.
Results. As types O or B, we classified 24 of the 31
stars for which optical spectra were obtained. In particular, we
identified two new O stars, one in RCW 98 and the
other in RCW 99. The values of reddening obtained
correspond to a mean
![]() ,
which is about 10% higher than the value found for field stars. For
three of the H II regions studied
(Bran 186, NGC 2626, and
RCW 32), the distance estimates (with errors from
25% to 50%) were based on the data obtained for only one star. For the
other six objects (NGC 3503,
NGC 6334, RCW 55,
RCW 87, RCW 98, and
RCW 99), we obtained more precise photometric
distances (with a mean error of
,
which is about 10% higher than the value found for field stars. For
three of the H II regions studied
(Bran 186, NGC 2626, and
RCW 32), the distance estimates (with errors from
25% to 50%) were based on the data obtained for only one star. For the
other six objects (NGC 3503,
NGC 6334, RCW 55,
RCW 87, RCW 98, and
RCW 99), we obtained more precise photometric
distances (with a mean error of ![]() 18%) calculated to be the
median of the parallax distances obtained for two to six different
stars in each nebulae. The parallax distances of individual stars
belonging to a given nebula were similar to each other, with internal
errors smaller than 5%, as a consequence of the method used to derive
the reddening correction AV.
The distance of
18%) calculated to be the
median of the parallax distances obtained for two to six different
stars in each nebulae. The parallax distances of individual stars
belonging to a given nebula were similar to each other, with internal
errors smaller than 5%, as a consequence of the method used to derive
the reddening correction AV.
The distance of ![]() kpc
obtained for RCW 87 disagrees with the value of
7.6 kpc previously found.
kpc
obtained for RCW 87 disagrees with the value of
7.6 kpc previously found.
Conclusions. The dispersion in individual distance
estimates for stars in a given nebula can be significantly reduced by
calculating the reddening AV
from a comparison between the V and the 2MASS JHK
magnitudes instead of using
AV=RV
E(B-V) with a
fixed value for RV.
Therefore, more precise distances can be calculated with our proposed
method.
Key words: H II regions - stars: early-type - stars: distances
1 Introduction
Several photometric and spectroscopic optical studies of the stellar content of Galactic H II regions have been published (Russeil et al. 2007, and references therein). The ionising stellar associations obscured by interstellar extinction have been intensively studied by observations in the infrared (Borissova et al. 2006). These works have been instrumental in identifying and characterizing the ionising stars, determinations of distance and age of the clusters, defining the spiral structure of the Milky Way, and, indirectly, to estimate the Galactic gradients of chemical abundances. However, the optical studies of relatively small H II regions, ionised by groups of a few stars, remain far from complete. Even the nature of some of these emission nebulae remain unclear or unconfirmed. Some of these objects have even been reclassified (,,), but there are several objects with unverified, uncertain or even with no distance determination or classification. In this paper, we present a study of stars in nine southern Galactic H II regions with discrepant or unknown distance estimates. We performed UBV photometry and optical spectroscopy of these stars to determine their distances using the spectroscopic parallax method and, consequently, the distances of the host nebulae.
2 Observations
Direct images in the UBV bands were obtained with
the 0.6 m telescope at the Observatório do Pico dos Dias
(OPD), Brazil. To avoid the saturation of the brightest stars, multiple
exposures were taken in each filter. Five dome flat-fields for each
filter and 15 bias exposures were taken at both the beginning and the
end of each night. Images of standard star fields indicated by Landolt (1992) were taken
to enable a photometric calibration to be performed. Secondary standard
stars catalogued by Galadí-Enríquez
et al. (2000) were also used. Table 1
presents the journal of photometric observations. The CCD image
field-of-view was
![]() .
The typical seeing ranged from 1
.
The typical seeing ranged from 1
![]() 5 to 2
5 to 2
![]() 0. The reduction followed the
standard procedures for stellar CCD photometry in relatively crowed
fields and was performed with IRAF. We limited the UBV
photometry to stars with
0. The reduction followed the
standard procedures for stellar CCD photometry in relatively crowed
fields and was performed with IRAF. We limited the UBV
photometry to stars with ![]() .
Based on the colour-colour and colour-magnitude diagrams, early-type
star candidates with
.
Based on the colour-colour and colour-magnitude diagrams, early-type
star candidates with ![]() were selected for the spectroscopic follow-up observations. For the
stars within
were selected for the spectroscopic follow-up observations. For the
stars within ![]() ,
we observed photometric errors of
,
we observed photometric errors of
![]() ,
,
![]() ,
and
,
and ![]() .
.
Long-slit spectrophotometric observations were carried out
with the Cassegrain spectrograph attached to the 1.6 m and the
0.6 m telescopes at OPD. Table 2
presents the journal of the spectroscopic observations. A Marconi CCD
of ![]() pixelswas
used. The spectra covered the range of 4000 to 4900 Å, classically used
for spectral classification of OB stars, with signal-to-noise ratios
ranging from 70 to 400, with a mean value of about 200. The observation
routine followed the usual procedures. Around 15 bias frames and 5 dome
flat-fields were taken at the beginning and the end of each night.
Spectra of a He-Ar lamp were taken before and after each object
exposure to perform the wavelength calibration. The standard reduction
procedure was completed with IRAF. We used the splot
routine to normalise the continuum of the spectra to unity and to
perform spectral line measurements. In each nebula, in general we
observed three or four of the hottest and brightest early-type star
candidates indicated by the UBV photometry. Since
we used a long slit of
pixelswas
used. The spectra covered the range of 4000 to 4900 Å, classically used
for spectral classification of OB stars, with signal-to-noise ratios
ranging from 70 to 400, with a mean value of about 200. The observation
routine followed the usual procedures. Around 15 bias frames and 5 dome
flat-fields were taken at the beginning and the end of each night.
Spectra of a He-Ar lamp were taken before and after each object
exposure to perform the wavelength calibration. The standard reduction
procedure was completed with IRAF. We used the splot
routine to normalise the continuum of the spectra to unity and to
perform spectral line measurements. In each nebula, in general we
observed three or four of the hottest and brightest early-type star
candidates indicated by the UBV photometry. Since
we used a long slit of
![]() ,
some secondary candidates could be observed simultaneously with the
primary targets. Although we could not spectroscopically observe all
candidates, the chances of missing the dominant ionising stars is low
since these stars should be able to be distinguished from the
relatively cool stars, unless they are hidden by local dust lanes.
,
some secondary candidates could be observed simultaneously with the
primary targets. Although we could not spectroscopically observe all
candidates, the chances of missing the dominant ionising stars is low
since these stars should be able to be distinguished from the
relatively cool stars, unless they are hidden by local dust lanes.
3 Methods
3.1 Spectral classification
The spectra of OB stars are easily identified by the presence
of He I absorption lines. The presence of
He II absorption line is indicative of O
stars. These were the primary criteria used to classify the stars
studied here. We measured the equivalent widths of strong absorption
lines of the He I, He II,
and Balmer series to compare them with the values compiled by Jaschek &
Jaschek (1990) and reduce our search to a few spectral types.
For O stars, the He I
![]() He II
He II
![]() ratio and
the He I
ratio and
the He I
![]() He II
He II
![]() product were
also used in accordance with the prescription by Mathys (1988,1989).
Finally, we refined the spectral classification by comparing with the
digital spectral atlas of Walborn &
Fitzpatrick (1990), observing the specific characteristics of
each spectral subtype individually described by these authors. To
classify late B or cooler stars, we relied solely on the average
spectral type characteristics presented by Jaschek &
Jaschek (1990). The spectra of the observed OB stars are
displayed in Fig. 1.
product were
also used in accordance with the prescription by Mathys (1988,1989).
Finally, we refined the spectral classification by comparing with the
digital spectral atlas of Walborn &
Fitzpatrick (1990), observing the specific characteristics of
each spectral subtype individually described by these authors. To
classify late B or cooler stars, we relied solely on the average
spectral type characteristics presented by Jaschek &
Jaschek (1990). The spectra of the observed OB stars are
displayed in Fig. 1.
3.2 Reddening correction and distance determination
A major source of error in the photometric distances is the reddening
correction, which is often estimated for the V
magnitude from the colour excess E(B
- V) by using a mean value for the
total-to-selective extinction ratio of
![]() (He et al. 1995).
However, the extinction of stars inside star-forming regions can be
anomalous and correspond to different, commonly far higher, values of RV
(,,,). Thus, the use of a ``normal'' value of RV
valid for field stars can introduce large errors into the estimated
distances of H II regions.
(He et al. 1995).
However, the extinction of stars inside star-forming regions can be
anomalous and correspond to different, commonly far higher, values of RV
(,,,). Thus, the use of a ``normal'' value of RV
valid for field stars can introduce large errors into the estimated
distances of H II regions.
In this paper, we chose to evaluate the reddening AV
directly by the colour-difference approach comparing our V
apparent magnitudes and the JHK magnitudes from the
2MASS survey (Cutri
et al. 2003) with the intrinsic colour indices.
Using the least squares method, we fitted the relationship
| (1) |
where
The extinction law is approximately described by a power law
with a fixed exponent ![]() .
However, Fitzpatrick
& Massa (2009) argued that there may not be a
universal law for the extinction curve, which should depend instead on
the sight line. The power law approximation would remain valid, but
would different values of
.
However, Fitzpatrick
& Massa (2009) argued that there may not be a
universal law for the extinction curve, which should depend instead on
the sight line. The power law approximation would remain valid, but
would different values of ![]() for different sight lines (and wavelength ranges). Based on the
dispersion of
for different sight lines (and wavelength ranges). Based on the
dispersion of ![]() 20%
in the values of
20%
in the values of ![]() fitted by Fitzpatrick
& Massa (2009), we found that the usual adoption of a
extinction curve with a fixed exponent would cause errors in distance
of
fitted by Fitzpatrick
& Massa (2009), we found that the usual adoption of a
extinction curve with a fixed exponent would cause errors in distance
of ![]() 15%.
15%.
The heliocentric photometric distance d
was calculated adopting the calibration of the absolute magnitude MV
as a function of the spectral type and luminosity class given by Russeil (2003). The error
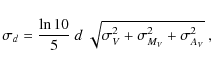
in distance was estimated to be
|
(2) |
where
4 Results and discussions
Table 3 presents the results of our spectroscopic and photometric studies of individual stars. Columns 1-3 provide the identifications of the stars studied in this paper, in the 2MASS survey, and in the Simbad database, respectively. Columns 4 and 5 indicate the stellar spectral classifications from this paper and from the literature, respectively. Columns 7 to 12 show the observed V magnitude and (B - V) colour, the colour excess E(B - V), the calculated reddening AV, the total-to-selective extinction ratio RV, and the corresponding heliocentric photometric distance d, respectively.
Table 4
indicates the photometric distance of each H II
region studied, which corresponds to the median of the values obtained
for n individual stars. For those objects in which
more than one star was studied, the error estimates correspond to
![]() ,
where
,
where ![]() is the error in the distance for each star. These errors are in the
range of 13% to 50%, and are about 15% for the objects with three or
more stars studied. The standard deviations in the distances measured
for different stars in a given nebula are much smaller, varying from 1%
to 13%, but are unrealistic error bounds, serving only to assess the
internal consistency of the distance determinations of individual
stars, because systematic errors are not taken into account.
is the error in the distance for each star. These errors are in the
range of 13% to 50%, and are about 15% for the objects with three or
more stars studied. The standard deviations in the distances measured
for different stars in a given nebula are much smaller, varying from 1%
to 13%, but are unrealistic error bounds, serving only to assess the
internal consistency of the distance determinations of individual
stars, because systematic errors are not taken into account.
Table 4: Heliocentric distances for the studied H II regions.
To test the completeness of the sample of ionising stars
identified in each nebula, we indicate and compare in Table 5, the H![]() extinction data for both the nebulae and the stars, i.e., C(H
extinction data for both the nebulae and the stars, i.e., C(H![]() ), and for
the Lyman continuum photon flux,
), and for
the Lyman continuum photon flux, ![]() .
Columns 3-5 provide the values of C(H
.
Columns 3-5 provide the values of C(H![]() )
calculated from the stellar photometry, which are given by
)
calculated from the stellar photometry, which are given by
![]() ,
from the nebular H
,
from the nebular H![]() /H
/H![]() line ratio, and from the ratio of the radio continuum flux density to
the H
line ratio, and from the ratio of the radio continuum flux density to
the H![]() flux, respectively. Columns 6-8 provide the values of
flux, respectively. Columns 6-8 provide the values of ![]() obtained from the summed ionising photon rates of individual stars,
from the observed H
obtained from the summed ionising photon rates of individual stars,
from the observed H![]() line fluxes, and from the radio continuum flux densities at 2.7 GHz (Paladini et al.
2003), respectively. We adopted the values of
line fluxes, and from the radio continuum flux densities at 2.7 GHz (Paladini et al.
2003), respectively. We adopted the values of ![]() found by Schaerer
& de Koter (1997) for stars of different spectral
types. The integrated H
found by Schaerer
& de Koter (1997) for stars of different spectral
types. The integrated H![]() line fluxes from Copetti (2000)
were adopted for all objects apart from Bran 186,
for which the extrapolation given by Acker et al. (1991)
was used. As an additional compatibility test between the nebular and
stellar properties, Table 5 also
compares the various spectral types of the identified ionising stars
and the emission line ratio [O III]
line fluxes from Copetti (2000)
were adopted for all objects apart from Bran 186,
for which the extrapolation given by Acker et al. (1991)
was used. As an additional compatibility test between the nebular and
stellar properties, Table 5 also
compares the various spectral types of the identified ionising stars
and the emission line ratio [O III]
![]() /H
/H![]() ,
which roughly assesses the degree of excitation of the nebula. With the
exception of one object, RCW 87, the identified
ionising stars are capable of maintaining the ionisation of their
respective nebulae. The line ratios [O III]
,
which roughly assesses the degree of excitation of the nebula. With the
exception of one object, RCW 87, the identified
ionising stars are capable of maintaining the ionisation of their
respective nebulae. The line ratios [O III]
![]() /H
/H![]() observed are typical of nebulae excited by early B or late O-type
stars. In the following, we comment on some of the objects studied.
observed are typical of nebulae excited by early B or late O-type
stars. In the following, we comment on some of the objects studied.
NGC 6334.
This is a 50NGC 3503.
The main sources of ionisation of this H II region are one B0 V and three B2 V stars found at the centre of the compact open cluster Pismis 17. The distance estimates for these four stars are remarkably similar, with a mean deviation of less than 2%.Bran 186.
This is a 3We found that the B0 V star Bran 186-3 is
the ionisation source of Bran 186. A star of this
spectral type is compatible with the inferred ionising photon rate and
the low degree of excitation of the nebula. In our nebular spectra, we
measured [O III]![]() 4959/H
4959/H
![]() and found no helium emission
lines, indicating that most of the oxygen
is single ionised and the helium is almost neutral.
and found no helium emission
lines, indicating that most of the oxygen
is single ionised and the helium is almost neutral.
NGC 2626.
This is a bright reflection nebula located at the southwest edge of the large (RCW 55.
We classified one star as O8 V and another six stars as type B. Although the distance estimates for these seven stars are, within the errors, compatible to one another, we may be tempted to consider that there are two superimposed stellar groups, one atIn Table 5,
we see that the total rate of ionising photon from the identified stars
is much higher (by two orders of magnitude) than that needed to
maintain the ionisation of the nebula. This discrepancy may be caused
by a massive leakage of Lyman continuum radiation from the nebula or
else by an underestimation of the ionising luminosity required. The H![]() emission line flux used in this calculation was measured in a circular
aperture with 1
emission line flux used in this calculation was measured in a circular
aperture with 1![]() 40
40
![]() of
diameter centred on the star RCW 55-7, located in
the middle of the bright core of the nebula, while fainter emission
extends across a diameter of about 10
of
diameter centred on the star RCW 55-7, located in
the middle of the bright core of the nebula, while fainter emission
extends across a diameter of about 10![]() .
However, a rough extrapolation of the ionising photon flux to the whole
nebula based on an image from the AAO/UKST H
.
However, a rough extrapolation of the ionising photon flux to the whole
nebula based on an image from the AAO/UKST H![]() survey (Parker
et al. 2005) still indicates a value lower (by an
order of magnitude) than that from the stars. It is possible than some
of the hot stars identified towards RCW 55 are not
ionising the nebula, even though they belong to the same stellar
association. It is noticeable that the bright nebular core surrounds
the B1 V stars RCW 55-3 and
RCW 55-7 and not the O8 V star
RCW 55-4, the hottest star towards
RCW 55. These two B1-type stars are capable of
providing the needed ionising radiation.
survey (Parker
et al. 2005) still indicates a value lower (by an
order of magnitude) than that from the stars. It is possible than some
of the hot stars identified towards RCW 55 are not
ionising the nebula, even though they belong to the same stellar
association. It is noticeable that the bright nebular core surrounds
the B1 V stars RCW 55-3 and
RCW 55-7 and not the O8 V star
RCW 55-4, the hottest star towards
RCW 55. These two B1-type stars are capable of
providing the needed ionising radiation.
RCW 87.
We classified two 11th magnitude stars as B4 V and B9 III. According to Table 5, these stars are not the main ionising stars of this nebula. Neither of them is in the brightest part of the nebula, where only three or more magnitudes fainter stars are found. The mean distance of these two stars isBorissova
et al. (2006) presented a near and mid-infrared
study of the star cluster [BDB2003] G320.15+00.79. Based on
the spectroscopic parallax of the brightest star of this cluster in the
near infrared, which was classified as a K0.5 II type star, these
author determined a distance of 7.6 kpc for RCW 87.
However, using their distance and reddening of AV=10.9
we calculate an ionising photon rate of
![]() ,
which is unrealistically high since it would place
RCW 87 among the brightest H II
regions of the Galaxy and indicate that this object should be more
conspicuous at radio frequencies.
,
which is unrealistically high since it would place
RCW 87 among the brightest H II
regions of the Galaxy and indicate that this object should be more
conspicuous at radio frequencies.
RCW 99.
This is a bright 45 Summary
We carried out spectroscopic and photometric observations of the stellar content of 9 nine southern Galactic H II regions to identify ionising stars and to determine the photometric distances of the nebulae. The distance of individual stars were obtained by spectroscopic parallax. To avoid using a fixed value for the total-to-selective extinction ratio RV, the reddening AV was determined directly by applying the colour-difference approach comparing our V apparent magnitudes with the JHK magnitudes from the 2MASS survey. Our main findings are:
- 1.
- We classified 24 of the 31 stars for which optical spectra were obtained as types O or B. We identified two new O stars: RCW 98-2 (O9.5 V) and RCW 99-1 (O7 III).
- 2.
- For three of the H II regions
studied (Bran 186, NGC 2626, and
RCW 32) the distance estimates (with errors from 25%
to 50%) were based on the data obtained for only one star. For the
other six objects (NGC 3503,
NGC 6334, RCW 55,
RCW 87, RCW 98, and
RCW 99), we obtained more precise photometric
distances (with a mean error of
 18%) calculated to be the
median values of the parallax distances obtained for two to six
different stars in each nebulae.
18%) calculated to be the
median values of the parallax distances obtained for two to six
different stars in each nebulae.
- 3.
- The parallax distances of individual stars belonging to a given nebula were found to be similar to each other, having an internal dispersion of less than 5%. This is a consequence of the method used to derive the distance, which is based on an estimation of the reddening correction AV derived by comparing our V magnitude with the JHK magnitudes from 2MASS, and assumes that the total-to-selective extinction ratio of RV is a free parameter.
- 4.
- The common procedure of adopting a fixed value for RV to calculate AV from the colour excess E(B-V) would have considerably increased the scatter in the distance estimates and should be employed with restraint in the case of star-forming regions.
- 5.
- The mean
 was
about 10% higher than the value found for field stars. Stars
located more centrally in the nebula tend to exhibit higher values of RV.
was
about 10% higher than the value found for field stars. Stars
located more centrally in the nebula tend to exhibit higher values of RV.
- 6.
- For RCW 87, the distance of
 kpc
obtained in this paper disagrees with the photometric distance of 7.6
kpc estimated by Borissova
et al. (2006) based on a near infrared study of a
K0.5 II type star. Additional observations are needed to resolve this
discrepancy.
kpc
obtained in this paper disagrees with the photometric distance of 7.6
kpc estimated by Borissova
et al. (2006) based on a near infrared study of a
K0.5 II type star. Additional observations are needed to resolve this
discrepancy.
This work was supported by the Brazilian agencies CAPES and CNPq. We wish to thank the staff of the Laboratório Nacional de Astrofísica for their assistance during the observations.
References
- Acker, A., Raytchev, B., Stenholm, B., & Tylenda, R. 1991, A&AS, 90, 89 [Google Scholar]
- Acker, A., Marcout, J., Ochsenbein, F., Stenholm, B., & Tylenda, R. 1992, Garching: European Southern Observatory [Google Scholar]
- Avedisova, V. S., & Kondratenko, G. I. 1984, Nauchnye Informatsii, 56, 59 [NASA ADS] [Google Scholar]
- Bica, E., Dutra, C. M., & Barbuy, B. 2003, A&A, 397, 177 [NASA ADS] [CrossRef] [EDP Sciences] [Google Scholar]
- Borissova J., Ivanov V. D., Minitti D., & Geisler D. 2006, A&A, 455, 923 [NASA ADS] [CrossRef] [EDP Sciences] [Google Scholar]
- Brand, J., & Blitz, L. 1993, A&A, 275, 67 [NASA ADS] [Google Scholar]
- Buscombe, W. 1969, MNRAS, 144, 31 [NASA ADS] [Google Scholar]
- Copetti, M. V. F. 2000, A&AS, 147, 93 [Google Scholar]
- Copetti, M. V. F., Oliveira, V. A., Riffel, R., Castañeda, H. O., & Sanmartim, D. 2007, A&A, 472, 847 [NASA ADS] [CrossRef] [EDP Sciences] [Google Scholar]
- Corben, P. M., Carter, B. S., Banfield, R. M., & Harvey, G. M. 1972, MNRAS Afr., 31, 7 [Google Scholar]
- Crampton, D. 1971, AJ, 76, 260 [NASA ADS] [CrossRef] [Google Scholar]
- Crampton, D., & Fisher, W. A. 1974, Publ. Dom. Astrophys. Obs., 14, 283 [Google Scholar]
- Cutri, R. M., et al. 2003, 2MASS All-Sky Point Source Catalog [Google Scholar]
- Denoyelle, J. 1977, A&AS, 27, 343 [Google Scholar]
- Dutra, C. M., Bica, E., Soares, J., & Barbuy, B. 2003, A&A, 400, 533 [NASA ADS] [CrossRef] [EDP Sciences] [Google Scholar]
- Fitzpatrick, E. L., & Massa, D. 2009, ApJ, 699, 1209 [NASA ADS] [CrossRef] [Google Scholar]
- Frew, D. J., Parker, Q. A., & Russeil, D. 2006, MNRAS, 372, 1081 [NASA ADS] [CrossRef] [Google Scholar]
- Gahm, G. F., & Malmort, A. M. 1980, A&A, 82, 295 [NASA ADS] [Google Scholar]
- Galadí-Enríquez, D., Trullols, E., & Jordi C. 2000, A&AS, 146, 169 [Google Scholar]
- Georgelin, Y. P., & Georgelin, Y. M. 1970a, A&A, 6, 349 [NASA ADS] [Google Scholar]
- Georgelin, Y. P., & Georgelin, Y. M. 1970b, A&AS, 3, 1 [NASA ADS] [Google Scholar]
- Georgelin, Y. M., Georgelin, Y. P., & Roux, S. 1973, A&A, 25, 337 [NASA ADS] [Google Scholar]
- He, L., Whittet, D. C. B., KilKenny, D., & Spencer Jones, J. H. 1995, ApJS, 101, 335 [NASA ADS] [CrossRef] [Google Scholar]
- Herbst, W. 1975, AJ, 80, 212 [NASA ADS] [CrossRef] [Google Scholar]
- Holmberg, E. B., Lauberts, A., Schuster, H.-E., & West, R. M. 1978, A&AS, 31, 15 [Google Scholar]
- Houk, N. 1978, Michigan Catalog of Two-dimensional Spectral Types for the HD stars (Ann Arbor, MI: Dept. of Astronomy, University of Michigan), QB6.H77 [Google Scholar]
- Jaschek, C., & Jaschek, M. 1990, The classification of stars (Cambridge University Press) [Google Scholar]
- Kharchenko, N. V., Piskunov, A. E., Roeser, S., Schilbach, E., & Scholz R.-D. 2005, A&A, 438, 1163 [NASA ADS] [CrossRef] [EDP Sciences] [MathSciNet] [Google Scholar]
- Kohoutek, L. 1971, A&A, 13, 493 [NASA ADS] [Google Scholar]
- Kohoutek, L., & Pauls, R. 1994, Astron. Nachr., 315, 409 [NASA ADS] [CrossRef] [Google Scholar]
- Landolt, A. U. 1992, AJ, 104, 340 [NASA ADS] [CrossRef] [Google Scholar]
- Mathis, J. S. 1990, ARA&A, 28, 37 [NASA ADS] [CrossRef] [Google Scholar]
- Mathys, G. 1988, A&AS, 76, 427 [Google Scholar]
- Mathys, G. 1989, A&AS, 81, 237 [NASA ADS] [Google Scholar]
- Megier, A., Krelowski J., Patriarchi, P., & Aiello, S. 1997, MNRAS, 292, 853 [NASA ADS] [CrossRef] [Google Scholar]
- Moffat, A. F. J., & Vogt, N. 1975, A&AS, 20, 125 [NASA ADS] [Google Scholar]
- Munch, L. 1955, Boletin de los Observatorios Tonantzintla y Tacubaya, 2, 28 [Google Scholar]
- Neckel, T. 1978, A&A, 69, 51 [NASA ADS] [Google Scholar]
- Neckel, Th., & Chini, R. 1981, A&AS, 45, 451 [Google Scholar]
- Paladini, R., Burigana, C., Davies, R. D., et al. 2003, A&A, 397, 213 [NASA ADS] [CrossRef] [EDP Sciences] [Google Scholar]
- Papaj, J., Wegner, W., & Krelowski, J. 1991, MNRAS, 252, 403 [NASA ADS] [CrossRef] [Google Scholar]
- Parker, Q. A., Phillips, S., Pierce, M. J., et al. 2005, MNRAS, 362, 689 [NASA ADS] [CrossRef] [Google Scholar]
- Patriarchi, P., Morbidelli L., Perimotto M., & Barbaro G. 2001, A&A, 372, 644 [NASA ADS] [CrossRef] [EDP Sciences] [Google Scholar]
- Rieke G. H., & Lebofsky M. J. 1985, ApJ, 288, 618 [NASA ADS] [CrossRef] [Google Scholar]
- Russeil, D. 2003, A&A, 397, 133 [NASA ADS] [CrossRef] [EDP Sciences] [Google Scholar]
- Russeil, D., Adami, C., & Georgelin, Y. M. 2007, A&A, 470, 161 [NASA ADS] [CrossRef] [EDP Sciences] [Google Scholar]
- Stock, J. 1984, Rev. Mex. Astron. Astrofis., 9, 127 [NASA ADS] [Google Scholar]
- Stupar, M., Parker, Q. A., & Filipovic, M. D. 2008, MNRAS, 390, 1037 [NASA ADS] [CrossRef] [Google Scholar]
- Schaerer, D., & de Koter, A. 1997, A&A, 322, 598 [NASA ADS] [Google Scholar]
- Vogt, N., & Moffat, A. F. J. 1975, A&A, 45, 405 [NASA ADS] [Google Scholar]
- Walborn N. R. 1982, AJ, 87, 1300 [NASA ADS] [CrossRef] [Google Scholar]
- Walborn N. R., & Fitzpatrick, E. L. 1990, PASP, 102, 379 [NASA ADS] [CrossRef] [Google Scholar]
- Wegner W. 1994, MNRAS, 270, 229 [NASA ADS] [CrossRef] [Google Scholar]
- Yamaguchi, R., Saito, H., Mizuno, N., et al. 1999, PASJ, 51, 791 [NASA ADS] [Google Scholar]
Online Material
![\begin{figure}
\par\includegraphics*[angle=180,width=18cm,clip]{12937fig1.ps}
\end{figure}](/articles/aa/full_html/2010/13/aa12937-09/img55.png)
|
Figure 1: Spectra of the OB stars. |
| Open with DEXTER | |
![\begin{figure}
\par\includegraphics[angle=-90,width=8cm,clip]{12937fig2.ps}
\end{figure}](/articles/aa/full_html/2010/13/aa12937-09/img56.png)
|
Figure 2: The colour-magnitude diagram for RCW 87. The squares correspond to stars towards the embedded star cluster [BDB2003] G320.15+00.79 and the circles to the other stars. Also shown are the main sequence loci corresponding to a distance of 1.23 kpc and two different reddening, AV = 2.3 and AV = 6.8. |
| Open with DEXTER | |
Table 1: Journal for photometric observations.
Table 2: Journal of spectroscopic observations.
Table 3: Spectral classification, photometric data, reddening, and heliocentric distance for individual stars.
Table 5: Comparison between stellar and nebular properties.
Footnotes
- ... regions
- Figures 1, 2 and Tables 1-3, 5 are only available in electronic form at http://www.aanda.org
All Tables
Table 4: Heliocentric distances for the studied H II regions.
Table 1: Journal for photometric observations.
Table 2: Journal of spectroscopic observations.
Table 3: Spectral classification, photometric data, reddening, and heliocentric distance for individual stars.
Table 5: Comparison between stellar and nebular properties.
All Figures
|
|
Figure 1: Spectra of the OB stars. |
| Open with DEXTER | |
| In the text | |
|
|
Figure 2: The colour-magnitude diagram for RCW 87. The squares correspond to stars towards the embedded star cluster [BDB2003] G320.15+00.79 and the circles to the other stars. Also shown are the main sequence loci corresponding to a distance of 1.23 kpc and two different reddening, AV = 2.3 and AV = 6.8. |
| Open with DEXTER | |
| In the text | |
Copyright ESO 2010
Current usage metrics show cumulative count of Article Views (full-text article views including HTML views, PDF and ePub downloads, according to the available data) and Abstracts Views on Vision4Press platform.
Data correspond to usage on the plateform after 2015. The current usage metrics is available 48-96 hours after online publication and is updated daily on week days.
Initial download of the metrics may take a while.