| Issue |
A&A
Volume 520, September-October 2010
|
|
|---|---|---|
| Article Number | A104 | |
| Number of page(s) | 7 | |
| Section | Cosmology (including clusters of galaxies) | |
| DOI | https://doi.org/10.1051/0004-6361/201014912 | |
| Published online | 11 October 2010 | |
Dark energy domination in the Virgocentric flow
A. D. Chernin1,2 - I. D. Karachentsev3 - O. G. Nasonova3 - P. Teerikorpi1 - M. J. Valtonen1 - V. P. Dolgachev2 - L. M. Domozhilova2 - G. G. Byrd4
1 - Tuorla Observatory, Department of Physics and Astronomy, University of Turku, 21500 Piikkiö, Finland
2 - Sternberg Astronomical Institute, Moscow University, Moscow 119899, Russia
3 - Special Astrophysical Observatory, Nizhnii Arkhys 369167, Russia
4 - University of Alabama, Tuscaloosa, AL 35487-0324, USA
Received 3 May 2010 / Accepted 1 June 2010
Abstract
Context. The standard ![]() CDM
cosmological model implies that all celestial bodies are embedded in a
perfectly uniform dark energy background, represented by Einstein's
cosmological constant, and experience its repulsive antigravity action.
CDM
cosmological model implies that all celestial bodies are embedded in a
perfectly uniform dark energy background, represented by Einstein's
cosmological constant, and experience its repulsive antigravity action.
Aims. Can dark energy have strong dynamical effects on small
cosmic scales as well as globally? Continuing our efforts to clarify
this question, we now focus on the Virgo Cluster and the flow of
expansion around it.
Methods. We interpret the Hubble diagram from a new database of
velocities and distances of galaxies in the cluster and its
environment, using a nonlinear analytical model, which incorporates the
antigravity force in terms of Newtonian mechanics. The key parameter is
the zero-gravity radius, the distance at which gravity and antigravity
are in balance.
Results. 1. The interplay between the gravity of the cluster and
the antigravity of the dark energy background determines the
kinematical structure of the system and controls its evolution.
2. The gravity dominates the quasi-stationary bound cluster, while
the antigravity controls the Virgocentric flow, bringing order and
regularity to the flow, which reaches linearity and the global Hubble
rate at distances ![]() Mpc.
3. The cluster and the flow form a system similar to the Local
Group and its outflow. In the velocity-distance diagram, the
cluster-flow structure reproduces the group-flow structure with a
scaling factor of about 10; the zero-gravity radius for the
cluster system is also 10 times larger.
Mpc.
3. The cluster and the flow form a system similar to the Local
Group and its outflow. In the velocity-distance diagram, the
cluster-flow structure reproduces the group-flow structure with a
scaling factor of about 10; the zero-gravity radius for the
cluster system is also 10 times larger.
Conclusions. The phase and dynamical similarity of the systems
on the scales of 1-30 Mpc suggests that a two-component pattern
may be universal for groups and clusters: a quasi-stationary bound
central component and an expanding outflow around it, caused by the
nonlinear gravity-antigravity interplay with the dark energy dominating
in the flow component.
Key words: Local Group - galaxies: clusters: individual: Virgo cluster - dark matter - dark energy
1 Introduction
Early studies of the motion of our Galaxy (reviewed by Huchra 1988) led to the discovery of the peculiar velocity of the Local Group towards the Virgo cluster. To illustrate this, imagine the distance to Virgo to be 17 Mpc and the Hubble constant H0 = 72 km s-1 Mpc-1, then the expected cosmological velocity of the cluster is 1224 km s-1. The observed velocity is about 1000 km s-1. The difference reflects our peculiar velocity of about 220 km s-1 towards Virgo.
This estimate of the retarded expansion (the so-called ``Virgo infall'') views the universal
expansion as existing not only on ``truly cosmological'' scales
![]() Mpc, but also on local
scales of
Mpc, but also on local
scales of ![]() Mpc only weakly disturbed. Observational and theoretical aspects of the Virgo infall were studied e.g. by Silk (1974, 1977), Peebles (1976), Hoffman & Salpeter (1982), Sandage (1986), Teerikorpi et al. (1992), and Ekholm et al. (1999, 2000).
Mpc only weakly disturbed. Observational and theoretical aspects of the Virgo infall were studied e.g. by Silk (1974, 1977), Peebles (1976), Hoffman & Salpeter (1982), Sandage (1986), Teerikorpi et al. (1992), and Ekholm et al. (1999, 2000).
1.1 The Virgocentric flow
The Virgo infall is a particular feature of what is known as the
Virgocentric flow: hundreds of galaxies (our Galaxy among them) are
receeding away from the Virgo cluster. Recent data (Karachentsev &
Nasonova 2010) show that the flow velocities range from
nearly zero around 5-8 Mpc from the cluster center to about 2000 km s-1 at the distances of about 30 Mpc. For
R > 10-15 Mpc, a roughly linear velocity-distance
relation may be seen in the flow, making it resemble the global Hubble
expansion. But strong deviations from the linear relation exist at
smaller distances, not surprisingly: 1) the linear expansion flow,
V = H R, is the property of the universe beyond the cosmic ``cell of uniformity'' (![]() Mpc);
2) the Virgo cluster is a strong local overdensity; 3) the
matter distribution around the cluster is highly nonuniform up to the
distance of about 30 Mpc.
Mpc);
2) the Virgo cluster is a strong local overdensity; 3) the
matter distribution around the cluster is highly nonuniform up to the
distance of about 30 Mpc.
Besides the natural deviations, we have here an example of a paradox realized by Sandage (1986, 1999). He saw a mystery in the fact that the local expansion proceeds in a quite regular way. Moreover, the rate of expansion is similar, if not identical, to the global Hubble constant (Ekholm et al. 2001; Thim et al. 2003; Karachentsev 2005; Karachentsev et al. 2002a, 2003b; Whiting 2003). Originally, the Friedmann theory described the expansion of a smooth, uniform self-gravitating medium. But the linear cosmological expansion was discovered by Hubble where it should not be: in the lumpy environment at distances <20 Mpc.
1.2 The local relevance of dark energy
Soon after the discovery of dark energy (Riess et al. 1998; Perlmutter et al. 1999) on global scales, we suggested (Chernin et al. 2000; Chernin 2001; Baryshev et al. 2001; Karachentsev et al. 2003a;
Chernin et al. 2004; Teerikorpi et al. 2006)
that dark energy with
its omnipresent and uniform density (represented by Einstein's
cosmological constant) may provide the dynamical background for a
regular quiescent expansion on local scales, resolving the
Hubble-Sandage paradox. Our key argument came from the fact that the
antigravity produced by dark
energy is stronger than the gravity of the Local Group at distances
larger than about 1.5 Mpc from the group center![]() .
.
The present paper extends our work from groups to the scale of clusters, focusing on the Virgo cluster.
2 The phase space structure
Recent observations of the Virgo cluster and its vicinity permit a better understanding of the physics behind the visible structure and kinematics of the system.
2.1 The dataset
The most complete list of data on the Virgo Cluster and the Virgocentric flow has been collected by Karachentsev & Nasonova (2010). These include distance moduli of galaxies from the Catalogue of the Neighbouring Galaxies (=CNG, Karachentsev et al. 2005) and also from the literature with the best measurements prefered. Distances from the tip of the red giant branch (TRGB) and the Cepheids are used from the CNG together with new TRGB distances (Karachentsev et al. 2006; Makarov et al. 2006; Mei et al. 2007). For galaxy images in two or more photometric bands obtained with WFPC2 or ACS cameras at the Hubble Space Telescope, the TRGB method yields distances with an accuracy of about 7% (Rizzi et al. 2007). The database includes also data on 300 E and S0 galaxies from the surface brightness fluctuation (SBF) method by Tonry et al. (2000) with a typical distance error of 12%. The total sample contains the velocities and distances of 1371 galaxies within 30 Mpc from the Virgo cluster center. Especially interesting is the sample of 761 galaxies selected to avoid the effect of unknown tangential (to the line of sight) velocity components. The velocity-distance diagram for this sample taken from Karachentsev & Nasonova (2010) is given in Fig. 1.
![\begin{figure}
\par\includegraphics[width=9cm,clip]{14912fig1}
\end{figure}](/articles/aa/full_html/2010/12/aa14912-10/img8.png)
|
Figure 1:
Hubble diagram with Virgocentric velocities and distances for
761 galaxies of the Virgo Cluster and the outflow (Karachentsev
& Nasonova 2010). The two-component pattern is outlined by bold dashed lines. The zero-gravity radius
|
| Open with DEXTER | |
2.2 The zero-velocity radius and the cluster mass
The zero-velocity radius within the retarded expansion field around a
point-like mass concentration
means the distance where the radial velocity relative to the
concentration is zero. In the ideal case of the mass concentration at
rest within the expanding Friedmann universe this is the distance where
the radial peculiar velocity towards the concentration is equal to the
Hubble velocity for the same distance. Using Tully-Fisher distances in
the Hubble diagram, Teerikorpi et al. (1992) could for the first time see the location of the zero-velocity radius R0 for the Virgo system, so that
![]() or
or
![]() Mpc. The work by
Karachentsev & Nasonova (2010) puts the zero-velocity radius at
R0 = 5.0-7.5 Mpc. For R < R0, positive and negative velocities appear in practically equal numbers; for R > R0,
the velocities are positive with a few exceptions likely due to
errors in distances.
The zero-velocity radius gives the upper limit of the size of the
gravitationally bound cluster, and the diagram shows that the
Virgocentric flow starts at
Mpc. The work by
Karachentsev & Nasonova (2010) puts the zero-velocity radius at
R0 = 5.0-7.5 Mpc. For R < R0, positive and negative velocities appear in practically equal numbers; for R > R0,
the velocities are positive with a few exceptions likely due to
errors in distances.
The zero-velocity radius gives the upper limit of the size of the
gravitationally bound cluster, and the diagram shows that the
Virgocentric flow starts at ![]() and extends at least up to 30 Mpc.
and extends at least up to 30 Mpc.
The zero-velocity radius has been often used for estimating the total mass M0 of a gravitationally bound system. According to Lynden-Bell (1981) and Sandage (1986), the spherical model with
![]() leads to the estimator
leads to the estimator

|
(1) |
With the age of the universe
2.3 The Virgo infall
Figure 1 clearly shows the Virgo infall: at distances R > R0, the galaxies are located mostly below the Hubble line
![]() with H = 72 km s-1 Mpc-1 (Spergel et al. 2007). The deviation of the median velocity of the flow
with H = 72 km s-1 Mpc-1 (Spergel et al. 2007). The deviation of the median velocity of the flow ![]() from the Hubble velocity is well seen in the distance range
7-13 Mpc. At larger distances the retardation effect gets
weaker and gradually sinks below the measurement error level.
from the Hubble velocity is well seen in the distance range
7-13 Mpc. At larger distances the retardation effect gets
weaker and gradually sinks below the measurement error level.
For the distance and peculiar velocity of the Milky Way, we take the figures from Karachentsev & Nasonova (2010): the distance to the Virgo cluster 17 Mpc, the recession velocity
1004 ![]() 70 km s-1; with the Hubble constant H = 72 km s-1 Mpc-1 the regular expansion velocity is 1224 km s-1. Then the peculiar velocity directed to the cluster center
70 km s-1; with the Hubble constant H = 72 km s-1 Mpc-1 the regular expansion velocity is 1224 km s-1. Then the peculiar velocity directed to the cluster center
![]()
![]() 70 km s-1 (this agrees with the result based on TF distances and a different ana-lysis by Theureau et al. 1997; a complete velocity field on the scale of 10-20 Mpc is given by Tully et al. 2008).
The effect is not very strong. It is much more instructive,
however, that there are big nonlinear deviations from the linear
velocity-distance law near the cluster: the infall effect is
strongest there.
70 km s-1 (this agrees with the result based on TF distances and a different ana-lysis by Theureau et al. 1997; a complete velocity field on the scale of 10-20 Mpc is given by Tully et al. 2008).
The effect is not very strong. It is much more instructive,
however, that there are big nonlinear deviations from the linear
velocity-distance law near the cluster: the infall effect is
strongest there.
2.4 Two-component phase structure
The Virgo system reveals an obvious two-component structure in Fig. 1:
the cluster and the flow, outlined roughly with bold dashed lines.
As we noted, the positive and negative velocities (from -2000
to +1700 km s-1) are seen in the cluster area in equal numbers, so the component is rather symmetrical to the horizontal line V = 0. The border zone between the components, in the range
6 < R < 12 Mpc,
is poorly populated, and the velocities are considerably less
scattered here, from -400 to +600 km s-1. This
zone contains the zero-velocity radius. The flow component with
positive velocities is at distances >12 Mpc. It is rather
symmetrical to the line V = H R. The velocities are scattered within ![]() km s-1 around the symmetry line.
km s-1 around the symmetry line.
A much lower velocity dispersion is seen in the more accurate data on
75 galaxies with TRGB and Cepheid distances (mostly from CNG)
located from 10 to 25 Mpc from the cluster center. In the
diagram of Fig. 1, the subsample (dots) occupies a strip less than 500 km s-1 wide. They are scattered with the mean dispersion of about 250 km s-1 around the line V = HV R, where
![]() km s-1 Mpc-1. This line is the median line for the subsample.
km s-1 Mpc-1. This line is the median line for the subsample.
2.5 Similarity with the Local system
The two-component phase structure of the Virgo system looks very
similar to that of the Local system (the Local Group and the outflow).
The diagram of Fig. 2 (Karachentsev et al. 2009)
is based on the most complete and accurate data obtained with the TRGB
method using the HST. The velocities within the Local Group range from
-150 to +160 km s-1, about 10 times less than
the velocity spread in the Virgo cluster. The zone between the two
components of the Local system is in the range 0.7-1.2 Mpc, also
10 times less than in Fig. 1. The local flow has a dispersion of about 30 km s-1 around the line V = HL R, where
![]() km s-1 Mpc-1.
This line defines the median for the local flow. The dispersion is
about 10 times less than in the Vigocentric flow for the subsample
of the accurate distances. The local phase diagram of Fig. 2,
if zoomed by a factor of 10, would roughly reproduce the
phase structure of the Virgo system. We will see that the phase
similarity is also supported by the
dynamical similarity.
km s-1 Mpc-1.
This line defines the median for the local flow. The dispersion is
about 10 times less than in the Vigocentric flow for the subsample
of the accurate distances. The local phase diagram of Fig. 2,
if zoomed by a factor of 10, would roughly reproduce the
phase structure of the Virgo system. We will see that the phase
similarity is also supported by the
dynamical similarity.
![\begin{figure}
\par\includegraphics[width=9cm,clip]{14912fig2}
\end{figure}](/articles/aa/full_html/2010/12/aa14912-10/img28.png)
|
Figure 2:
Hubble diagram for 57 galaxies of the Local Group and the local flow (Karachentsev et al. 2009). The thin line indicates the zero-velocity radius
R0 = 0.7-0.9 Mpc. The two-component phase
structure is outlined by the bold dashed line. Zoomed in about
10 times, the group-scale structure well reproduces the
cluster-scale structure (Fig. 1). The zero-gravity radius
|
| Open with DEXTER | |
3 Gravity-antigravity interplay
Dark energy is a form of cosmic energy that produces antigravity and
causes the global cosmological acceleration discovered by Riess
et al. (1998) and Perlmutter et al. (1999)
in observations of SNe type Ia at horizon-size distances of about
1000 Mpc. These and other observations, especially the cosmic
microwave background (CMB) anisotropies (Spergel et al. 2007), indicate that the global dark energy density,
![]()
![]() 10-29 g cm-3, makes up nearly 3/4 of the total energy of the universe.
10-29 g cm-3, makes up nearly 3/4 of the total energy of the universe.
3.1 Antigravity in Newtonian description
According to the simplest, most straightforward and quite likely view adopted in the ![]() CDM cosmology, dark energy is represented by Einstein's cosmological constant
CDM cosmology, dark energy is represented by Einstein's cosmological constant ![]() ,
so that
,
so that
![]() .
If so, then dark energy is the energy of the cosmic vacuum (Gliner 1965) and is described macroscopically as a perfectly uniform fluid with the equation of state
.
If so, then dark energy is the energy of the cosmic vacuum (Gliner 1965) and is described macroscopically as a perfectly uniform fluid with the equation of state
![]() (here pV is the dark energy pressure; c = 1). This interpretation implies that dark energy exists everywhere in space with the same density and pressure.
(here pV is the dark energy pressure; c = 1). This interpretation implies that dark energy exists everywhere in space with the same density and pressure.
Local dynamical effects of dark energy have been studied by Chernin et al. (2000, 2009), Chernin (2001), Baryshev et al. (2001), Karachentsev et al. (2003a), Byrd et al. (2007), and Teerikorpi et al. (2008).
For the Local Group and the outflow close to it, we showed that
the antigravity produced by the dark energy background exceeds the
gravity of the group at distances beyond
![]() Mpc from the group barycenter. Similar results were obtained for the nearby
M 81 and Cen A groups (Chernin et al. 2007a,b).
Mpc from the group barycenter. Similar results were obtained for the nearby
M 81 and Cen A groups (Chernin et al. 2007a,b).
Extending now our approach to the cluster scale, we consider the Virgo system (the cluster and the flow) embedded in the uniform dark energy background. We describe the system - in the first approximation - in a framework of a spherical model (Silk 1974, 1977; Peebles 1976) where the cluster is considered as a spherical gravitationally bound quasi-stationary system. The galaxy distribution in the flow is represented by a continuous dust-like (pressureless) matter. The flow is expanding, and it is assumed that the concentric shells of matter do not intersect each other in their motion (the mass within each shell keeps constant).
Because the velocities in the cluster and the flow are much
less than the speed of light, we may analyze the dynamics of the
cluster-flow system in terms of Newtonian forces. A spherical
shell with a Lagrangian coordinate r and a Eulerian distance R(r,t)
from the cluster center is affected by the gravitation of the cluster
and the flow galaxies within the sphere of the radius R(r,t). According to the Newtonian gravity law, the shell experiences an acceleration
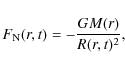
|
(2) |
in the reference frame related to the cluster center. Here M(r) is the total mass within the radius R(r,t).
The flow is also affected by the repulsion produced by the local dark energy. The resulting
acceleration in Newtonian terms is given by the ``Einstein antigravity law'':
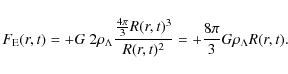
|
(3) |
Here
3.2 Zero-gravity radius in the point-mass approximation
The equation of motion of an individual shell has the form
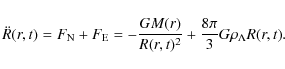
|
(4) |
Its integration leads to the mechanical energy conservation law for each matter shell:
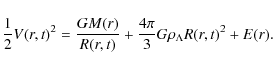
|
(5) |
Here
A simpler model results if we can assume that the cluster mass M0 makes up the majority of the mass M(r), and the flow galaxies can be treated as test particles. Curiously enough, this assumption makes the model more general in the sense that no spherical symmetry is required now for the galaxy distribution in the flow (not necessarily concentric shells around the cluster). However, the gravity force produced by the cluster at the distances of the flow is still isotropic. The model remains also nonlinear: no restriction on the strength of the dynamical effects is assumed.
The mass-point model may seem overly simple, because it is known that the Virgo cluster contributes
only 20% of the bright galaxies within the volume up to the distance of the Local Group (Tully 1982). However, Tully & Mohayaee (2004)
conclude from their numerical action method that the mass-to-luminosity
ratio of the E-galaxy rich Virgo cluster must be several times higher
(they give
![]() )
than in the surrounding region (
)
than in the surrounding region (![]() )
in order to produce the infall velocities observed close to Virgo
(a qualitatively similar result was found by Teerikorpi
et al. 1992). Therefore, the model with most of the mass in and close to the Virgo cluster could be a sufficient first approximation.
)
in order to produce the infall velocities observed close to Virgo
(a qualitatively similar result was found by Teerikorpi
et al. 1992). Therefore, the model with most of the mass in and close to the Virgo cluster could be a sufficient first approximation.
In this simplified/generalized version, the mass M(r) = M is constant in Eq. (4), which shows that antigravity and gravity balance each other at the distance
![]() ,
where
,
where
![\begin{displaymath}%
R_{\rm ZG} = \left[\frac{3 M}{8\pi \rho_{\Lambda}}\right]^{1/3}
\end{displaymath}](/articles/aa/full_html/2010/12/aa14912-10/img42.png)
|
(6) |
is the zero-gravity radius (Chernin et al. 2000; Chernin 2001; Dolgachev et al. 2003, 2004). Gravity dominates at
According to various estimates (Sect. 2), the total mass of the Virgo cluster is 1-2 times the virial mass:
M = (0.6-1.2) ![]()
![]() .
Then the known global
.
Then the known global
![]() gives
gives
| (7) |
Karachentsev & Nasonova (2010) argue in favor of one virial mass for the cluster mass; if that is the case, the lower limit for
Equations (6) and (7) indicate that the zero-gravity radius
![]() of the Virgo system is not far from the zero-velocity radius
R0 = 5.0-7.5 Mpc. Indeed, one expects that
of the Virgo system is not far from the zero-velocity radius
R0 = 5.0-7.5 Mpc. Indeed, one expects that
![]() is slightly larger than R0 (Teerikorpi et al. 2008)
in the standard cosmology. The zero-velocity radius constrains the size
of the cluster (Sect. 2), and there gravity also dominates (
is slightly larger than R0 (Teerikorpi et al. 2008)
in the standard cosmology. The zero-velocity radius constrains the size
of the cluster (Sect. 2), and there gravity also dominates (
![]() ),
the necessary condition for a gravitationally bound cluster. On the
other hand, the Virgocentric flow is located beyond the distance
),
the necessary condition for a gravitationally bound cluster. On the
other hand, the Virgocentric flow is located beyond the distance
![]() ,
hence
the flow is dominated dynamically by the dark energy antigravity.
,
hence
the flow is dominated dynamically by the dark energy antigravity.
The zero-gravity radius of the Virgo system is about 10 times larger than that of the Local system for which
![]() Mpc (Chernin 2001; Chernin et al. 2000, 2009).
We see here the same factor 10 as for the phase structures of the
Virgo and Local systems (Sect. 2). Thus the phase similarity is
complemented by the dynamical similarity.
Mpc (Chernin 2001; Chernin et al. 2000, 2009).
We see here the same factor 10 as for the phase structures of the
Virgo and Local systems (Sect. 2). Thus the phase similarity is
complemented by the dynamical similarity.
3.3 Antigravity push
Now we return to the Milky Way and estimate the net gravity-antigravity effect at its distance
![]() Mpc from the cluster center. With
Mpc from the cluster center. With
![]() Mpc, we find that here
the antigravity force is stronger than the gravity:
Mpc, we find that here
the antigravity force is stronger than the gravity:
| (8) |
As we see, the extra gravity produced by the Virgo cluster mass is actually overbalanced by the antigravity of the dark energy located within the sphere of the radius
The dark energy domination in the flow changes the current
dynamical situation drastically in comparison with the earlier models
by Silk (1974, 1977) and Peebles (1976). At the peri-phery of the Virgocentric flow (at about 30 Mpc) the force ratio is
impressively high:
![]() .
.
3.4 Antigravity domination
The basic trend of the flow evolution is seen from Eq. (5). With
![]() ,
it takes at prolonged times the form
,
it takes at prolonged times the form
![\begin{displaymath}%
V(r,t = \infty) = \left[\frac{8 \pi}{3} G\rho_{\Lambda}\right]^{1/2} R.
\end{displaymath}](/articles/aa/full_html/2010/12/aa14912-10/img56.png)
|
(9) |
In this limit,
![\begin{displaymath}%
H_{\Lambda} = \left[\frac{8 \pi G}{3}\rho_{\Lambda}\right]^{1/2} = 63{-}65~{\rm km~s^{-1}~Mpc^{-1}}.
\end{displaymath}](/articles/aa/full_html/2010/12/aa14912-10/img58.png)
|
(10) |
At a given moment of time (that of observation) t = t0 Eq. (5) presents the spatial structure of the flow. At large distances
| (11) |
The flow trajectories converge to the
asymptotic of Eq. (11) in general independently of the
``boundary/initial conditions'' near the cluster (see Fig. 2 in Teerikorpi & Chernin 2010).
In particular, strong perturbations at small distances in the flow
are
compatible with its regularity at larger distances. No tuning of
the model parameters is required for this - the only significant
quantity is the zero-gravity radius
![]() determined by the cluster mass and the DE density.
determined by the cluster mass and the DE density.
Thus, dark energy dominates the dynamics of the Virgocentric flow on
its entire observed extension from 12 to at least 30 Mpc.
Because of the strong antigravity, the flow proves to be rather
regular, acquiring the linear Hubble relation at distances ![]() Mpc from the cluster center. This
major conclusion from the model also resolves the Hubble-Sandage paradox on the scale of
Mpc from the cluster center. This
major conclusion from the model also resolves the Hubble-Sandage paradox on the scale of ![]() Mpc, in harmony with our general approach to the old puzzle (Sect. 1).
Mpc, in harmony with our general approach to the old puzzle (Sect. 1).
4 Discussion
We discuss here some specific features and implications of the dark energy domination in the Virgocentric flow.
4.1 The Einstein-Straus radius
The mass of dark matter and baryons in the Virgo Cluster,
M = (0.6-1.2) ![]()
![]() ,
was initially collected from the volume which at the present epoch has the radius
,
was initially collected from the volume which at the present epoch has the radius
![]() Mpc, where
Mpc, where
![]() is the mean matter density in the Universe. The quantity
is the mean matter density in the Universe. The quantity
![]() is known as the Einstein-Straus radius in the vacuole model. In the presence of dark energy (Chernin et al. 2006; Teerikorpi et al. 2008),
is known as the Einstein-Straus radius in the vacuole model. In the presence of dark energy (Chernin et al. 2006; Teerikorpi et al. 2008),
![]() .
Within the E-S vacuole, the spherical layer between the radii R0 and
.
Within the E-S vacuole, the spherical layer between the radii R0 and
![]() does not contain any mass. Therefore the approximation of test
particles adopted in the model of Sect. 3 works well in this
layer. Beyond the distance
does not contain any mass. Therefore the approximation of test
particles adopted in the model of Sect. 3 works well in this
layer. Beyond the distance
![]() the model needs modification, but remains qualitatively correct up to the distances of 25-30 Mpc. However, because
the model needs modification, but remains qualitatively correct up to the distances of 25-30 Mpc. However, because
![]() ,
the antigravity of dark energy dominates in the entire area of the Virgocentric flow in Fig. 1.
,
the antigravity of dark energy dominates in the entire area of the Virgocentric flow in Fig. 1.
4.2 Two special trajectories
Equation (5) shows that the flow has zero velocity at
![]() ,
if the total energy of the shell or an individual galaxy
,
if the total energy of the shell or an individual galaxy
|
(12) |
It is easy to see that
![\begin{displaymath}%
V_{\rm min} = H_{\Lambda} R \left[1 + 2 \left(\frac{R_{\rm ...
...right)^3 - 3 \left(\frac{R_{\rm ZG}}{R}\right)^2\right]^{1/2}.
\end{displaymath}](/articles/aa/full_html/2010/12/aa14912-10/img71.png)
|
(13) |
At large distances (
Another special value of the mechanical energy is E(r) = 0, corresponding to parabolic motion. In this case,
![\begin{displaymath}%
V_{\rm par} = H_{\Lambda} R \left[1 + 2 \left(\frac{R_{\rm ZG}}{R}\right)^3\right] ^{1/2}.
\end{displaymath}](/articles/aa/full_html/2010/12/aa14912-10/img73.png)
|
(14) |
The two special trajectories with
It is quite interesting that the most accurate data on the flow (from the TRGB and Cepheids; dots in Fig. 1) show a low dispersion around the line
![]() ,
and the corresponding trajectories occupy the area just between the curves
,
and the corresponding trajectories occupy the area just between the curves
![]() and
and
![]() .
The rather wide spread of the other data in Fig. 1 is mostly due to observational errors (Karachentsev & Nasonova 2010 - especially their Fig. 7b). Still, the restriction
.
The rather wide spread of the other data in Fig. 1 is mostly due to observational errors (Karachentsev & Nasonova 2010 - especially their Fig. 7b). Still, the restriction
![]() puts an upper limit on the value |E| in Eq. (5), and because of this, the asymptotic of Eq. (11) may be reached more easily in the flow.
puts an upper limit on the value |E| in Eq. (5), and because of this, the asymptotic of Eq. (11) may be reached more easily in the flow.
It is also significant that the Local Group outflow has the same feature: the galaxies prefer the area between
![]() and
and
![]() in the Hubble diagram of Fig. 2 (cf. Teerikorpi et al. 2008).
This is another similarity aspect between the Virgo system and the
Local system (Sect. 2). Mathematically, the similarity
reflects that Eqs. (13) and (14) have exactly the same view
for both systems in the dimensionless form y(x) = 0 with
in the Hubble diagram of Fig. 2 (cf. Teerikorpi et al. 2008).
This is another similarity aspect between the Virgo system and the
Local system (Sect. 2). Mathematically, the similarity
reflects that Eqs. (13) and (14) have exactly the same view
for both systems in the dimensionless form y(x) = 0 with
![]() ;
the scale factor is again about 10.
;
the scale factor is again about 10.
This similarity suggests that the condition
![]() has more general significance; it may reflect the kinematical
state of the flow at the early formation epoch. For example,
has more general significance; it may reflect the kinematical
state of the flow at the early formation epoch. For example,
![]() follows, if the galaxies of the flow initially escaped from the cluster (Chernin et al. 2004, 2007c).
follows, if the galaxies of the flow initially escaped from the cluster (Chernin et al. 2004, 2007c).
4.3 Comparison with cosmology
The zero-gravity radius
![]() is a local spatial counterpart of the redshift
is a local spatial counterpart of the redshift
![]() at which the gravity and the antigravity balance each other in the Universe as
a whole. Globally, the balance takes place only at one moment
at which the gravity and the antigravity balance each other in the Universe as
a whole. Globally, the balance takes place only at one moment
![]() in the entire co-moving space, while the local gravity-antigravity
balance exists during the whole life-time of the system since its
formation, but only on the sphere of the radius
in the entire co-moving space, while the local gravity-antigravity
balance exists during the whole life-time of the system since its
formation, but only on the sphere of the radius
![]() .
.
The Virgocentric flow should not be identified with the global cosmological expansion. The Virgo system lies deeply inside the cosmic cell of uniformity and does not ``know'' about the universe of the horizon scales. In the early epoch of weak protogalactic perturbations, the dark matter and baryons of the system participated in the cosmological expansion. But later, at the epoch of nonlinear perturbations, the matter separated from the expansion and underwent violent evolution. Contrary to that, the unperturbed flow at horizon-scale distances was not similarly affected, and up to now the initial isotropy of its expansive motion and the uniformity of its matter distribution are conserved. Therefore, it is mysterious that the global Hubble constant 72 km s-1 Mpc-1 is so close to the local expansion rate 65 km s-1 Mpc-1 in the Virgocentric flow (two beams in Fig. 1). This is one aspect of the Hubble-Sandage paradox (Sect. 1).
Trying to find an explanation, we note that the Friedmann equation for the scale factor a(t) has
much the same form as the local energy conservation Eq. (5):
|
(15) |
The constant
![\begin{displaymath}%
H(t) = \frac{\dot a(t)}{a} = \left[\frac{8 \pi G}{3}\left(\...
...} \left[1 + \frac{\rho_m}{2
\rho_{\Lambda}}\right]^{1/2}\cdot
\end{displaymath}](/articles/aa/full_html/2010/12/aa14912-10/img86.png)
|
(16) |
When time goes to infinity, the matter density drops to zero, the dark energy becomes dominant, and the cosmological Hubble factor becomes time-independent:
![\begin{displaymath}%
H(t) \rightarrow H_{\Lambda} = \left[\frac{8 \pi
G}{3}\rho_{\Lambda}\right]^{1/2} = 63{-}65~{\rm km~s^{-1}~Mpc^{-1}}.
\end{displaymath}](/articles/aa/full_html/2010/12/aa14912-10/img87.png)
|
(17) |
At the present epoch,
![\begin{displaymath}%
H = H_{\Lambda} \left[1 + \frac{\Omega_{\rm M}}{ \Omega_{\Lambda}}\right]^{1/2}
\simeq 72~{\rm km~s^{-1}~Mpc^{-1}},
\end{displaymath}](/articles/aa/full_html/2010/12/aa14912-10/img88.png)
|
(18) |
which is equal to the empirical (WMAP) value.
As we see, the Virgocentric flow and the global cosmological
expansion have a common asymptotic in the limit of dark energy
domination: for the local flow, this is the asymptotic in space (large
distances from the cluster center), and for the global flow, this is
the asymptotic in time (a future of the Universe). If the
asymptotic is approached now both globally and locally, we
would have
![]() on the largest scales and
on the largest scales and
![]() in the Virgocentric flow.
in the Virgocentric flow.
In their present states, both flows are near the asymptotic, though they do not quite reach it. That is why H, HV, and
![]() have similar values. The flows are not directly related to each other;
but, they ``feel'' the same uniform dark energy background, and in this
way both are controlled by the antigravity force, which is equally
effective near the cosmic horizon and at the periphery of the
Virgocentric flow. As a result, the local flow at its
large distances looks much like a ``part'' of the global
horizon-distance flow.
have similar values. The flows are not directly related to each other;
but, they ``feel'' the same uniform dark energy background, and in this
way both are controlled by the antigravity force, which is equally
effective near the cosmic horizon and at the periphery of the
Virgocentric flow. As a result, the local flow at its
large distances looks much like a ``part'' of the global
horizon-distance flow.
The near coincidence of the values H, ![]() ,
and
,
and
![]() explained by our model clarifies the Hubble-Sandage paradox (Sect. 1) for the Virgocentric flow: asymptotically, the flow
reaches not only the linear Hubble law (Sect. 3), but also acquires the expansion rate
explained by our model clarifies the Hubble-Sandage paradox (Sect. 1) for the Virgocentric flow: asymptotically, the flow
reaches not only the linear Hubble law (Sect. 3), but also acquires the expansion rate ![]() ,
which approaches the global rate when the measuring accuracy is improved.
,
which approaches the global rate when the measuring accuracy is improved.
4.4 Probing local dark energy
The global density of dark energy can be derived if the redshift
![]() is
found at which the gravity of matter is exactly balanced by the dark
energy antigravity, and also the present matter density is known. The
same logic works in local studies: just find the zero-gravity
radius
is
found at which the gravity of matter is exactly balanced by the dark
energy antigravity, and also the present matter density is known. The
same logic works in local studies: just find the zero-gravity
radius
![]() from the outflow observations and the mass of the local system.
from the outflow observations and the mass of the local system.
We may now restrict the value of
![]() using the diagram of Fig. 1. Because the zero-gravity surface lies outside the cluster volume, it should be
using the diagram of Fig. 1. Because the zero-gravity surface lies outside the cluster volume, it should be
![]() Mpc. On the other hand, the linear velocity-distance relation, with the Hubble ratio close to H, is clearly seen from a distance of about 15 Mpc. This suggests that
Mpc. On the other hand, the linear velocity-distance relation, with the Hubble ratio close to H, is clearly seen from a distance of about 15 Mpc. This suggests that
![]() Mpc.
The argument that
the zero-gravity surface is located below the point where the local
flow reaches the global expansion rate gained support from the
calculations by Teerikorpi & Chernin (2010).
As for the cluster mass, we adopt the range
M = (0.6-1.2)
Mpc.
The argument that
the zero-gravity surface is located below the point where the local
flow reaches the global expansion rate gained support from the
calculations by Teerikorpi & Chernin (2010).
As for the cluster mass, we adopt the range
M = (0.6-1.2) ![]()
![]() (Sect. 2). Then Eq. (6) in the form
(Sect. 2). Then Eq. (6) in the form
![]() directly leads to robust upper and lower limits to the unknown local dark energy density
directly leads to robust upper and lower limits to the unknown local dark energy density ![]() :
:
|
(19) |
Indeed, the upper limit obtained from the cluster size (
We may now argue reversely: let us assume that the density of dark
energy is known from cosmological observations and the zero-gravity
radius
![]() is between 6 and 15 Mpc. Then we may independently estimate the mass of the Virgo Cluster:
M = (0.3-4)
is between 6 and 15 Mpc. Then we may independently estimate the mass of the Virgo Cluster:
M = (0.3-4) ![]()
![]() .
The value of the cluster mass adopted earlier is within this interval.
.
The value of the cluster mass adopted earlier is within this interval.
4.5 The origin of the local flows
The model of Sect. 3 describes the present structure of the Virgocentric flow and also predicts its future evolution. However, it says almost nothing about the initial state of the flow. Our discussion suggests that the Virgo cluster and the outflow form a system with a common origin and evolutionary history. Its formation was most probably caused by complex linear and nonlinear processes (collisions and merging of galaxies and protogalactic units, violent relaxation of the system in its self-gravity field, etc.). Similar processes are expected in the early history of the Local Group and other systems with the two-component structure. Their basic features might be recognized from big N-body simulations, like the Millennium Simulation (Li & White 2008). We leave it for a later study to clarify the way in which the galaxies of local flows gain their initial expansion velocities.
5 Conclusions
The recently published systematic and most accurate data on the velocities and distances of galaxies in the Virgo cluster and its environment (Karachentsev & Nasonova 2010) shed light on the physics behind the observed properties of the cluster and the flow. We find that
- 1.
- The cluster and the flow can be treated together as a physical system embedded in the uniform dark energy background; this is adopted in our analytical nonlinear model.
- 2.
- The nonlinear interplay between the gravity produced by the cluster mass (dark matter + baryons) and the antigravity of the dark energy is the major dynamical factor determining the kinematic structure of the system and controlling its evolution; our model enables one to describe this in a simple (exact or approximate) quantitative way.
- 3.
- The key physical parameter of the system is its zero-gravity radius,
 Mpc,
below which the gravity dominates the quasi-stationary bound cluster,
while the antigravity dominates the expanding Virgocentric flow.
Mpc,
below which the gravity dominates the quasi-stationary bound cluster,
while the antigravity dominates the expanding Virgocentric flow.
- 4.
- The dark energy antigravity brings order and regularity to the Virgocentric flow and the flow acquires the linear velocity-distance relation at the Virgocentric distances R > 15 Mpc. Thus, the Hubble-Sandage paradox is understood on the cluster scale.
- 5.
- In the velocity-distance diagram, the zero-gravity radius is near to or somewhat larger than the zero-velocity radius R0 = 5.0-7.5 Mpc, as determined by Karachentsev & Nasonova (2010).
- 6.
- With the value of
 found from the diagram, one may estimate the mass of the Virgo cluster, using the known global density of dark energy:
M = (0.3-4)
found from the diagram, one may estimate the mass of the Virgo cluster, using the known global density of dark energy:
M = (0.3-4) 
 .
.
- 7.
- With the same value of
 ,
one may estimate the local density of the dark energy in the Virgo
system, if the mass of the cluster is considered known (from the virial
or the zero-velocity method):
,
one may estimate the local density of the dark energy in the Virgo
system, if the mass of the cluster is considered known (from the virial
or the zero-velocity method):


- 8.
- The two-component Virgo system is similar to the Local system formed by the Local Group together with the local outflow around it. In the velocity-distance diagram, the Virgo system reproduces the Local system with the scale factor of about 10. A dynamical similarity is seen in that the zero-gravity radius for the Virgo system is about 10 times larger than for the Local system.
- 9.
- The similarity suggests that a universal two-component grand design may exist with a quasi-stationary bound central component and an expanding outflow around it on the spatial scales of 1-30 Mpc. The phase and dynamical structure of the real two-component systems reflects the nonlinear gravity-antigravity interplay with dark energy domination in the flow component.
A.C., V.D., and L.D. thank the RFBR for partial support via the grant 10-02-00178. We also thank the anonymous referee for useful comments.
References
- Balaguera-Antolinez, A., Mota, D. F., & Nowakowski, M. 2007, MNRAS, 382, 621 [NASA ADS] [CrossRef] [Google Scholar]
- Bambi, C. 2007, PhRvD, 75h3003 [Google Scholar]
- Baryshev, Yu. V., Chernin, A. D., & Teerikorpi, P. 2001, A&A, 378, 729 [NASA ADS] [CrossRef] [EDP Sciences] [Google Scholar]
- Byrd, G. G., Chernin, A. D., & Valtonen, M. J. 2007, Cosmology: Foundations and Frontiers, URSS, Moscow [Google Scholar]
- Chernin, A. D. 2001, Physics-Uspekhi, 44, 1099 [NASA ADS] [CrossRef] [Google Scholar]
- Chernin, A. D. 2008, Physics-Uspekhi, 51, 267 [Google Scholar]
- Chernin, A. D., Teerikorpi, P., & Baryshev, Yu. V. 2000, Adv. Space Res., 31, 459 [NASA ADS] [CrossRef] [Google Scholar]
- Chernin, A. D., Karachentsev, I. D., Valtonen, M. J., et al. 2004, A&A, 415, 19 [NASA ADS] [CrossRef] [EDP Sciences] [Google Scholar]
- Chernin, A. D., Teerikorpi, P., & Baryshev, Yu. V. 2006, A&A, 456, 13 [Google Scholar]
- Chernin, A. D., Karachentsev, I. D., Nasonova, O. G., et al. 2007a, Astrophys., 50, 405 [NASA ADS] [CrossRef] [Google Scholar]
- Chernin, A. D., Karachentsev, I. D., Makarov, D. I., et al. 2007b, A&AT, 26, 275 [NASA ADS] [Google Scholar]
- Chernin, A. D., Karachentsev, I. D., Valtonen, M. J., et al. 2007c, A&A, 467, 933 [NASA ADS] [CrossRef] [EDP Sciences] [Google Scholar]
- Chernin, A. D., Teerikorpi, P., Valtonen, M. J., et al. 2009, A&A, 507, 1271 [NASA ADS] [CrossRef] [EDP Sciences] [Google Scholar]
- Dolgachev, V. P., Domozhilova, L. M., & Chernin, A. D. 2003, Astr. Rep., 47, 728 [NASA ADS] [CrossRef] [Google Scholar]
- Dolgachev, V. P., Domozhilova, L. M., & Chernin, A. D. 2004, Astr. Rep., 48, 787 [NASA ADS] [CrossRef] [Google Scholar]
- Ekholm, T., Lanoix, P., Paturel, G., Teerikorpi, P., & Fouqué, P. 1999, A&A, 351, 827 [NASA ADS] [Google Scholar]
- Ekholm, T., Lanoix, P., Teerikorpi, P., Fouqué, P., & Paturel, G. 2000, A&A, 355, 835 [NASA ADS] [Google Scholar]
- Ekholm, T., Baryshev, Yu. V., Teerikorpi, P., Hanski, M., & Paturel, G. 2001, A&A, 368, L17 [NASA ADS] [CrossRef] [EDP Sciences] [Google Scholar]
- Gliner, E. B. 1965, JETP, 49, 542 (1966, Sov. Phys. JETP, 22, 376) [Google Scholar]
- Gromov, A., Baryshev, Yu., Suson, D., & Teerikorpi, P. 2001, Gravitation & Cosmology, 7, 140 [NASA ADS] [Google Scholar]
- Guo, Q., & Shan, H.-Y. 2009, RAA, 9, 151 [NASA ADS] [Google Scholar]
- Hoffman, G. L., & Salpeter, E. E. 1982, ApJ, 263, 485 [NASA ADS] [CrossRef] [Google Scholar]
- Hoffman, Y., Martinez-Vaquero, L. A., Yepes, G., & Gottlöber, S. 2008, MNRAS, 386, 390 [NASA ADS] [CrossRef] [Google Scholar]
- Huchra, J. P. 1988, in The Extragalactic Distance Scale, ASP, 257 [Google Scholar]
- Karachentsev, I. D. 2005, AJ, 129, 178 [NASA ADS] [CrossRef] [Google Scholar]
- Karachentsev, I. D., & Nasonova, O. G. 2010, MNRAS, 405, 1075 [NASA ADS] [Google Scholar]
- Karachentsev, I. D., Sharina, M. E., Dolphin, A. E., et al. 2002a, A&A, 385, 21 [NASA ADS] [CrossRef] [EDP Sciences] [Google Scholar]
- Karachentsev, I. D., Sharina, M. E., Makarov, D. I., et al. 2002b, A&A, 389, 812 [NASA ADS] [CrossRef] [EDP Sciences] [Google Scholar]
- Karachentsev, I. D., Chernin, A. D., & Teerikorpi, P. 2003a, Astrophys., 46, 491 [Google Scholar]
- Karachentsev, I. D., Makarov, D. I., Sharina, M. E., et al. 2003b, A&A, 398, 479 [NASA ADS] [CrossRef] [EDP Sciences] [Google Scholar]
- Karachentsev, I. D., Dolphin, A. E., Tully, R. B., et al. 2006, AJ, 131, 1361 [NASA ADS] [CrossRef] [Google Scholar]
- Karachentsev, I. D., Kashibadze, O. G., Makarov, D. I., et al. 2009, MNRAS, 393, 1265 [NASA ADS] [CrossRef] [Google Scholar]
- Li, Y.-S., & White, S. M. D. 2008, MNRAS, 384, 1459 [NASA ADS] [CrossRef] [Google Scholar]
- Lynden-Bell, D. 1981, The Observatory, 101, 111 [NASA ADS] [Google Scholar]
- Macciò, A. V., Governato, F., & Horellou, C. 2005, MNRAS, 359, 941 [NASA ADS] [CrossRef] [Google Scholar]
- Makarov, D., Makarova, L., Rizzi, L., et al. 2006, AJ, 132, 2729 [NASA ADS] [CrossRef] [Google Scholar]
- Martinez-Vaquero, L., Yepes, G., Hoffman, Y., Gottlöber, S., & Sivan, M. 2009, MNRAS, 397, 2070 [NASA ADS] [CrossRef] [Google Scholar]
- Mei, S., Blakeslee, J. P., Côte, P., et al. 2007, ApJ, 655, 144 [NASA ADS] [CrossRef] [Google Scholar]
- Niemi, S.-M., & Valtonen, M. J. 2009, A&A, 494, 857 [NASA ADS] [CrossRef] [EDP Sciences] [Google Scholar]
- Peebles, P. J. E. 1976, ApJ, 205, 318 [NASA ADS] [CrossRef] [Google Scholar]
- Perlmutter, S., Aldering, G., Goldhaber, G., et al. 1999, ApJ, 517, 565 [NASA ADS] [CrossRef] [Google Scholar]
- Riess, A. G., Filippenko, A. V., Challis, P., et al. 1998, AJ, 116, 1009 [NASA ADS] [CrossRef] [Google Scholar]
- Rizzi, L., Tully, R. B., Makarov, D., et al. 2007, ApJ, 661, 815 [NASA ADS] [CrossRef] [MathSciNet] [Google Scholar]
- Saarinen, S., & Valtonen, M. J. 1985, A&A, 153, 130 [NASA ADS] [Google Scholar]
- Sandage, A. 1986, ApJ, 307, 1 [NASA ADS] [CrossRef] [Google Scholar]
- Sandage, A. 1999, ApJ, 527, 479 [NASA ADS] [CrossRef] [Google Scholar]
- Sandage, A., Tammann, G., & Saha, A. 2006, ApJ, 653, 843 [NASA ADS] [CrossRef] [Google Scholar]
- Silk, J. 1974, ApJ, 193, 525 [NASA ADS] [CrossRef] [Google Scholar]
- Silk, J. 1977, A&A, 59, 53 [NASA ADS] [Google Scholar]
- Spergel, D. N., Bean, R., Doré, O., et al. 2007, ApJS, 170, 377 [NASA ADS] [CrossRef] [Google Scholar]
- Teerikorpi, P., & Chernin, A. D. 2010, A&A, 516, A93 [NASA ADS] [CrossRef] [EDP Sciences] [Google Scholar]
- Teerikorpi, P., Bottinelli, L., Gouguenheim, L., & Paturel, G. 1992, A&A, 260, 17 [NASA ADS] [Google Scholar]
- Teerikorpi, P., Chernin, A. D., & Baryshev, Yu. V. 2006, A&A, 483, 383 [Google Scholar]
- Teerikorpi, P., Chernin, A. D., Karachentsev, I. D., et al. 2008, A&A, 483, 383 [NASA ADS] [CrossRef] [EDP Sciences] [Google Scholar]
- Theureau, G., Hanski, M., Ekholm, T., et al. 1997, A&A, 322, 730 [NASA ADS] [Google Scholar]
- Thim, F., Tammann, G., Saha, A., et al. 2003, ApJ, 590, 256 [NASA ADS] [CrossRef] [Google Scholar]
- Tonry, J. L., Blakeslee, J. P., Ajhar, E. A., & Dressler, A. 2000, ApJ, 530, 625 [NASA ADS] [CrossRef] [Google Scholar]
- Tully, R. B. 1982, ApJ, 257, 389 [NASA ADS] [CrossRef] [Google Scholar]
- Tully, R. B., & Mohayaee, R. 2004 in Outskirts of Galaxy Clusters, ed. A. Diaferio, IAU Coll., 195, 205 [Google Scholar]
- Tully, R. B., Shaya, E. T., Karachentsev, I. D., et al. 2008, ApJ, 676, 184 [NASA ADS] [CrossRef] [Google Scholar]
- Valtonen, M. J., Innanen, K. A., Huang, T. Y., & Saarinen, S. 1985, A&A, 143, 182 [NASA ADS] [Google Scholar]
- Valtonen, M. J., Niemi, S., Teerikorpi, P., et al. 2008, DDA, 39.0103 [Google Scholar]
- Whiting, A. B. 2003, ApJ, 587, 186 [NASA ADS] [CrossRef] [Google Scholar]
Footnotes
- ... center
![[*]](/icons/foot_motif.png)
- The increasing observational evidence and theoretical considerations favoring this view have been discussed by Macciò et al. (2005), Sandage (2006), Teerikorpi et al. (2006, 2008), Chernin et al. (2006, 2007a-c), Byrd et al. (2007), Valtonen et al. (2008), Balaguera-Antolinez et al. (2007), Bambi (2007), Chernin (2008), Niemi & Valtonen (2009), Guo & Shan (2009). For some counter-arguments to this new approach see Hoffman et al. (2008) and Martinez-Valquero et al. (2009).
All Figures
|
|
Figure 1:
Hubble diagram with Virgocentric velocities and distances for
761 galaxies of the Virgo Cluster and the outflow (Karachentsev
& Nasonova 2010). The two-component pattern is outlined by bold dashed lines. The zero-gravity radius
|
| Open with DEXTER | |
| In the text | |
|
|
Figure 2:
Hubble diagram for 57 galaxies of the Local Group and the local flow (Karachentsev et al. 2009). The thin line indicates the zero-velocity radius
R0 = 0.7-0.9 Mpc. The two-component phase
structure is outlined by the bold dashed line. Zoomed in about
10 times, the group-scale structure well reproduces the
cluster-scale structure (Fig. 1). The zero-gravity radius
|
| Open with DEXTER | |
| In the text | |
Copyright ESO 2010
Current usage metrics show cumulative count of Article Views (full-text article views including HTML views, PDF and ePub downloads, according to the available data) and Abstracts Views on Vision4Press platform.
Data correspond to usage on the plateform after 2015. The current usage metrics is available 48-96 hours after online publication and is updated daily on week days.
Initial download of the metrics may take a while.