| Issue |
A&A
Volume 519, September 2010
|
|
|---|---|---|
| Article Number | A95 | |
| Number of page(s) | 9 | |
| Section | Extragalactic astronomy | |
| DOI | https://doi.org/10.1051/0004-6361/201014476 | |
| Published online | 17 September 2010 | |
Kinematics and line strength indices in the halos of the Coma
brightest cluster galaxies NGC 4874 and NGC 4889![[*]](/icons/foot_motif.png)
L. Coccato1 - M. Arnaboldi2,3 - O. Gerhard1 - K. C. Freeman4 - G. Ventimiglia1,2 - N. Yasuda5
1 - Max-Plank-Institut für Extraterrestrische Physik,
Giessenbachstra![]() e 1, 85741 Garching bei München, Germany
e 1, 85741 Garching bei München, Germany
2 - European Southern Observatory, Karl-Schwarzschild-Stra![]() e 2,
85748 Garching bei München, Germany
e 2,
85748 Garching bei München, Germany
3 - INAF, Osservatorio Astronomico di Pino Torinese, 10025 Pino Torinese,
Italy
4 - Research School of Astronomy & Astrophysics, ANU, Canberra, Australia
5 - Institute for the Physics and Mathematics of the Universe,
University of Tokyo, 5-1-5 Kashiwa-no-ha, Kashiwa, Chiba
277-8568, Japan
Received 22 March 2010 / Accepted 6 May 2010
Abstract
Aims. We investigate the stellar kinematics and line
strength indices in the outer halos of brightest cluster galaxies
(BCGs) in the Coma cluster to obtain the outer halo
![]() and
and ![]() profiles and to derive constraints on the formation history of these objects.
profiles and to derive constraints on the formation history of these objects.
Methods. We analyzed absorption lines in deep, medium-resolution, long-slit spectra in the wavelength range ![]() 4500-5900 Å, out to
4500-5900 Å, out to ![]() 50 kpc for NGC 4874 and
50 kpc for NGC 4874 and ![]() 65 kpc for NGC 4889, probing regions with a surface brightness down to
65 kpc for NGC 4889, probing regions with a surface brightness down to
![]() mag arcsec-2.
mag arcsec-2.
Results. These data provide stellar velocity and velocity
dispersion profiles along the major axes of both BCGs, and also along
the minor axis of NGC 4889. The kinematic properties of NGC 4874 and
NGC 4889 halos extend the previous relations of early-type galaxy halos
to bright luminosities and indicate that the stars in the outer regions
are still bound to these galaxies. For NGC 4889 we also determine H![]() Mg and Fe line strength indices, finding strong radial gradients for Mg
and Fe. The current dataset for NGC 4889 is one of the most extended in
radius, including both stellar kinematics and line strength index measurements.
Mg and Fe line strength indices, finding strong radial gradients for Mg
and Fe. The current dataset for NGC 4889 is one of the most extended in
radius, including both stellar kinematics and line strength index measurements.
Key words: galaxies: clusters: general - galaxies: clusters: individual: Coma cluster - galaxies: individual: NGC 4874 - galaxies: kinematics and dynamics - galaxies: individual: NGC 4889
1 Introduction
Brightest cluster galaxies (BCGs) are large and luminous galaxies
located in the centers of galaxy clusters. The formation history of
BCGs and their halos is connected to the formation of the cluster
itself (Dubinski 1998) and to the presence of diffuse
intra-cluster light (Murante et al. 2007; Gonzalez et al. 2005).
The formation of BCG and their halos can be investigated by the
combined study of the stellar kinematics and the population content
of their halos. Dynamical timescales in the halos are on the order of
1 Gyr![]() , approaching a
significant fraction of the age of the universe, and therefore the
fingerprints of the formation processes may still be preserved there.
, approaching a
significant fraction of the age of the universe, and therefore the
fingerprints of the formation processes may still be preserved there.
So far, the studies that provide both stellar kinematics and line strength indices in BCGs have been limited to within one effective radius (e.g. Carter et al. 1999; Fisher et al. 1995; Brough et al. 2007; Spolaor et al. 2008b,a; Loubser et al. 2008,2009), therefore measurements over a wider radial range are highly desirable.
This work is the first of a series aimed at studying the formation history of BCGs by probing the stellar kinematics and populations of their outer halos, covering regions at 3 effective radii or larger. As first targets, we selected NGC 4874 and NGC 4889, the two BCGs in the Coma cluster (Abell 1656). The inner parts of these galaxies have been studied with photometric, kinematic and stellar populations data documented and available in the literature (e.g. Gavazzi et al. 2003; Mehlert et al. 2000; Gerhard et al. 2007; Trager et al. 2008).
In this paper we describe the data acquisition, reduction, and the
measurements of the long slit stellar kinematics for both galaxies,
and the line strength indices for NGC 4889. The data set in NGC 4889
extends out to 65 kpc (which correspond to ![]() 4.3 effective radii,
Jorgensen et al. 1995), providing the most radially extended
measurements of absorption line kinematics and line strength
indices in the outer halo of a BCG. These data are the basis of
forthcoming papers investigating the formation history and
evolution of the galaxies in the Coma cluster core.
4.3 effective radii,
Jorgensen et al. 1995), providing the most radially extended
measurements of absorption line kinematics and line strength
indices in the outer halo of a BCG. These data are the basis of
forthcoming papers investigating the formation history and
evolution of the galaxies in the Coma cluster core.
The paper is organized as follows. Spectroscopic observations and data reduction are discussed in Sect. 2. The sky subtraction and the radial binning of the spectra are described in Sects. 3 and 4, respectively. Section 5 describes the measurements of the stellar kinematics, while Sect. 6 describes the measurements of the line strength indices. Finally, the results are discussed in Sect. 7.
In this paper, we adopt a distance to NGC 4784 of D=102.6 Mpc and an
effective radius of
![]() kpc; for NGC 4889 we
adopt D=92.7 Mpc and
kpc; for NGC 4889 we
adopt D=92.7 Mpc and
![]() kpc. Distances are taken
from the NASA/IPAC Extragalactic Database (NED) and the effective
radii from Jorgensen et al. (1995).
kpc. Distances are taken
from the NASA/IPAC Extragalactic Database (NED) and the effective
radii from Jorgensen et al. (1995).
2 Spectroscopic observations and data reduction
Long slit spectra were acquired with the Faint Object Camera And
Spectrograph (FOCAS, Kashikawa et al. 2002) at the SUBARU telescope
of the National Astronomical Observatory of Japan (NAOJ), on Mauna Kea
(Hawaii, USA). Data were collected during two runs; in run #1 (April
2007) we obtained 8 h integration long slit data on the West side
of the NGC 4889 major axis, in the region in between NGC 4874 and NGC
4889, with a spectral resolution of 76
![]() .
In run #2 (May 2008) we
obtained 5.5 h integration of long slit data for the NGC 4889 minor
axis, with a spectral resolution of 96
.
In run #2 (May 2008) we
obtained 5.5 h integration of long slit data for the NGC 4889 minor
axis, with a spectral resolution of 96
![]() .
In Fig. 1
the observed field and slits locations are shown. In
Table 1 we provide a summary of the observing log and
instrumental set up.
During these runs, we observed a set of kinematic template stars and
Lick spectrophotometric standard stars for calibration to the Lick
system. Long slit spectra on blank fields of the COMA cluster were
also obtained for the sky background evaluation and to correct for
large-scale illumination patterns due to slit vignetting. In addition,
we observed at least one flux standard star per night, to flux
calibrate the spectra.
.
In Fig. 1
the observed field and slits locations are shown. In
Table 1 we provide a summary of the observing log and
instrumental set up.
During these runs, we observed a set of kinematic template stars and
Lick spectrophotometric standard stars for calibration to the Lick
system. Long slit spectra on blank fields of the COMA cluster were
also obtained for the sky background evaluation and to correct for
large-scale illumination patterns due to slit vignetting. In addition,
we observed at least one flux standard star per night, to flux
calibrate the spectra.
![\begin{figure}
\par\includegraphics[width=7.6cm,clip]{14476fg01.ps}
\end{figure}](/articles/aa/full_html/2010/11/aa14476-10/img13.png)
|
Figure 1: Optical DSS image of the Coma cluster core. North is up, East is Left. The two red lines with the central gap represent the portion of the slit covered by the 2 CCDs in the FOCAS spectrograph. The scale in kpc given on the bottom left corner is computed assuming a distance of 97.7 Mpc, which is the average of the distances to NGC 4889 and NGC 4874 as given by NED. |
| Open with DEXTER | |
Table 1: Summary of the observing log and instrumental set up.
Standard data reduction (bias subtraction, flat fielding to correct
for pixel to pixel chip sensitivity fluctuations) were performed
using standard IRAF![]() routines. Spectra distortion due to
the optics were corrected using FOCASRED
routines. Spectra distortion due to
the optics were corrected using FOCASRED![]() data reduction package within the IRAF environment.
Cosmic rays were detected and removed using LACOS
(van Dokkum 2001). Residual cosmic rays were removed by manually
editing the spectrum.
Wavelength calibration was performed using standard IRAF
routines. Comparison Th+Ar spectra were obtained during the night
close in time to the scientific spectra. Because two different grisms
were used for the two runs, we optimized the wavelength calibration
in different spectral ranges:
data reduction package within the IRAF environment.
Cosmic rays were detected and removed using LACOS
(van Dokkum 2001). Residual cosmic rays were removed by manually
editing the spectrum.
Wavelength calibration was performed using standard IRAF
routines. Comparison Th+Ar spectra were obtained during the night
close in time to the scientific spectra. Because two different grisms
were used for the two runs, we optimized the wavelength calibration
in different spectral ranges:
![]() ,
for run 1, and
,
for run 1, and
![]() ,
for run 2. With this choice, we were
able to minimize the errors in the wavelength calibration, which are
about
,
for run 2. With this choice, we were
able to minimize the errors in the wavelength calibration, which are
about ![]()
![]() as measured from the calibrated comparison
spectra and from the sky line emission lines. Absorption lines as H
as measured from the calibrated comparison
spectra and from the sky line emission lines. Absorption lines as H![]() ,
Mg I(
,
Mg I(
![]() )
triplet and Fe I(
)
triplet and Fe I(
![]() )
fall inside the two selected wavelength
ranges.
Finally, the spectra were corrected for change in the slit
illumination along the slit direction using the spectra obtained on sky
blank fields.
)
fall inside the two selected wavelength
ranges.
Finally, the spectra were corrected for change in the slit
illumination along the slit direction using the spectra obtained on sky
blank fields.
3 Sky subtraction
Sky subtraction may introduce errors in the measurements from spectra of low surface brightness regions. To limit systematic effects as much as possible, we account for the sky subtraction in two ways.
The first method is to obtain sky spectra from blank fields. The sky spectrum is then free of contamination either from the galaxy halos or intracluster light, but the spectra are not taken simultaneously with the scientific exposures. Therefore, if the relative intensities of the sky continuum, emission or absorption lines change with time, sky residuals are present in the galaxy spectra.
![\begin{figure}
\par\includegraphics[width=9cm,clip]{14476fg02a.ps}
\includegraphics[width=9cm,clip]{14476fg02b.ps}
\end{figure}](/articles/aa/full_html/2010/11/aa14476-10/img32.png)
|
Figure 2:
Upper panel: difference between the mean sky spectrum
measured at the offset position on the blank field and the sky
spectrum measured at the long-slit center (run 1). The mean value of
the difference is |
| Open with DEXTER | |
The second method is to extract the sky spectrum from a region of the slit where the galaxy light is negligible (central part of the slit for run 1, outer borders of the slit for run 2). The sky is now observed simultaneously to the galaxy observations but the disadvantage is that it might contain a residual contribution from the galaxy halo and/or intracluster light. We then may subtract spectral features, which belong to the galaxy and which we are, in fact, interested in measuring.
In the upper panel of Fig. 2 we compare the sky
spectra extracted using the two different methods. If the sky spectrum
extracted at the slit center (run 1) or at the slit edges (run 2)
contains a small residual contribution from the galaxy (stellar
continuum and/or absorption line features) it should become visible
when comparing with the sky spectrum extracted at the offset
position. Residuals are approximately ![]() counts
(i.e.
counts
(i.e. ![]() 2% of the average sky level at 5100 Å). This means
that the level of the sky continuum computed with the two methods is
the same, and differences between the two methods (if any) should be
associated with spectral line features. However, we clearly see
that larger residuals are present in the wavelength regions of the
most intense sky lines. In particular, a residual spectral feature is
seen around
2% of the average sky level at 5100 Å). This means
that the level of the sky continuum computed with the two methods is
the same, and differences between the two methods (if any) should be
associated with spectral line features. However, we clearly see
that larger residuals are present in the wavelength regions of the
most intense sky lines. In particular, a residual spectral feature is
seen around ![]() 5280 Å which is very close to the position of
the Mg I(
5280 Å which is very close to the position of
the Mg I(
![]() )
triplet for the systemic velocity of NGC 4889. In the
lower panel of Fig. 2 we compare the sky
spectra extracted at offset position at different times during the
night. We concentrate on the spectral region from 5150 Å to 5380 Å,
which contains some OH emission lines (Osterbrock et al. 1996). The
variation of sky lines intensities over time is clearly visible and
its amplitude (
)
triplet for the systemic velocity of NGC 4889. In the
lower panel of Fig. 2 we compare the sky
spectra extracted at offset position at different times during the
night. We concentrate on the spectral region from 5150 Å to 5380 Å,
which contains some OH emission lines (Osterbrock et al. 1996). The
variation of sky lines intensities over time is clearly visible and
its amplitude (![]() 1-2 AUDs) is consistent with the intensity of
the spectral feature observed at
1-2 AUDs) is consistent with the intensity of
the spectral feature observed at ![]() 5280 Å. These time
variations indicate that the observed residual at
5280 Å. These time
variations indicate that the observed residual at ![]() 5280 Å is
related to the sky and can be best corrected for by using the sky
observed simultaneously to the scientific observations.
5280 Å is
related to the sky and can be best corrected for by using the sky
observed simultaneously to the scientific observations.
4 Extraction of spectra in low surface brightness regions
Before measuring the stellar kinematics (Sect. 5) and
the line-strength indices (Sect. 6), we needed to bin spatially
the spectra along the slit direction to increment the signal to noise ratio. Spectra from
adjacent columns![]() were added in order to reach a minimum
signal to noise
were added in order to reach a minimum
signal to noise
![]() for run 1, and
for run 1, and
![]() for run 2,
which ensure reliable measurements of stellar kinematics and line
strength indices. For run 1, the extracted spectra have an overall
lower
for run 2,
which ensure reliable measurements of stellar kinematics and line
strength indices. For run 1, the extracted spectra have an overall
lower ![]() than run 2 because the slit was sampling regions of lower
surface brightness, and was illuminating regions of the CCD with bad
cosmetics and hot columns which required masking.
than run 2 because the slit was sampling regions of lower
surface brightness, and was illuminating regions of the CCD with bad
cosmetics and hot columns which required masking.
Summing adjacent spectra over part of the slit may affect the absorption line shapes by either smoothing the intrinsic velocity gradient or enlarging the absorption lines, if there is a substantial velocity gradient in the sampled region.
Such an effect may be significant for run 1, where the slit
sampled halo light of galaxies whose systemic velocities differ by
![]() 700
700
![]() .
We estimated the maximum number of adjacent columns to be summed and
extracted in a one-dimensional spectrum to be approximately
.
We estimated the maximum number of adjacent columns to be summed and
extracted in a one-dimensional spectrum to be approximately ![]() 30-40,
depending also on the CCD cosmetics. Within this range, the
maximum smoothing of the intrinsic velocity gradient is approximately
30-40,
depending also on the CCD cosmetics. Within this range, the
maximum smoothing of the intrinsic velocity gradient is approximately
![]() 20-30
20-30
![]() ,
which is the same order as the measurement
errors. This value is obtained multiplying the number of columns by
the maximum velocity gradient along the slit
,
which is the same order as the measurement
errors. This value is obtained multiplying the number of columns by
the maximum velocity gradient along the slit![]() , which we estimated to be
, which we estimated to be ![]() 0.8
0.8
![]() .
For run 2, we
estimated the effect to be negligible, because no velocity gradient
was measured along the minor axis of NGC 4889 (Sect. 5).
.
For run 2, we
estimated the effect to be negligible, because no velocity gradient
was measured along the minor axis of NGC 4889 (Sect. 5).
In the case of NGC 4874, the 1D spectra obtained from 40 adjacent columns did not reach the required S/N. For those regions we used the following iterative procedure:
- 1.
- We selected N regions on the slit which are
 pixels
wide. Each region corresponds to a two-dimensional spectrum, which
we call ``stripe'' Si (with
i=1, ..., N). Each of the N stripes is composed of M one-dimensional adjacent
spectra, with the wavelength direction oriented along columns.
pixels
wide. Each region corresponds to a two-dimensional spectrum, which
we call ``stripe'' Si (with
i=1, ..., N). Each of the N stripes is composed of M one-dimensional adjacent
spectra, with the wavelength direction oriented along columns.
- 2.
- We extracted the one-dimensional spectrum
 ,
by summing
the stripe along the slit direction, and assigned the luminosity
weighted central position Ri (in pixels) on the slit.
We associated thus a spectrum
and a central
position
,
by summing
the stripe along the slit direction, and assigned the luminosity
weighted central position Ri (in pixels) on the slit.
We associated thus a spectrum
and a central
position
 to each region of the slit.
- 3.
- We measured the radial velocity
 of the spectrum
.
The radial velocity measurements are described in
Sect. 5.
of the spectrum
.
The radial velocity measurements are described in
Sect. 5.
- 4.
- We selected a reference spectrum
 .
The other
N-1 spectra were then shifted to the radial velocity
.
The other
N-1 spectra were then shifted to the radial velocity
 of the reference spectrum. The
  applied to
the
applied to
the
 spectrum was
 ,
where
,
where  (in
(in
 )
is the (unknown) velocity gradient
along the slit.
The shifted spectra were then combined together to form the total
spectrum
)
is the (unknown) velocity gradient
along the slit.
The shifted spectra were then combined together to form the total
spectrum
 in the radial bin centered at
 .
was determined via an iterative procedure that minimized
the line widths in the combined spectrum
.
.
was determined via an iterative procedure that minimized
the line widths in the combined spectrum
.
![\begin{figure}
\par\includegraphics[width=9cm,clip]{14476fg03a.ps}\par\includegr...
...{14476fg03c.ps}\par\includegraphics[width=9cm,clip]{14476fg03d.ps}
\end{figure}](/articles/aa/full_html/2010/11/aa14476-10/Timg50.png)
Figure 3: Examples of kinematic fits. Black: galaxy spectrum, green: portion of galaxy spectrum excluded in the fit, red: best fit template model. The S/N ratio per pixel of the spectra in panels from A to G are: 61, 15, 13, 10, 9, 8, 8, respectively. All spectra are normalized to the value of the best fit model at 5100 Å.
Open with DEXTER ![\begin{figure}\par\includegraphics[width=9cm,clip]{14476fg03e.ps}\par\includegra...
...]{14476fg03f.ps}\par\includegraphics[width=9cm,clip]{14476fg03g.ps}
\end{figure}](/articles/aa/full_html/2010/11/aa14476-10/Timg51.png)
Figure 3: continued.
Open with DEXTER
![\begin{figure}
\par\includegraphics[width=9cm,clip]{14476fg04.ps}
\end{figure}](/articles/aa/full_html/2010/11/aa14476-10/img52.png)
|
Figure 4:
Radial velocity ( upper panels) and velocity dispersion
profiles ( lower panels) along the slit in run 1 (velocities
are expressed in the heliocentric reference system). Measurements
along the slit are divided in two panels, with left panels
referring to the part of the slit close to NGC 4889 and right
panels referring to the part of the slit close to NGC 4874.
Crosses: data from Mehlert et al. (2000) shifted to the systemic
velocities, 6495
|
| Open with DEXTER | |
![\begin{figure}
\par\includegraphics[width=9cm,clip]{14476fg05.ps}
\end{figure}](/articles/aa/full_html/2010/11/aa14476-10/img53.png)
|
Figure 5: Stellar kinematics along the minor axis of NGC 4889. Crosses: data from Corsini et al. (2008), filled circles: measurements from this paper for run 2. |
| Open with DEXTER | |
5 Stellar kinematics
Stellar kinematics from the extracted spectra in the radial bins were measured using the ``Penalized Pixel-Fitting method'' ( PPXF, Cappellari & Emsellem 2004). A library of kinematic template stars (MILES library, Sánchez-Blázquez et al. 2006) was used together with stellar templates observed during the observations. The template spectra of the MILES library were convolved with a Gaussian function to match the FOCAS spectral resolution. We show some of the fit results in Fig. 3: the innermost and outermost spectra extracted along the minor axis of NGC 4889, the three outermost spectra along the major axis of NGC 4889 and the two spectra of NGC 4874 are also shown.
The wavelength ranges used for the fitting are
![]() for run 1, and
for run 1, and
![]() for run 2. Bad pixels coming from residual cosmic rays or emission
lines were properly masked and not included in the fitting procedure.
for run 2. Bad pixels coming from residual cosmic rays or emission
lines were properly masked and not included in the fitting procedure.
For each radial bin, the PPXF code built the optimal template
which represents the observed spectrum by a linear combination of
different stellar templates. The use of a large spectral library and the
creation of one optimal template for each radial bin minimized errors
in the kinematics due to template mismatch.
In the outermost bins (![]() kpc in run 1 and |R| > 20 kpc in run
2) the construction of the optimal stellar template in PPXF
failed, because the absorption line features are less
pronounced. The kinematics in these regions were measured using the
best template obtained from the nearest bin in which it could be
otained. Referring to Fig. 3, spectra in panels D, E, F
and G were fitted using the optimal template determined when fitting
the spectrum in panel C. The spectrum in panel B was fitted with the
optimal template obtained fitting the spectrum at 16 kpc (not shown
in the figure).
This approximation might introduce some systematic errors in the
kinematics of the outer bins due to template mismatch. Nevertheless,
in the radial bins (
kpc in run 1 and |R| > 20 kpc in run
2) the construction of the optimal stellar template in PPXF
failed, because the absorption line features are less
pronounced. The kinematics in these regions were measured using the
best template obtained from the nearest bin in which it could be
otained. Referring to Fig. 3, spectra in panels D, E, F
and G were fitted using the optimal template determined when fitting
the spectrum in panel C. The spectrum in panel B was fitted with the
optimal template obtained fitting the spectrum at 16 kpc (not shown
in the figure).
This approximation might introduce some systematic errors in the
kinematics of the outer bins due to template mismatch. Nevertheless,
in the radial bins (
![]() kpc in run 2), we did not
observe significant differences in the kinematics when either the
``central'' optimal template at R=-4.9 kpc or the ``local''
optimal templates, found by PPXF for those bins, were
used. This confirmed that errors on the kinematics caused by
template mismatch were negligible for the inner bins, and gave us
confidence that the template mismatch is not important in the
outer bins. Errors on the measured kinematics were determined by
means of Monte Carlo simulations, analyzing spectra generated from
the best fit template model and adding the appropriate noise.
kpc in run 2), we did not
observe significant differences in the kinematics when either the
``central'' optimal template at R=-4.9 kpc or the ``local''
optimal templates, found by PPXF for those bins, were
used. This confirmed that errors on the kinematics caused by
template mismatch were negligible for the inner bins, and gave us
confidence that the template mismatch is not important in the
outer bins. Errors on the measured kinematics were determined by
means of Monte Carlo simulations, analyzing spectra generated from
the best fit template model and adding the appropriate noise.
The measured radial velocities were then
shifted to the heliocentric reference system using the MIDAS![]() task COMPUT/BARY.
task COMPUT/BARY.
The fitted mean velocity, velocity dispersion and Gauss-Hermite moments (van der Marel & Franx 1993; Gerhard 1993) and their errors are shown in Figs. 4 and 5 for runs 1 and 2, respectively, and are listed in Table 2. Gauss-Hermite moments were fitted only for spectra within |R|<20 kpc along the minor axis.
6 Line strength indices
Line strength indices were measured for NGC 4889 using observations
from both runs. The spectra of NGC 4874 did not have enough S/N for this.
We measured the H![]() ,
Mg1, Mg2, Mg b, Fe 5270 and Fe 5335 line-strength indices as defined by Faber et al. (1985) and
Worthey et al. (1994). The spectra were convolved with a Gaussian
function to match the spectral resolution of the Lick system (
,
Mg1, Mg2, Mg b, Fe 5270 and Fe 5335 line-strength indices as defined by Faber et al. (1985) and
Worthey et al. (1994). The spectra were convolved with a Gaussian
function to match the spectral resolution of the Lick system (
![]() Å at 5100 Å, Worthey & Ottaviani 1997). Three Lick standard stars
observed during the runs were used to correct for offsets to the Lick
system. The measured offsets (FOCAS - Lick) are: 0.03 Å (H
Å at 5100 Å, Worthey & Ottaviani 1997). Three Lick standard stars
observed during the runs were used to correct for offsets to the Lick
system. The measured offsets (FOCAS - Lick) are: 0.03 Å (H![]() ), -0.30 Å (Fe 5105), -0.028 mag (Mg1), -0.016 mag (Mg2), -0.037 Å (Mg b), -0.36 Å (Fe 5270), 0.024 Å (Fe 5335) and 0.024 Å (Fe 5406).
), -0.30 Å (Fe 5105), -0.028 mag (Mg1), -0.016 mag (Mg2), -0.037 Å (Mg b), -0.36 Å (Fe 5270), 0.024 Å (Fe 5335) and 0.024 Å (Fe 5406).
Table 2: Stellar kinematics and line strenght indices for NGC 4874 (run 1) and NGC 4889 (runs 1 and 2).
![\begin{figure}
\par\includegraphics[width=8.5cm,clip]{14476fg06a.ps}\includegraphics[width=8.5cm,clip]{14476fg06b.ps}
\end{figure}](/articles/aa/full_html/2010/11/aa14476-10/img61.png)
|
Figure 6: Line-strength Lick indices for NGC 4889 measured along the major ( left panel) and the minor axis ( right panel). Crosses: data from Mehlert et al. (2000) (major axis) and Corsini et al. (2008) (minor axis). Filled circles: measurements from this paper. Solid lines indicate the systematic deviations of the line-strength measurements caused by adding different residual sky levels to the extracted galaxy spectrum. From top to bottom, the residual sky levels we added are +2% (i.e. sky subtraction is underestimated by 2%), +1%, +0.5%, -0.5%, -1%, -2% (i.e. sky subtraction overestimated by 2%). See Sect. 3 for details. |
| Open with DEXTER | |
No focus correction was applied because atmospheric seeing was the dominant effect during observations.
Errors on line-strength indices were determined via Monte Carlo simulations, which accounted for the errors on radial velocity measurement also. Errors from Monte Carlo simulations are consistent with those predicted by the analytic formulae of Cardiel et al. (1998).
In the following we describe the details of additional corrections we
applied to the measurements in order to take into account
instrumental effects. The final measured values are listed in
Table 2 and are shown in Fig. 6
together with the Mehlert et al. (2000) data along the major axis, and
the Corsini et al. (2008) data along the minor axis![]() .
.
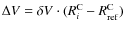
6.1 Correction for intrinsic broadening
The line-strength measurements were corrected for the galaxy
intrinsic broadening following the procedure described in
Kuntschner et al. (2006). Coefficients CI for each index
I were determined as the ratio of i) the ``intrinsic'' values
(I0, in Angstrom) measured on the optimal stellar template; and ii)
the line-of-sight-velocity-distribution ``modified'' values
(
![]() )
measured on the best fit model (i.e. the optimal
template convolved with the galaxy LOSVD). Corrected galaxy line
strength indices (in Ångstrom) were then given by:
)
measured on the best fit model (i.e. the optimal
template convolved with the galaxy LOSVD). Corrected galaxy line
strength indices (in Ångstrom) were then given by:
|
(1) |
6.2 Correction for residual emission lines
The long-slit spectra for the NGC 4889 minor axis showed strong
unresolved emission lines in the wavelength regions adjacent to the
Mg I bandpass and the H![]() blue pseudo-continuum.
These strong lines were at wavelengths that are not associated with
known galaxy emission lines or sky/auroral lines. Our conclusion was
that they may be associated with internal reflections in the
spectrograph. To measure the spectral indices in the regions affected
by the unidentified emission lines, we simultaneously fit the galaxy
spectrum with a stellar template plus Gaussian functions at the
wavelength of the detected emissions. The best-fit Gaussians were then
subtracted from the spectrum, to remove the observed emission lines.
As a further test, we checked the measured values of the line-strength
indices against the measurements on the best-fit stellar
template, convolved with the galaxy line of sight velocity
distribution determined in Sect. 5.
The two sets of values were consistent.
blue pseudo-continuum.
These strong lines were at wavelengths that are not associated with
known galaxy emission lines or sky/auroral lines. Our conclusion was
that they may be associated with internal reflections in the
spectrograph. To measure the spectral indices in the regions affected
by the unidentified emission lines, we simultaneously fit the galaxy
spectrum with a stellar template plus Gaussian functions at the
wavelength of the detected emissions. The best-fit Gaussians were then
subtracted from the spectrum, to remove the observed emission lines.
As a further test, we checked the measured values of the line-strength
indices against the measurements on the best-fit stellar
template, convolved with the galaxy line of sight velocity
distribution determined in Sect. 5.
The two sets of values were consistent.
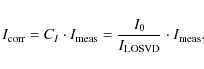
6.3 Systematic effects caused by sky subtraction
We then quantified the systematic errors in the line strength indices
measurements caused by sky subtraction . A residual sky contribution
of ![]() 0.5%,
0.5%, ![]() 1% and
1% and ![]() 2% of the subtracted sky
spectrum
2% of the subtracted sky
spectrum![]() was added to the
extracted galaxy spectra, and then we performed measurements of the
line-strength indices on these modified spectra. Within the errorbars,
these new values were consistent with the measurements performed on the
best background subtracted galaxy spectra, but for the Mg2 index. This was probably due to the fact that the Mg2 pseudo-continua were defined on spectral regions not adjacent to the
index passband (unlike for the other spectral indices), therefore
variations of the sky level have a larger effect on this index.
was added to the
extracted galaxy spectra, and then we performed measurements of the
line-strength indices on these modified spectra. Within the errorbars,
these new values were consistent with the measurements performed on the
best background subtracted galaxy spectra, but for the Mg2 index. This was probably due to the fact that the Mg2 pseudo-continua were defined on spectral regions not adjacent to the
index passband (unlike for the other spectral indices), therefore
variations of the sky level have a larger effect on this index.
7 Results and discussion
In NGC 4874 the measured stellar kinematics extend out to ![]() 50 kpc (
50 kpc (![]()
![]() )
along its East side. Measurements of line
strength indices were not possible.
)
along its East side. Measurements of line
strength indices were not possible.
In NGC 4889 our measurements extend out to 65 kpc (![]()
![]() )
along its West side (close to its major axis) and
)
along its West side (close to its major axis) and ![]() 35 kpc (
35 kpc (![]()
![]() )
along its photometric minor axis. This represents the
most spatially extended datasets with both stellar kinematics
and line strength indices for a brightest cluster galaxy.
)
along its photometric minor axis. This represents the
most spatially extended datasets with both stellar kinematics
and line strength indices for a brightest cluster galaxy.
7.1 Kinematics
NGC 4874. In NGC 4874 the outer mean velocity along the line of
sight is
![]()
![]() ,
about
,
about ![]() 55
55
![]() lower than
the galaxy systemic velocity (
lower than
the galaxy systemic velocity (
![]()
![]() ,
as
reported by Smith et al. 2004). It is not straightforward to
associate it with rotation or tidal effects, given the errors on the
current measurements and the large uncertainties on the galaxy
systemic velocity. As examples, de Vaucouleurs et al. (1991, RC3 hereafter) report
a systemic velocity of
,
as
reported by Smith et al. 2004). It is not straightforward to
associate it with rotation or tidal effects, given the errors on the
current measurements and the large uncertainties on the galaxy
systemic velocity. As examples, de Vaucouleurs et al. (1991, RC3 hereafter) report
a systemic velocity of
![]()
![]() ,
while NED reports a
systemic velocity of
,
while NED reports a
systemic velocity of
![]()
![]() .
The mean outer velocity
dispersion in NGC 4874 is
.
The mean outer velocity
dispersion in NGC 4874 is
![]()
![]() ,
which is
consistent with the central value found by Smith et al. (2004),
suggesting a flat velocity dispersion profile with radius.
,
which is
consistent with the central value found by Smith et al. (2004),
suggesting a flat velocity dispersion profile with radius.
NGC 4889.
In NGC 4889 the mean outer velocity is
![]()
![]() ,
which
is
,
which
is ![]() 169
169
![]() lower than the galaxy systemic velocity (
lower than the galaxy systemic velocity (
![]()
![]() ,
as reported by Moore et al. 2002). The measured
velocity offset is significant when compared with measurements errors
and uncertainties on the systemic velocity. Although rotation in the
halos of ellipticals is not rare (e.g. Coccato et al. 2009; Rix et al. 1999),
it is not straightforward to consider the velocity offset as evidence
of rotation, since we miss measurements on the East side of the galaxy.
The outer mean velocity dispersion we measured in NGC 4889 is
,
as reported by Moore et al. 2002). The measured
velocity offset is significant when compared with measurements errors
and uncertainties on the systemic velocity. Although rotation in the
halos of ellipticals is not rare (e.g. Coccato et al. 2009; Rix et al. 1999),
it is not straightforward to consider the velocity offset as evidence
of rotation, since we miss measurements on the East side of the galaxy.
The outer mean velocity dispersion we measured in NGC 4889 is
![]()
![]() ,
consistent with the outermost measurements (
,
consistent with the outermost measurements (![]() 10'') by Moore et al. (2002),
revealing a flat velocity dispersion profile outside the central drop.
10'') by Moore et al. (2002),
revealing a flat velocity dispersion profile outside the central drop.
Gerhard et al. (2007) developed a model for the core of the Coma cluster whereby the two BCGs, NGC 4874 and NGC 4889, are in the process of merging, tidally stripping each others' halos to create an elongated distribution of intracluster light in which they are embedded. It is worth noting that, out to the radii probed by the present observations, the velocity dispersion profiles of NGC 4874 and NGC 4889 are nearly constant and indicative of stars still bound to the central galaxy. This is consistent with recent velocity dispersion profiles measurements based on planetary nebulae and globular clusters for local brightest cluster galaxies (e.g. Coccato et al. 2009; Doherty et al. 2009; Proctor et al. 2009; Schuberth et al. 2009; McNeil et al. 2010, A&A, submitted). These galaxies do not show an increase in the velocity dispersion profile as observed in other BCGs (e.g NGC 6166 in Kelson et al. 2002), which was interpreted as generated by stars not bound to the galaxy but free floating in the cluster potential.
We can thus compare the kinematic properties of the outer regions of
NGC 4874 and NGC 4889 with the kinematic properties of the outer halos
of other early-type galaxies. To do this, we refer to the results of
Coccato et al. (2009) based on radial velocities of Planetary Nebulae in
the halos of early-type galaxies. Their sample covers the range 50
![]()
![]()
![]() of velocity dispersion in
the outer halo. The two galaxies studied in this paper fall in the
upper
of velocity dispersion in
the outer halo. The two galaxies studied in this paper fall in the
upper ![]() range of the galaxy sample explored by
Coccato et al. (2009) and this enables us to extend their
range of the galaxy sample explored by
Coccato et al. (2009) and this enables us to extend their ![]() range. Following Coccato et al. (2009), in Fig. 7
we compare the halo velocity dispersion with other galaxy properties,
range. Following Coccato et al. (2009), in Fig. 7
we compare the halo velocity dispersion with other galaxy properties,
![]() (we assume that the observed velocity offset is due to
rotation), total X-ray luminosity (
(we assume that the observed velocity offset is due to
rotation), total X-ray luminosity (
![]() erg s-1for NGC 4874 and
erg s-1for NGC 4874 and
![]() erg s-1 for NGC 4889, from
Pellegrini 2005) and total B-band magnitude (
erg s-1 for NGC 4889, from
Pellegrini 2005) and total B-band magnitude (
![]() for
NGC 4874 and
for
NGC 4874 and
![]() for NGC 4889, from RC3). Both NGC 4874 and
NGC 4889 follow the same trend found in other early-type galaxies,
therefore supporting the earlier statement that the stars in their
halos are still bound to the inner galaxies in the radial range
explored in this work.
for NGC 4889, from RC3). Both NGC 4874 and
NGC 4889 follow the same trend found in other early-type galaxies,
therefore supporting the earlier statement that the stars in their
halos are still bound to the inner galaxies in the radial range
explored in this work.
![\begin{figure}
\par\includegraphics[width=8.5cm,clip]{14476fg07.ps}
\end{figure}](/articles/aa/full_html/2010/11/aa14476-10/img83.png)
|
Figure 7:
Correlations between the outermost measured value of the halo
velocity dispersion and mean
|
| Open with DEXTER | |
7.2 Line strength indices
In NGC 4889, the measured set of Lick indices provides information in
the radial interval from ![]() 7 to
7 to ![]() 65 kpc, and is
complementary to data available for the central regions
(Mehlert et al. 2000; Corsini et al. 2008).
65 kpc, and is
complementary to data available for the central regions
(Mehlert et al. 2000; Corsini et al. 2008).
In the region of overlap the current data set and the published values
agree along the minor axis (![]() kpc), but for H
kpc), but for H![]() .
.
In the central parts of the galaxy, the mean velue from
Corsini et al. (2008) data is higher than the inward extrapolation of
our data by 0.3 Å. Their outermost central value differs from ours
of 1.1 Å at the same radius (![]() kpc, see
Fig. 6).
kpc, see
Fig. 6).
The difference could be related either to the limited number of
stars we used to correct the FOCAS observations to the Lick system,
or to sky subtraction, affecting Corsini's measurements (see Sect. 6). But in these cases we would expect a discrepancy
also in other indices, and not only in H![]() .
Another reason could
be the presence of emission lines, but neither in our spectra nor in
Corsini's spectra H
.
Another reason could
be the presence of emission lines, but neither in our spectra nor in
Corsini's spectra H![]() emission lines were detected at 5 kpc.
Therefore, the reason for the discrepancy remains unclear.
emission lines were detected at 5 kpc.
Therefore, the reason for the discrepancy remains unclear.
Values of H![]() range from 0.5 to 2.3 Å. Line strength indices
related to Mg I and
range from 0.5 to 2.3 Å. Line strength indices
related to Mg I and
![]() show declining profiles, from the
central values of Mg2
show declining profiles, from the
central values of Mg2 ![]() Å, Mg b
Å, Mg b ![]() Å and
Å and
![]() Å, to outer values of Mg2
Å, to outer values of Mg2 ![]() Å,
Mg b
Å,
Mg b ![]() Å and
Å and
![]() Å.
Å.
In Coccato et al. (2010) the combined set of line strength indices for NGC 4889 is used to derive age, metallicity and alpha-enhancement for single stellar population models and their radial gradients from the center out to 60 kpc. There we find evidence for a change in the stellar population gradient and content, suggesting a different evolutionary history between the galaxy and its halo. We refer to this forthcoming paper for a detailed discussion of the implications of these measurements for the properties of the stellar populations in NGC 4889, and for the constraints they put on the galaxy formation mechanism.
AcknowledgementsThe authors wish to thank T. Hattori for the professional support during the observations and for providing the FOCASRED package used in the data reduction; R. Bender, E. Iodice, H. Kuntschner, L. Morelli, R. P. Saglia, D. Thomas and J. Thomas for useful discussions.
This research has made use of the NASA/IPAC Extragalactic Database (NED) which is operated by the Jet Propulsion Laboratory, California Institute of Technology, under contract with the National Aeronautics and Space Administration, and of the ``Penalized Pixel-Fitting method'' by Cappellari & Emsellem (2004).
References
- Binney, J., & Tremaine, S. 1987, Galactic dynamics (Princeton, NJ: Princeton University Press), 747 [Google Scholar]
- Brough, S., Proctor, R., Forbes, D. A., et al. 2007, MNRAS, 378, 1507 [NASA ADS] [CrossRef] [Google Scholar]
- Cappellari, M., & Emsellem, E. 2004, PASP, 116, 138 [NASA ADS] [CrossRef] [Google Scholar]
- Cardiel, N., Gorgas, J., Cenarro, J., & Gonzalez, J. J. 1998, A&AS, 127, 597 [NASA ADS] [CrossRef] [EDP Sciences] [Google Scholar]
- Carter, D., Bridges, T. J., & Hau, G. K. T. 1999, MNRAS, 307, 131 [NASA ADS] [CrossRef] [Google Scholar]
- Coccato, L., Gerhard, O., Arnaboldi, M., et al. 2009, MNRAS, 394, 1249 [NASA ADS] [CrossRef] [Google Scholar]
- Coccato, L., Gerhard, O., & Arnaboldi, M. 2010, MNRAS, 407, L26 [NASA ADS] [Google Scholar]
- Corsini, E. M., Wegner, G., Saglia, R. P., et al. 2008, ApJS, 175, 462 [NASA ADS] [CrossRef] [Google Scholar]
- de Vaucouleurs, G., de Vaucouleurs, A., Corwin, Jr., H. G., et al. 1991, Third Reference Catalogue of Bright Galaxies (RC3) [Google Scholar]
- Doherty, M., Arnaboldi, M., Das, P., et al. 2009, A&A, 502, 771 [NASA ADS] [CrossRef] [EDP Sciences] [Google Scholar]
- Dubinski, J. 1998, ApJ, 502, 141 [NASA ADS] [CrossRef] [Google Scholar]
- Faber, S. M., Friel, E. D., Burstein, D., & Gaskell, C. M. 1985, ApJS, 57, 711 [NASA ADS] [CrossRef] [Google Scholar]
- Fisher, D., Franx, M., & Illingworth, G. 1995, ApJ, 448, 119 [NASA ADS] [CrossRef] [Google Scholar]
- Gavazzi, G., Boselli, A., Donati, A., Franzetti, P., & Scodeggio, M. 2003, A&A, 400, 451 [NASA ADS] [CrossRef] [EDP Sciences] [Google Scholar]
- Gerhard, O. E. 1993, MNRAS, 265, 213 [NASA ADS] [CrossRef] [Google Scholar]
- Gerhard, O., Arnaboldi, M., Freeman, K. C., et al. 2007, A&A, 468, 815 [NASA ADS] [CrossRef] [EDP Sciences] [Google Scholar]
- Gonzalez, A. H., Zabludoff, A. I., & Zaritsky, D. 2005, ApJ, 618, 195 [Google Scholar]
- Jorgensen, I., Franx, M., & Kjaergaard, P. 1995, MNRAS, 273, 1097 [NASA ADS] [CrossRef] [Google Scholar]
- Kashikawa, N., Aoki, K., Asai, R., et al. 2002, PASJ, 54, 819 [NASA ADS] [Google Scholar]
- Kelson, D. D., Zabludoff, A. I., Williams, K. A., et al. 2002, ApJ, 576, 720 [NASA ADS] [CrossRef] [Google Scholar]
- Kuntschner, H., Emsellem, E., Bacon, R., et al. 2006, MNRAS, 369, 497 [NASA ADS] [CrossRef] [Google Scholar]
- Loubser, S. I., Sánchez-Blázquez, P., Sansom, A. E., & Soechting, I. K. 2009, MNRAS, 398, 133 [NASA ADS] [CrossRef] [Google Scholar]
- Loubser, S. I., Sansom, A. E., Sánchez-Blázquez, P., Soechting, I. K., & Bromage, G. E. 2008, MNRAS, 391, 1009 [NASA ADS] [CrossRef] [Google Scholar]
- Massey, P., & Foltz, C. B. 2000, PASP, 112, 566 [NASA ADS] [CrossRef] [Google Scholar]
- Mehlert, D., Saglia, R. P., Bender, R., & Wegner, G. 2000, A&AS, 141, 449 [NASA ADS] [CrossRef] [EDP Sciences] [Google Scholar]
- Moore, S. A. W., Lucey, J. R., Kuntschner, H., & Colless, M. 2002, MNRAS, 336, 382 [NASA ADS] [CrossRef] [Google Scholar]
- Murante, G., Giovalli, M., Gerhard, O., et al. 2007, MNRAS, 377, 2 [Google Scholar]
- Osterbrock, D. E., Fulbright, J. P., Martel, A. R., et al. 1996, PASP, 108, 277 [NASA ADS] [CrossRef] [Google Scholar]
- Pellegrini, S. 2005, MNRAS, 364, 169 [NASA ADS] [CrossRef] [Google Scholar]
- Proctor, R. N., Forbes, D. A., Romanowsky, A. J., et al. 2009, MNRAS, 398, 91 [NASA ADS] [CrossRef] [Google Scholar]
- Rix, H.-W., Carollo, C. M., & Freeman, K. 1999, ApJ, 513, L25 [NASA ADS] [CrossRef] [Google Scholar]
- Sánchez-Blázquez, P., Peletier, R. F., Jiménez-Vicente, J., et al. 2006, MNRAS, 371, 703 [NASA ADS] [CrossRef] [Google Scholar]
- Schuberth, Y., Richtler, T., Hilker, M., et al. 2010, A&A, 513, A52 [NASA ADS] [CrossRef] [EDP Sciences] [Google Scholar]
- Smith, R. J., Hudson, M. J., Nelan, J. E., et al. 2004, AJ, 128, 1558 [NASA ADS] [CrossRef] [Google Scholar]
- Spolaor, M., Forbes, D. A., Hau, G. K. T., Proctor, R. N., & Brough, S. 2008a, MNRAS, 385, 667 [NASA ADS] [CrossRef] [Google Scholar]
- Spolaor, M., Forbes, D. A., Proctor, R. N., Hau, G. K. T., & Brough, S. 2008b, MNRAS, 385, 675 [NASA ADS] [CrossRef] [Google Scholar]
- Trager, S. C., Faber, S. M., & Dressler, A. 2008, MNRAS, 386, 715 [NASA ADS] [CrossRef] [Google Scholar]
- van der Marel, R. P., & Franx, M. 1993, ApJ, 407, 525 [NASA ADS] [CrossRef] [Google Scholar]
- van Dokkum, P. G. 2001, PASP, 113, 1420 [NASA ADS] [CrossRef] [Google Scholar]
- Worthey, G., & Ottaviani, D. L. 1997, ApJS, 111, 377 [NASA ADS] [CrossRef] [Google Scholar]
- Worthey, G., Faber, S. M., Gonzalez, J. J., & Burstein, D. 1994, ApJS, 94, 687 [NASA ADS] [CrossRef] [Google Scholar]
Footnotes
- ... 4889
- Based on data collected at Subaru Telescope, which is operated by the National Astronomical Observatory of Japan.
- ...
1 Gyr
- Estimated for distance R=50 kpc and
circular velocity

 ,
e.g. Binney & Tremaine (1987).
,
e.g. Binney & Tremaine (1987).
- ... IRAF
- IRAF is distributed by NOAO, which is operated by AURA Inc., under contract with the National Science Foundation.
- ... FOCASRED
- Information about the FOCASRED package can be obtained at the web page: http://www.naoj.org/Observing/Instruments/FOCAS/Detail/UsersGuide/DataReduction/focasred.html
- ... columns
- The spectra were oriented to have the dispersion direction along the vertical axis, and the slit aligned with the horizontal axis.
- ... slit
- This gradient was computed from the velocity difference
measured at the slit edges (
 800
)
divided by the number of pixels in the slit (960).
800
)
divided by the number of pixels in the slit (960).
- ... MIDAS
- MIDAS is developed and maintained by the European Southern Observatory.
- ... axis
- We show the mean iron
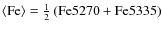 radial profiles and not the profiles of both iron indices to facilitate
the comparison with the literature, where only
radial profiles and not the profiles of both iron indices to facilitate
the comparison with the literature, where only  is provided.
- ...
spectrum
- Residual sky contribution larger than 2% would produce detectable sky features either in emission or absorption in the galaxy spectra. 2% is also the maximum difference between the continuum of the sky measured at blank fields and the one measured simultaneously to galaxy observations (see Sect. 3 and Fig. 2 for discussion).
All Tables
Table 1: Summary of the observing log and instrumental set up.
Table 2: Stellar kinematics and line strenght indices for NGC 4874 (run 1) and NGC 4889 (runs 1 and 2).
All Figures
|
|
Figure 1: Optical DSS image of the Coma cluster core. North is up, East is Left. The two red lines with the central gap represent the portion of the slit covered by the 2 CCDs in the FOCAS spectrograph. The scale in kpc given on the bottom left corner is computed assuming a distance of 97.7 Mpc, which is the average of the distances to NGC 4889 and NGC 4874 as given by NED. |
| Open with DEXTER | |
| In the text | |
|
|
Figure 2:
Upper panel: difference between the mean sky spectrum
measured at the offset position on the blank field and the sky
spectrum measured at the long-slit center (run 1). The mean value of
the difference is |
| Open with DEXTER | |
| In the text | |
![\begin{figure}
\par\includegraphics[width=9cm,clip]{14476fg03a.ps}\par\includegr...
...{14476fg03c.ps}\par\includegraphics[width=9cm,clip]{14476fg03d.ps}
\end{figure}](/articles/aa/full_html/2010/11/aa14476-10/img50.png)
|
Figure 3: Examples of kinematic fits. Black: galaxy spectrum, green: portion of galaxy spectrum excluded in the fit, red: best fit template model. The S/N ratio per pixel of the spectra in panels from A to G are: 61, 15, 13, 10, 9, 8, 8, respectively. All spectra are normalized to the value of the best fit model at 5100 Å. |
| Open with DEXTER | |
| In the text | |
![\begin{figure}\par\includegraphics[width=9cm,clip]{14476fg03e.ps}\par\includegra...
...]{14476fg03f.ps}\par\includegraphics[width=9cm,clip]{14476fg03g.ps}
\end{figure}](/articles/aa/full_html/2010/11/aa14476-10/img51.png)
|
Figure 3: continued. |
| Open with DEXTER | |
| In the text | |
|
|
Figure 4:
Radial velocity ( upper panels) and velocity dispersion
profiles ( lower panels) along the slit in run 1 (velocities
are expressed in the heliocentric reference system). Measurements
along the slit are divided in two panels, with left panels
referring to the part of the slit close to NGC 4889 and right
panels referring to the part of the slit close to NGC 4874.
Crosses: data from Mehlert et al. (2000) shifted to the systemic
velocities, 6495
|
| Open with DEXTER | |
| In the text | |
|
|
Figure 5: Stellar kinematics along the minor axis of NGC 4889. Crosses: data from Corsini et al. (2008), filled circles: measurements from this paper for run 2. |
| Open with DEXTER | |
| In the text | |
|
|
Figure 6: Line-strength Lick indices for NGC 4889 measured along the major ( left panel) and the minor axis ( right panel). Crosses: data from Mehlert et al. (2000) (major axis) and Corsini et al. (2008) (minor axis). Filled circles: measurements from this paper. Solid lines indicate the systematic deviations of the line-strength measurements caused by adding different residual sky levels to the extracted galaxy spectrum. From top to bottom, the residual sky levels we added are +2% (i.e. sky subtraction is underestimated by 2%), +1%, +0.5%, -0.5%, -1%, -2% (i.e. sky subtraction overestimated by 2%). See Sect. 3 for details. |
| Open with DEXTER | |
| In the text | |
|
|
Figure 7:
Correlations between the outermost measured value of the halo
velocity dispersion and mean
|
| Open with DEXTER | |
| In the text | |
Copyright ESO 2010
Current usage metrics show cumulative count of Article Views (full-text article views including HTML views, PDF and ePub downloads, according to the available data) and Abstracts Views on Vision4Press platform.
Data correspond to usage on the plateform after 2015. The current usage metrics is available 48-96 hours after online publication and is updated daily on week days.
Initial download of the metrics may take a while.