| Issue |
A&A
Volume 518, July-August 2010
Herschel: the first science highlights
|
|
|---|---|---|
| Article Number | A59 | |
| Number of page(s) | 17 | |
| Section | Extragalactic astronomy | |
| DOI | https://doi.org/10.1051/0004-6361/200913430 | |
| Published online | 03 September 2010 | |
Observations and modeling of the dust emission from the H2-bright galaxy-wide shock in Stephan's Quintet
P. Guillard1,2 - F. Boulanger1 - M. E. Cluver2 - P. N. Appleton3 - G. Pineau des Forêts1,4 - P. Ogle2
1 - Institut d'Astrophysique Spatiale (IAS), UMR 8617, CNRS, Université
Paris-Sud 11, Bâtiment 121, 91405 Orsay Cedex, France
2 - Spitzer Science Center, IPAC, California
Institute of Technology, Mail code 100-22, Pasadena, CA 91125, USA
3 - NASA Herschel Science Center (NHSC), IPAC,
California Institute of Technology, Mail code 100-22, Pasadena, CA
91125, USA
4 - LERMA, UMR 8112, CNRS, Observatoire de Paris, 61 avenue de
l'Observatoire, 75014 Paris, France
Received 8 October 2009 / Accepted 28 March 2010
Abstract
Context. Spitzer Space Telescope
observations have detected powerful mid-infrared (mid-IR) H2
rotational line emission from the X-ray emitting
large-scale shock (![]()
![]() kpc2)
associated with a galaxy collision
in Stephan's Quintet (SQ). Because H2 forms
on dust grains, the presence of H2 is
physically linked to the survival of dust, and we expect some dust
emission to originate in the molecular gas.
kpc2)
associated with a galaxy collision
in Stephan's Quintet (SQ). Because H2 forms
on dust grains, the presence of H2 is
physically linked to the survival of dust, and we expect some dust
emission to originate in the molecular gas.
Aims. To test this interpretation,
IR observations and dust modeling are used to identify and
characterize the thermal dust emission from the shocked molecular gas.
Methods. The spatial distribution of the IR emission
allows us to isolate the faint PAH and dust continuum emission
associated with the molecular gas in the SQ shock. We model
the spectral energy distribution (SED) of this emission, and fit it to Spitzer
observations. The radiation field is determined with GALEX
UV, HST V-band, and
ground-based near-IR observations. We consider two limiting cases for
the structure of the H2 gas: it is
either diffuse and penetrated by UV radiation, or fragmented into
clouds that are optically thick to UV.
Results. Faint PAH and dust
continuum emission are detected in the
SQ shock, outside star-forming regions. The ![]() m flux ratio
in the shock is remarkably close to that of the diffuse Galactic
interstellar medium, leading to a Galactic PAH/VSG
abundance ratio. However, the properties of the shock inferred
from the PAH emission spectrum differ from those of the Galaxy,
which may be indicative of an enhanced fraction of large and
neutrals PAHs. In both models (diffuse or clumpy H2 gas),
the IR SED is consistent with the expected emission from dust
associated with the warm (>150 K) H2 gas,
heated by a UV radiation field of intensity comparable to that of the
solar neighborhood. This is in agreement with GALEX UV
observations that show that the intensity of the radiation field in the
shock is
m flux ratio
in the shock is remarkably close to that of the diffuse Galactic
interstellar medium, leading to a Galactic PAH/VSG
abundance ratio. However, the properties of the shock inferred
from the PAH emission spectrum differ from those of the Galaxy,
which may be indicative of an enhanced fraction of large and
neutrals PAHs. In both models (diffuse or clumpy H2 gas),
the IR SED is consistent with the expected emission from dust
associated with the warm (>150 K) H2 gas,
heated by a UV radiation field of intensity comparable to that of the
solar neighborhood. This is in agreement with GALEX UV
observations that show that the intensity of the radiation field in the
shock is ![]() [Habing units].
[Habing units].
Conclusions.
The presence of PAHs and dust
grains in the high-speed (![]() 1000 km s-1)
galaxy collision suggests that dust survives. We propose that
the dust that survived destruction was in pre-shock gas at densites
higher than a few 0.1 cm-3, which was
not shocked at velocities larger than
1000 km s-1)
galaxy collision suggests that dust survives. We propose that
the dust that survived destruction was in pre-shock gas at densites
higher than a few 0.1 cm-3, which was
not shocked at velocities larger than ![]() 200 km s-1.
Our model assumes a Galactic dust-to-gas mass ratio and
size distribution, and current data do not allow
us to identify any significant deviations of the
abundances and size distribution of dust grains from those of the
Galaxy. Our model calculations show that far-IR Herschel
observations will help in constraining the structure of the molecular
gas, and the dust size distribution, and thereby to look for signatures
of dust processing in the SQ shock.
200 km s-1.
Our model assumes a Galactic dust-to-gas mass ratio and
size distribution, and current data do not allow
us to identify any significant deviations of the
abundances and size distribution of dust grains from those of the
Galaxy. Our model calculations show that far-IR Herschel
observations will help in constraining the structure of the molecular
gas, and the dust size distribution, and thereby to look for signatures
of dust processing in the SQ shock.
Key words: atomic processes - ISM: general - dust, extinction - galaxies: clusters: individual: Stephan's Quintet - shock waves - infrared: ISM
1 Introduction
Stephan's Quintet (Hickson Compact Group HCG92,
Arp 319, hereafter SQ) is an extensively studied compact group
of four interacting galaxies that have a complex dynamical history
(e.g., Allen
& Sullivan 1980; Moles et al. 1997). A
remarkable feature of SQ is that a giant (![]()
![]() kpc) shock is
created by an intruding galaxy, HCG92 (Sbc pec),
colliding into HCG92's tidal tail, at a relative velocity
of
kpc) shock is
created by an intruding galaxy, HCG92 (Sbc pec),
colliding into HCG92's tidal tail, at a relative velocity
of ![]() 1000 km s-1.
Evidence of a group-wide shock comes from observations of an extended
X-ray ridge containing shock-heated (
1000 km s-1.
Evidence of a group-wide shock comes from observations of an extended
X-ray ridge containing shock-heated (![]()
![]() K) gas (Trinchieri
et al. 2005,2003; Pietsch
et al. 1997; O'Sullivan et al. 2009),
strong radio synchrotron emission from the radio-emitting plasma
(Xu
et al. 2003; Allen & Hartsuiker 1972;
Williams
et al. 2002; Sulentic et al. 2001),
and shocked-gas excitation diagnostics
from optical emission lines (Xu
et al. 2003). This extended region is denoted ``ridge''
or simply ``SQ shock'' in this paper.
K) gas (Trinchieri
et al. 2005,2003; Pietsch
et al. 1997; O'Sullivan et al. 2009),
strong radio synchrotron emission from the radio-emitting plasma
(Xu
et al. 2003; Allen & Hartsuiker 1972;
Williams
et al. 2002; Sulentic et al. 2001),
and shocked-gas excitation diagnostics
from optical emission lines (Xu
et al. 2003). This extended region is denoted ``ridge''
or simply ``SQ shock'' in this paper.
Observations with the infrared spectrograph (IRS,
Houck et al. 2004)
onboard the Spitzer Space Telescope have revealed a
powerful mid-infrared (mid-IR) ![]() rotational line emission from warm (
rotational line emission from warm (![]() 102-103 K)
molecular gas in the SQ shock
(Cluver
et al. 2010; Appleton et al. 2006).
The H2 emission is extended not only
over the whole ridge, but in several other structures, including an
extension towards the Seyfert galaxy NGC 7319, and the
intergalactic starburst SQ-A (Xu
et al. 1999). The latter structure, beyond the
northern tip of the ridge, has been shown to contain significant
CO-emitting gas (Lisenfeld
et al. 2002; Smith & Struck 2001; Gao & Xu
2000). To explain the H2 emission
from the SQ ridge, Guillard
et al. (2009) considered the collision of two flows
of multiphase dusty gas and proposed a model that quantifies the gas
cooling, dust destruction, H2 formation and
excitation in the postshock medium.
In their scenario, the H2 gas is formed
from
gas that is shocked to velocities sufficiently low (
102-103 K)
molecular gas in the SQ shock
(Cluver
et al. 2010; Appleton et al. 2006).
The H2 emission is extended not only
over the whole ridge, but in several other structures, including an
extension towards the Seyfert galaxy NGC 7319, and the
intergalactic starburst SQ-A (Xu
et al. 1999). The latter structure, beyond the
northern tip of the ridge, has been shown to contain significant
CO-emitting gas (Lisenfeld
et al. 2002; Smith & Struck 2001; Gao & Xu
2000). To explain the H2 emission
from the SQ ridge, Guillard
et al. (2009) considered the collision of two flows
of multiphase dusty gas and proposed a model that quantifies the gas
cooling, dust destruction, H2 formation and
excitation in the postshock medium.
In their scenario, the H2 gas is formed
from
gas that is shocked to velocities sufficiently low (
![]() km s-1)
for dust to survive. Because H2 molecules
form on dust grains (e.g., Cazaux
& Tielens 2004), dust is a key element in this
scenario.
km s-1)
for dust to survive. Because H2 molecules
form on dust grains (e.g., Cazaux
& Tielens 2004), dust is a key element in this
scenario.
Xu
et al. (2003,1999) reported detection of diffuse
far-infrared (hereafter FIR) emission from the intergalatic medium
(hereafter IGM) with the Infrared Space Observatory (ISO),
and proposed that the dust emission in the shock region would arise
from dust grains that efficiently cool the X-ray emitting plasma via
collisions with hot electrons. The FIR emission would then trace the
structure of the shock, as suggested by Popescu
et al. (2000) for the case of shocks driven into
dusty gas that is accreting onto clusters of galaxies.
However, the poor spatial resolution of these observations makes it
difficult to separate the dust emission associated with star formation
(in the neighborhood galaxies, or SQ-A) from that really associated
with the shock. In addition, Guillard
et al. (2009) show that the dust contribution to the
cooling of the hot (![]()
![]() K) plasma is
expected to be low, because of efficient thermal sputtering of the
grains. If we assume that the age of the galaxy collision is
K) plasma is
expected to be low, because of efficient thermal sputtering of the
grains. If we assume that the age of the galaxy collision is ![]()
![]() yrs, grains smaller
than
yrs, grains smaller
than ![]() m
in radius must have been destroyed. However, the plasma could still be
dusty if, before the shock, a significant fraction of the dust mass was
in larger grains and/or if dust destruction is balanced by mass
exchange between the cold and the hot gas phases (Guillard et al. 2009).
m
in radius must have been destroyed. However, the plasma could still be
dusty if, before the shock, a significant fraction of the dust mass was
in larger grains and/or if dust destruction is balanced by mass
exchange between the cold and the hot gas phases (Guillard et al. 2009).
The discovery of bright H2 emission in the ridge triggered new perspectives about the origin of the dust emission in the SQ ridge. In the context of our model for the H2 formation in the SQ shock, we expect some dust emission from the molecular gas. We use Spitzer observations and a model of the dust emission to test this expectation. Spitzer observations show that the bright polycyclic aromatic hydrocarbons (henceforth PAHs) and mid-IR continuum emitting regions are spatially correlated with UV emission and associated with star-forming regions mainly related to the individual sources in the group (in particular the spiral arm of the intruder galaxy NGC 7318b) and with SQ-A (Cluver et al. 2010; Natale et al., in prep.). These IR-bright regions do not correlate with the radio, X-ray, or H2 line emission, which trace the shock structure. In this paper, we focus on the fainter dust emission from the SQ ridge itself, outside these star-forming regions. The spatial distribution of the mid-IR emission allows us to isolate the dust emission from the shock. The UV, visible, and near-IR observations determine the spectral energy distribution (hereafter SED) of the radiation field used as an input to the dust model. We consider two limiting cases for the structure of the molecular gas, either diffuse, or fragmented into clouds that are optically thick to UV light. An updated version of the Désert et al. (1990) model is used to compute the dust emission from molecular gas in these two cases, and fit the model results to the observed IR SED in the SQ shock. The Galactic dust size distribution is taken as a reference.
This paper is organized as follows. Section 2 presents the new IR Spitzer observations of SQ, and the UV, optical, and near-IR ancillary data we used in this paper. The method used to perform photometry within the SQ shock region and the results are described in Sect. 3. Section 4 presents the Spitzer imaging and spectroscopy results pertaining to the dust emission in the shock structure, emphasizing the PAH properties in the shock. The physical framework and inputs of the dust modeling are outlined in Sect. 5, and the results are discussed and compared to the mid-IR Spitzer observations in Sect. 6. In Sect. 7, we discuss the dust processing in the shock. We then present our conclusions in Sect. 8 and propose new observations to constrain the physical structure of the molecular gas in the shock.
In this paper we assume the distance to the SQ group
to be 94 Mpc (with a Hubble
constant of 70 km s-1 Mpc-2)
and a systemic velocity for the
group as a whole of 6600 km s-1.
At this distance, ![]() kpc.
kpc.
2 Observations of the Stephan's Quintet shock
In the following paragraphs, we present the new mid-IR (Sect. 2.1) observations of SQ, and the ancillary UV (Sect. 2.2.1), optical (Sect. 2.2.2), and near-IR (Sect. 2.2.3) data, respectively.
2.1 Spitzer IR imaging and spectroscopy
Stephan's Quintet has been imaged with the InfraRed Array
Camera (IRAC, Fazio
et al. 2004) at 3.6, 4.5, 5.8, ![]() m, with the IRS
blue peak-up imager (PUI) at
m, with the IRS
blue peak-up imager (PUI) at ![]() m, and with the Multiband
Imaging Photometer for Spitzer (MIPS, Rieke et al. 2004) at
24 and
m, and with the Multiband
Imaging Photometer for Spitzer (MIPS, Rieke et al. 2004) at
24 and ![]() m.
The
m.
The ![]() m image was
reported in Xu et al. (2008).
The pixel sizes are 1.8'', 2.45'', and 5'' at 16, 24, and
m image was
reported in Xu et al. (2008).
The pixel sizes are 1.8'', 2.45'', and 5'' at 16, 24, and ![]() m,
respectively. Except for the
m,
respectively. Except for the ![]() m image, we direct the reader
to Cluver et al. (2010)
for a description of the observational details and data reduction. The
upper right panel of Fig. 1
shows the
m image, we direct the reader
to Cluver et al. (2010)
for a description of the observational details and data reduction. The
upper right panel of Fig. 1
shows the ![]() m
data from the IRS blue PUI. The
bottom left and right panels show the MIPS 24 and
m
data from the IRS blue PUI. The
bottom left and right panels show the MIPS 24 and ![]() m images.
m images.
The SQ shock region was also mapped with the IRS
spectrograph (Cluver et al.
2010). The Short-Low (SL) and Long-Low (LL) modules of the
spectrograph were used, covering the wavelength ranges
5.3-14.0 and 14-38 ![]() m,
with spectral resolution of
m,
with spectral resolution of
![]() and 57-126,
respectively.
and 57-126,
respectively.
2.2 Ancillary data
We present the UV, optical, and near-IR ancillary data we used to determine the radiation field heating the dust (Sect. 5.2).
2.2.1 GALEX UV imaging
![\begin{figure}
\par\includegraphics[width = 18cm,clip]{13430fg1.eps}
\end{figure}](/articles/aa/full_html/2010/10/aa13430-09/img41.png)
|
Figure 1:
UV and mid-IR observations of Stephan's Quintet. Top-left
is a near-UV (2 267 Å) GALEX
image from Xu et al. (2005),
top-right is the Spitzer IRS
|
| Open with DEXTER | |
The upper left corner of Fig. 1
shows the near-UV (NUV) image from the Galaxy Evolution
Explorer mission (GALEX, Martin et al. 2005).
These observations were reported by Xu
et al. (2005).
The pixel size is 1.5'', the wavelength is
![]() Å,
and the bandwith is
Å,
and the bandwith is ![]() Å.
The far-UV (FUV) image (
Å.
The far-UV (FUV) image (
![]() Å,
Å,
![]() Å)
was also used but is not shown here.
Å)
was also used but is not shown here.
If one were to exclude the foreground galaxy HCG92 (Sd), most of the UV emission would be associated with the
two spiral members of the group, NGC 7319 and
NGC 7318b, and the intragroup medium starburst SQ-A. The
galaxy-wide shock structure, which shows up in H![]() ,
radio, and X-ray observations, is barely visible in the UV images.
Based on the comparison between ISO and GALEX
data, Xu et al. (2005)
concluded that most of the UV emission in the ridge is not associated
with the large-scale shock itself, but with H II
regions along the spiral arm of the intruder NGC 7318b.
,
radio, and X-ray observations, is barely visible in the UV images.
Based on the comparison between ISO and GALEX
data, Xu et al. (2005)
concluded that most of the UV emission in the ridge is not associated
with the large-scale shock itself, but with H II
regions along the spiral arm of the intruder NGC 7318b.
We use the flux calibration described in both the GALEX
observer's guide![]() and Morrissey et al.
(2007). The unit data number (DN, or 1 count per second, cps)
is equivalent to 108 and
and Morrissey et al.
(2007). The unit data number (DN, or 1 count per second, cps)
is equivalent to 108 and ![]() Jy
for FUV and NUV, or, equivalently,
Jy
for FUV and NUV, or, equivalently,
![]() and
and
![]() erg s-1 cm-2 Å-1,
respectively.
We do not apply any aperture correction to the extended source UV
photometry on GALEX images since the PSF full width
half maxima (FWHM) are 4.9'' and 4.2'' for the NUV
and FUV, respectively.
erg s-1 cm-2 Å-1,
respectively.
We do not apply any aperture correction to the extended source UV
photometry on GALEX images since the PSF full width
half maxima (FWHM) are 4.9'' and 4.2'' for the NUV
and FUV, respectively.
2.2.2 HST V-band imaging with WFPC2
We used V-band data taken with the Wide
Field Planetary Camera 2 (WFPC2) onboard the Hubble
Space Telescope (HST). For the F569W filter,
the data consist of two sets of two images (
![]() s exposure in
total), each set for a given dithering position. The data were first
processed by the HST pipeline. After alignment of
the images with the IRAF data reduction software, a median combination
of the four images was taken, followed by the removal of the remaining
hot pixels by a
s exposure in
total), each set for a given dithering position. The data were first
processed by the HST pipeline. After alignment of
the images with the IRAF data reduction software, a median combination
of the four images was taken, followed by the removal of the remaining
hot pixels by a ![]() pixels
median filter. We obtained a V-band image similar
to that presented in Gallagher
et al. (2001).
pixels
median filter. We obtained a V-band image similar
to that presented in Gallagher
et al. (2001).
The photometry were performed using the flux calibration given
in the header of the images (1 DN
![]() W m-2 Å-1).
The central wavelength of the F569W V-band
filter is
W m-2 Å-1).
The central wavelength of the F569W V-band
filter is ![]() Å.
Å.
2.2.3 Near-IR WIRC imaging
We used near-IR (NIR) data from deep observations with the Wide field
IR Camera (WIRC) on the Palomar 200-inch telescope
(V. Charmandaris, private communication). The WIRC
images were taken in July, 2009 and processed with the Swarp
software![]() . They are 5 mag
deeper than the corresponding 2MASS images. The
zero-point magnitudes are 24.50, 22.73, and 23.05, so we used flux
calibrations of 0.252, 0.830, and 0.402
. They are 5 mag
deeper than the corresponding 2MASS images. The
zero-point magnitudes are 24.50, 22.73, and 23.05, so we used flux
calibrations of 0.252, 0.830, and 0.402 ![]() Jy DN-1
for J, H, and
Jy DN-1
for J, H, and ![]() ,
respectively. The corresponding central wavelengths used are
,
respectively. The corresponding central wavelengths used are
![]() ,
,
![]() ,
and
,
and ![]()
![]() m. The
images show that most of the NIR emission in the SQ ridge is
associated with the spiral arm of the intruder, NGC 7318b. NIR
emission associated with the SQ-A northern starburst is also detected.
m. The
images show that most of the NIR emission in the SQ ridge is
associated with the spiral arm of the intruder, NGC 7318b. NIR
emission associated with the SQ-A northern starburst is also detected.
3 Photometry on IR, optical, and UV images
We describe the method used to perform the photometry on Spitzer mid-IR images for the dust emission and on near-IR, optical, and UV images to estimate the radiation field at the position of the SQ shock.
3.1 Method
3.1.1 Dust emission
The SQ field of view is a crowded region (see Sect. 4.1 for a description of the spatial distribution of the dust emission). To isolate the dust emission from the shock itself, we summed the signal within regions that are not contaminated by IR-emitting, star-forming regions. Since the shock is surrounded by bright sources, we did not apply any aperture correction. For comparison, three different area were used to perform photometric measurements.
- 1.
- The signal was summed over a circular aperture of 17'' in
diameter that is centered on the SQ ridge, in the middle of
the X-ray emitting shock front. This 17'' aperture corresponds to the FWHM
of the MIPS beam at
 m. It is
marked with the yellow circle in Fig. 1
(``ON'' position).
m. It is
marked with the yellow circle in Fig. 1
(``ON'' position). - 2.
- The signal was integrated over the SQ ridge within
the H2 contours (black line in
Fig. 1)
that define the shock structure. Except SQ-A, star-forming regions
within the black H2 emission contour
were included. They are defined by the
 m iso-flux (
 MJy sr-1)
contour (magenta line in Fig. 1).
MJy sr-1)
contour (magenta line in Fig. 1).
- 3.
- The signal was summed over the SQ ridge within the
H2 contour but excluding the star
forming regions. To do this, we subtract from the signal the emission
arising from the intersection of the areas within the magenta m contours
and black H2 contours.
3.1.2 Radiation field
The radiation field is the integral of the flux over all directions. In the UV domain, due to scattering of light, we can assume that the radiation field is isotropic and estimate its strength from UV photometry at the position of the shock. Thus, we measured the UV fluxes within the same apertures as for the Spitzer images, using the same ``OFF'' position.
The UV fluxes were corrected for both foreground galactic and
SQ internal extinctions.
For the extinction curve of the Galactic diffuse interstellar medium (RV=3.1
curve in Weingartner &
Draine 2001a), the visible extinction
![]() scales
to the FUV and NUV Galactic extinctions at GALEX
wavelengths, respectively
scales
to the FUV and NUV Galactic extinctions at GALEX
wavelengths, respectively
![]() and
and
![]() .
We used the Xu et al. (2005)
values for the internal SQ extinction, i.e.,
.
We used the Xu et al. (2005)
values for the internal SQ extinction, i.e.,
![]() and
and
![]() .
.
The optical and near-IR images show that the shock is surrounded by bright sources, in particular NGC 7318b and nearby star-forming regions. Since there is little scattering at these wavelengths, the photometry restricted to the shock area is likely to underestimate the optical and near IR intensity of the radiation field. The choice of the aperture is rather arbitrary in that case and only provides a rough approximation of the optical and near-IR radiation field. We note that the photometry was performed after removal of Galactic stars (using the DAOPHOT package).
Based on an average optical extinction of AV
= 0.6 (Guillard et al.
2009) for the center position in the ridge, and a Galactic
extinction curve, we applied the extinction corrections
AJ
= 0.17, AH
= 0.11, and ![]() for J, H, and
for J, H, and ![]() bands,
respectively. We used the values of zero-point fluxes from Cohen et al. (2003),
i.e.
bands,
respectively. We used the values of zero-point fluxes from Cohen et al. (2003),
i.e. ![]() ,
,
![]() ,
,
![]() Jy for J,
H, and
Jy for J,
H, and ![]() bands, respectively.
The internal extinction correction applied to the HST
photometry is AF569W
= 0.575.
bands, respectively.
The internal extinction correction applied to the HST
photometry is AF569W
= 0.575.
Table 1:
Summary of the mid-IR photometric measurements1
performed on the Spitzer IRAC, IRS PUI
![]() m, and MIPS
24, and
m, and MIPS
24, and ![]() m
images (Fig. 1).
m
images (Fig. 1).
3.2 Results
The quantitative results about the photometry performed on IR Spitzer
images are gathered in Table 1. The
surface brightnesses are given for the three areas described above. We
estimate from the IRS spectrum that the ![]() m S(1) and
m S(1) and ![]() m S(4) H2 line
emission represent respectively 68% and 62% of the IRS
Peak-Up Imager
m S(4) H2 line
emission represent respectively 68% and 62% of the IRS
Peak-Up Imager ![]() m
and the IRAC
m
and the IRAC ![]() m in-band flux within the
17'' ON aperture centered on the shock, and we
correct for this contamination.
The last row of Table 1
indicates the fluxes we adopt throughout this paper. The error bars are
estimated by using two different background subtractions close to the
``OFF'' position (8-arcsec shifts in the East-West direction). In
addition, we include calibration uncertainties (of the order of 5%).
m in-band flux within the
17'' ON aperture centered on the shock, and we
correct for this contamination.
The last row of Table 1
indicates the fluxes we adopt throughout this paper. The error bars are
estimated by using two different background subtractions close to the
``OFF'' position (8-arcsec shifts in the East-West direction). In
addition, we include calibration uncertainties (of the order of 5%).
Table 2: Summary of the UV photometric measurements performed on GALEX FUV and NUV images (see Fig. 1).
Table 3:
Optical HST V-band and
near-infrared WIRC surface brightnesses1
in the J, H, and ![]() bands for the SQ ridge.
bands for the SQ ridge.
The results of the UV GALEX photometry are
gathered in Table 2.
The surface brightnesses are given for the three apertures defined in
Sect. 3.1.1.
The UV fluxes measured over the SQ ridge aperture that
includes the ![]() m-bright
(>0.25 MJy sr-1)
regions are 10-25% higher than the fluxes measured when these regions
had been removed from the aperture (``SQ ridge (partial)''
row). The brightnesses are background-subtracted and corrected for
foreground galactic extinction and SQ internal extinction.
From the UV surface brightness values, we derive the intensity of the
standard interstellar radiation field in Habing units.
m-bright
(>0.25 MJy sr-1)
regions are 10-25% higher than the fluxes measured when these regions
had been removed from the aperture (``SQ ridge (partial)''
row). The brightnesses are background-subtracted and corrected for
foreground galactic extinction and SQ internal extinction.
From the UV surface brightness values, we derive the intensity of the
standard interstellar radiation field in Habing units.
The results show that the UV flux in the shock, outside
star-forming regions, corresponds to an interstellar radiation field of
average intensity ![]() in Habing units
in Habing units![]() (see Sect. 5.2.1
for details). The value of
(see Sect. 5.2.1
for details). The value of ![]() is used to characterize the intensity of the non-ionizing radiation
field in the shock (Sect. 5.2).
The error bar on the
is used to characterize the intensity of the non-ionizing radiation
field in the shock (Sect. 5.2).
The error bar on the ![]() factor takes into account two background subtractions obtained by
shifting the OFF position by 8'' in the east-west direction.
This uncertainty does not take into account the uncertainty in the
optical extinction. Although optical spectroscopy shows that there are
spatial variations in the AV
value in the shock (
AV=0.1-2.5),
we do not expect this to have an important impact on our estimate of
factor takes into account two background subtractions obtained by
shifting the OFF position by 8'' in the east-west direction.
This uncertainty does not take into account the uncertainty in the
optical extinction. Although optical spectroscopy shows that there are
spatial variations in the AV
value in the shock (
AV=0.1-2.5),
we do not expect this to have an important impact on our estimate of
![]() ,
because it is calculated over a large aperture. If the most extincted
regions were to have a reasonably small surface filling factor, they
would not affect
,
because it is calculated over a large aperture. If the most extincted
regions were to have a reasonably small surface filling factor, they
would not affect ![]() significantly.
significantly.
The extinction-corrected surface brightnesses measured on HST V-band and Palomar WIRC images are gathered in Table 3.
4 Dust emission from Stephan's Quintet: observational results
This section reports the observational results about the dust emission detected in the SQ ridge. We compare the mid-IR SED and the relative intensities of the PAH bands in the SQ shock to that of the Galactic diffuse interstellar medium (ISM).
4.1 Spatial distribution of the dust emission from the SQ group
The images in Fig. 1
show that the bright mid-IR emitting regions are associated with the
NGC 7319 galaxy and with UV-luminous, star-forming regions (Cluver et al. 2010).
The mid-IR emission does not correlate with the H2,
X-ray, and radio emissions. Interestingly, these star-forming regions
are outside the galactic disks of NGC 7318a and b, suggesting
that a significant amount of gas has been displaced from these galaxies
by tidal interactions.
If we exclude the foreground galaxy NGC 7320, the bright
mid-IR emission is found to originate in the NGC 7319 galaxy, the SQ-A
starburst region, and an arc-like feature to the east of the intruding
galaxy NGC 7318b. This arc structure is clearly seen in the
UV, IRAC, and ![]() m
images, and could be associated with NGC 7318b's spiral arm.
The 24 and
m
images, and could be associated with NGC 7318b's spiral arm.
The 24 and ![]() m
images show a bright and extended emission at the southern tip of the
ridge, which may be associated with enhanced star formation in this arc
feature.
m
images show a bright and extended emission at the southern tip of the
ridge, which may be associated with enhanced star formation in this arc
feature.
Dust is detected in the SQ shock region, at a
distance of 10-20 kpc of the nearest surrounding galaxies. In
the following, we focus on this faint emission observed within the
SQ ridge, outside star-forming regions. We note that in the 16![]() m IRS
Blue Peak-Up image, the emission in the ridge correlates well
with the H2 emission, which is caused
by the contamination of the H2 17
m IRS
Blue Peak-Up image, the emission in the ridge correlates well
with the H2 emission, which is caused
by the contamination of the H2 17![]() m S(1) line
to the in-band flux (Sect. 3.2).
m S(1) line
to the in-band flux (Sect. 3.2).
Using a combination of the H![]() and 24
and 24![]() m
luminosities, or the 7.7
m
luminosities, or the 7.7![]() m
PAH emission, Cluver
et al. (2010) find an upper limit of
m
PAH emission, Cluver
et al. (2010) find an upper limit of ![]()
![]() yr-1
to the star formation rate in the shock, as compared to
yr-1
to the star formation rate in the shock, as compared to ![]()
![]() yr-1
in SQ-A. This suggests that the star formation is being depressed in
the shock region.
yr-1
in SQ-A. This suggests that the star formation is being depressed in
the shock region.
4.2 Dust emission from the SQ shock, outside star-forming regions
The images and photometric measurements show that thermal dust emission is detected in the SQ shock structure, outside star-forming regions. The SED of the IR emission from the center of the shock is shown in Fig. 2. Among the SEDs listed in Table 1, the figure displays that of the last row (17'' beam, see Sect. 3).
![\begin{figure}
\par\includegraphics[angle=90, width =8cm,clip]{13430fg2.eps}
\end{figure}](/articles/aa/full_html/2010/10/aa13430-09/img124.png)
|
Figure 2:
The SED of the dust emission from the SQ shock seen by Spitzer
(Table 1),
compared to that of the Galactic diffuse emission observed with Spitzer
IRAC, IRAS, and DIRBE
towards the line-of-sight centered on the Galactic coordinates
(28.6, +0.8). The contribution of the gas lines is subtracted. The
Galactic SED is scaled down by a factor 200. Between |
| Open with DEXTER | |
For comparison with Galactic data, the figure includes a 12![]() m flux
computed by integrating the IRS spectrum over the
IRAS 12
m flux
computed by integrating the IRS spectrum over the
IRAS 12![]() m filter
bandpass after subtraction of the gas lines. The
m filter
bandpass after subtraction of the gas lines. The
![]() m
flux
density ratio in the SQ shock is
m
flux
density ratio in the SQ shock is
![]() ,
which is remarkably close to the value for the Galactic diffuse ISM:
,
which is remarkably close to the value for the Galactic diffuse ISM:
![]() .
The Galactic SED is that measured towards the line-of-sight centered on
the Galactic coordinates
(28.6, +0.8), observed with the ISOCAM-CVF
.
The Galactic SED is that measured towards the line-of-sight centered on
the Galactic coordinates
(28.6, +0.8), observed with the ISOCAM-CVF![]() and Spitzer IRAC (Flagey
et al. 2006). Figure 2
also shows the IRAS 12, 25, 60, and 100
and Spitzer IRAC (Flagey
et al. 2006). Figure 2
also shows the IRAS 12, 25, 60, and 100![]() m fluxes for
the Galactic diffuse ISM emission measured on IRIS
images (Miville-Deschênes
& Lagache 2005). The IRAS SED is
extended to 140 and 240
m fluxes for
the Galactic diffuse ISM emission measured on IRIS
images (Miville-Deschênes
& Lagache 2005). The IRAS SED is
extended to 140 and 240![]() m
using DIRBE (Hauser
et al. 1998) color ratios at the position of the
line of sight. The total column density for this line of sight is
estimated to be
m
using DIRBE (Hauser
et al. 1998) color ratios at the position of the
line of sight. The total column density for this line of sight is
estimated to be
![]() cm-2,
and the mean radiation field a few Habing units (
cm-2,
and the mean radiation field a few Habing units (
![]() ). In the figure, the Galactic
SED is scaled down by a factor 200.
). In the figure, the Galactic
SED is scaled down by a factor 200.
We propose that the faint dust emission we isolated at the center of the SQ shock is diffuse emission associated with the shocked molecular gas present in the ridge. A second possibility is that the dust is associated with the H I gas and a third one that it is produced by unresolved star-forming regions. We favor the first interpretation for three reasons.
-
After inspecting the H I data of Williams et al. (2002), we see that the two outer contours in their Fig. 9, 0.6 and
 cm-2,
intersect our 17'' aperture used for dust photometry. Since the angular
resolution of these H I observations is
20'', the H I emission is likely to be
contaminated by beam smearing of the brighter emission to the north of
our aperture. On the southern side of our aperture, in the ridge, H I
is undetected and
cm-2,
intersect our 17'' aperture used for dust photometry. Since the angular
resolution of these H I observations is
20'', the H I emission is likely to be
contaminated by beam smearing of the brighter emission to the north of
our aperture. On the southern side of our aperture, in the ridge, H I
is undetected and
 cm-2.
This upper limit is smaller than the column density of warm H2 (
cm-2.
This upper limit is smaller than the column density of warm H2 (
 cm-2)
derived from the Spitzer H2 fluxes.
Since the warm H2 column density is a
lower limit to the total H2 column
density, H I gas accounts for a minor
fraction of the gas column density in the ridge. Therefore, the dust
emission cannot be mostly associated with the H I
gas in the shock region.
cm-2)
derived from the Spitzer H2 fluxes.
Since the warm H2 column density is a
lower limit to the total H2 column
density, H I gas accounts for a minor
fraction of the gas column density in the ridge. Therefore, the dust
emission cannot be mostly associated with the H I
gas in the shock region. -
HST observations show that there are very few star clusters in the center of the ridge. Most of them are associated with NGC 7319, the tidal debris of NGC 7318a/b, and the SQ-A intragroup starburst region (Gallagher et al. 2001). We find three candidates for star clusters (
 )
within our 17'' (
)
within our 17'' ( 7.8 kpc)
aperture in the center of the shock. These three clusters produce a V-band
flux of
7.8 kpc)
aperture in the center of the shock. These three clusters produce a V-band
flux of  W m-2 sr-1,
which is 2 orders of magnitude lower than the V-band
surface brightness that we derived from HST
observations at the center of the ridge.
W m-2 sr-1,
which is 2 orders of magnitude lower than the V-band
surface brightness that we derived from HST
observations at the center of the ridge. - The
 m flux ratio
is remarkably similar to that of the Galactic diffuse ISM.
The average column density of warm molecular gas in the
SQ shock derived from H2 observations
is
m flux ratio
is remarkably similar to that of the Galactic diffuse ISM.
The average column density of warm molecular gas in the
SQ shock derived from H2 observations
is  cm-2,
a factor of 100 smaller than that of the Galactic line of sight, in
agreement with the scaling factor used to match the fluxes in
Fig. 2.
cm-2,
a factor of 100 smaller than that of the Galactic line of sight, in
agreement with the scaling factor used to match the fluxes in
Fig. 2.
4.3 Mid-IR spectroscopy: characterization of the dust emission from the SQ shock
4.3.1 Spitzer IRS spectrum in the center of the shock
![\begin{figure}
\par\includegraphics[height = 16cm, angle=90,clip]{13430fg3.eps} ...
...raphics[height = 16cm, angle=90,clip]{13430fg4.eps}
\vspace*{4mm}
\end{figure}](/articles/aa/full_html/2010/10/aa13430-09/img137.png)
|
Figure 3:
Spitzer IRS mid-IR spectra extracted over a |
| Open with DEXTER | |
The top panel of Fig. 3
presents a low-resolution Spitzer IRS spectrum
extracted from a central position of the SQ ridge. This
spectrum was obtained by Cluver
et al. (2010), averaging all the spectra observed
within a ![]() (
(![]()
![]() )
rectangular aperture around the center of the ON position. These new
data are of far higher sensitivity and have superior flux calibration
than the first observations reported by Appleton
et al. (2006).
This spectrum confirms the first results discussed in Appleton et al. (2006).
It exhibits bright S(0) to S(5) H2 rotational
lines, and forbidden atomic lines, including a remarkable
)
rectangular aperture around the center of the ON position. These new
data are of far higher sensitivity and have superior flux calibration
than the first observations reported by Appleton
et al. (2006).
This spectrum confirms the first results discussed in Appleton et al. (2006).
It exhibits bright S(0) to S(5) H2 rotational
lines, and forbidden atomic lines, including a remarkable ![]() m
[Si II] feature. Here we focus on
the dust emission.
m
[Si II] feature. Here we focus on
the dust emission.
The IRS spectrum shows that PAH and
thermal dust emission is detected from the center of the
SQ ridge, outside star-forming regions. A weak thermal
continuum is also visible from 20 to ![]() m. The ratio of the fluxes of
the
m. The ratio of the fluxes of
the ![]() m S(1) H2 line
to the
m S(1) H2 line
to the ![]() m
PAH feature is
m
PAH feature is ![]() in the shock, which is about two orders of magnitude higher than the
value observed in star-forming galaxies (Roussel
et al. 2007).
in the shock, which is about two orders of magnitude higher than the
value observed in star-forming galaxies (Roussel
et al. 2007).
4.3.2 PAH emission from the SQ shock
The 7.7, 11.3, and ![]() m
aromatic infrared bands (AIBs), attributed to PAHs, are detected
(although weak) in the new Cluver
et al. (2010) observations at the center of the
SQ shock.
We used the PAHFit IDL tool
m
aromatic infrared bands (AIBs), attributed to PAHs, are detected
(although weak) in the new Cluver
et al. (2010) observations at the center of the
SQ shock.
We used the PAHFit IDL tool![]() (Smith et al. 2007)
to decompose the full
(Smith et al. 2007)
to decompose the full ![]() m IRS
spectrum into contributions from PAH features, thermal dust continuum,
starlight and gas lines. We do not include any extinction in the fit.
The results of the fit to the full
m IRS
spectrum into contributions from PAH features, thermal dust continuum,
starlight and gas lines. We do not include any extinction in the fit.
The results of the fit to the full
![]() m spectrum
is shown in Appendix A,
Fig. A.1.
This spectral decomposition allows us to remove the gas lines and
extract a ``pure'' dust spectrum, shown on the bottom panel of
Fig. 3.
PAHFit is executed one more time on this spectrum, which allows us to
measure accurately the fluxes of the AIBs. The line strengths of the
PAH emission features and their ratios are gathered in Tables 4
and 5,
respectively.
m spectrum
is shown in Appendix A,
Fig. A.1.
This spectral decomposition allows us to remove the gas lines and
extract a ``pure'' dust spectrum, shown on the bottom panel of
Fig. 3.
PAHFit is executed one more time on this spectrum, which allows us to
measure accurately the fluxes of the AIBs. The line strengths of the
PAH emission features and their ratios are gathered in Tables 4
and 5,
respectively.
In Fig. 4,
we compare the PAH spectrum from the SQ shock with the ISOCAM-CVF
spectrum of the diffuse Galactic emission from Flagey
et al. (2006), between 5 and ![]() m. The main
differences between the two spectra are the following. First, the ratio
of the flux in the band at
m. The main
differences between the two spectra are the following. First, the ratio
of the flux in the band at ![]() m to the band at
m to the band at ![]() m
(henceforth R7.7/11.3)
is a factor
m
(henceforth R7.7/11.3)
is a factor ![]() 2
lower for SQ (
2
lower for SQ (
![]() ,
see Table 5)
than for the diffuse Galactic light (
,
see Table 5)
than for the diffuse Galactic light (
![]() ).
The R7.7/11.3
value for the SQ shock is comparable to that measured for AGN
of the SINGS
).
The R7.7/11.3
value for the SQ shock is comparable to that measured for AGN
of the SINGS![]() sample (Smith et al. 2007).
Second, the
sample (Smith et al. 2007).
Second, the ![]() m
AIB is absent in the SQ spectrum. We note that the rise of the
SQ spectrum at
m
AIB is absent in the SQ spectrum. We note that the rise of the
SQ spectrum at ![]() m is due to
the stellar component.
The
m is due to
the stellar component.
The ![]() m complex is
prominent but the
m complex is
prominent but the ![]() m
feature is not seen on top of it. This may not be significant because,
to our knowledge, this feature is only prominent in the
NGC 7023 Galactic PDR
m
feature is not seen on top of it. This may not be significant because,
to our knowledge, this feature is only prominent in the
NGC 7023 Galactic PDR![]() (Sellgren et al. 2007).
This feature is also observed in the star-forming galaxy
NGC 7331 (Smith
et al. 2004), but in a higher signal-to-noise-ratio
spectrum than the one we have for SQ.
(Sellgren et al. 2007).
This feature is also observed in the star-forming galaxy
NGC 7331 (Smith
et al. 2004), but in a higher signal-to-noise-ratio
spectrum than the one we have for SQ.
![\begin{figure}
\par\includegraphics[width = 15cm,clip]{13430fg5.eps}
\vspace*{3mm}
\end{figure}](/articles/aa/full_html/2010/10/aa13430-09/img153.png)
|
Figure 4:
Spitzer IRS PAH emission spectrum extracted at
the center of the SQ ridge (black solid line), compared with
the ISOCAM-CVF spectrum of the diffuse galactic
medium (blue dashed line, with flux density labeled on the right). The IRS
spectrum is smoothed to a resolution
|
| Open with DEXTER | |
Table 4: Fluxes of the PAH bands measured with the PAHFit IDL tool on the Spitzer IRS spectrum of the center of the SQ ridge and the ISO-CVF spectrum of the Galactic light.
Table 5: Flux ratios of the PAH bands for the Spitzer IRS spectrum at the center of the SQ ridge, and the ISO-CVF spectrum of the diffuse Galactic light.
The enhancement of the ![]() m AIB relative to the 6.2,
7.7, and 8.6
m AIB relative to the 6.2,
7.7, and 8.6![]() m
features has been observed on galactic scales in elliptical galaxies
(e.g., Kaneda et al. 2005),
and in active galactic nuclei (e.g., Smith
et al. 2007). This enhancement has also been
discussed in the Galactic diffuse medium (e.g., Flagey et al. 2006) or
at small scales, in PDR interfaces (e.g., Compiègne et al. 2007;
Rapacioli
et al. 2005).
m
features has been observed on galactic scales in elliptical galaxies
(e.g., Kaneda et al. 2005),
and in active galactic nuclei (e.g., Smith
et al. 2007). This enhancement has also been
discussed in the Galactic diffuse medium (e.g., Flagey et al. 2006) or
at small scales, in PDR interfaces (e.g., Compiègne et al. 2007;
Rapacioli
et al. 2005).
The PAH emission spectrum depends on the size distribution,
hydrogenation and ionization states. The
R7.7/11.3
PAH band ratio depends mainly on the PAH ionization state. Theoretical (Bauschlicher
2002; Langhoff
1996; Draine
& Li 2001; Bakes et al. 2001b,a) and
experimental (e.g., Szczepanski
& Vala 1993) studies show that neutral PAHs have
lower ![]() than charged ones (both anions and cations). The charge state of PAHs
is mainly determined by the ionization parameter
than charged ones (both anions and cations). The charge state of PAHs
is mainly determined by the ionization parameter
![]() ,
where
,
where ![]() is the integrated far ultraviolet
(6-13.6 eV) radiation field expressed in units of the Habing
radiation field, T is the electron temperature, and
is the integrated far ultraviolet
(6-13.6 eV) radiation field expressed in units of the Habing
radiation field, T is the electron temperature, and
![]() is the
electronic density. This parameter reflects the balance between
photoionisation and recombination rates of electrons (Weingartner
& Draine 2001c; Bakes & Tielens 1994). Flagey et al. (2006)
quantified
is the
electronic density. This parameter reflects the balance between
photoionisation and recombination rates of electrons (Weingartner
& Draine 2001c; Bakes & Tielens 1994). Flagey et al. (2006)
quantified ![]() as a function of the ionization parameter
as a function of the ionization parameter
![]() and
the PAH mean size. We use their calculations to discuss the
ionization state of the PAHs in the SQ shock. Our PAHFit
decomposition yields
and
the PAH mean size. We use their calculations to discuss the
ionization state of the PAHs in the SQ shock. Our PAHFit
decomposition yields
![]() ,
which translates into
,
which translates into
![]() K1/2 cm3.
Assuming a warm molecular gas temperature of
K1/2 cm3.
Assuming a warm molecular gas temperature of ![]() K and
K and
![]() ,
we find that
,
we find that ![]() cm-3.
This lower limit is one order of magnitude higher than the electronic
densities inferred from observations and modeling of the ionization of
cold neutral gas in the Solar neighbourhood (Weingartner & Draine 2001b).
If this interpretation and diagnostic were to apply, a higher ionizing
flux from cosmic-rays or X-rays would be required to maintain such a
high electron density.
cm-3.
This lower limit is one order of magnitude higher than the electronic
densities inferred from observations and modeling of the ionization of
cold neutral gas in the Solar neighbourhood (Weingartner & Draine 2001b).
If this interpretation and diagnostic were to apply, a higher ionizing
flux from cosmic-rays or X-rays would be required to maintain such a
high electron density.
The R6.2/7.7
PAH flux ratio depends on the size of the emitting PAHs (Draine & Li 2001). The
non-detection of the ![]() m
band sets a low upper limit of
R6.2/7.7
< 0.2 to the PAH strength ratio, which is indicative of
preferentially large PAHs. Although the method used by Draine & Li (2001) to
measure the PAH line strengths differs from ours, we find that both
R7.7/11.3
and R6.2/7.7
flux ratios in SQ can be explained by large (with a number of
carbon atoms
m
band sets a low upper limit of
R6.2/7.7
< 0.2 to the PAH strength ratio, which is indicative of
preferentially large PAHs. Although the method used by Draine & Li (2001) to
measure the PAH line strengths differs from ours, we find that both
R7.7/11.3
and R6.2/7.7
flux ratios in SQ can be explained by large (with a number of
carbon atoms ![]() )
and neutral PAHs in CNM conditions, excited with a
)
and neutral PAHs in CNM conditions, excited with a
![]() interstellar
radiation field (see Fig. 17 of Draine
& Li 2001).
interstellar
radiation field (see Fig. 17 of Draine
& Li 2001).
5 Modeling dust emission
We present the physical framework and inputs of our modeling of the emission from dust associated with the molecular gas. Sections 5.1 and 5.2 present the codes and the radiation field that we use for our calculation of the dust emission.
5.1 The DUSTEM (Dust Emission) code
We use an updated version of the Désert
et al. (1990) model, the DUSTEM
code, to compute the dust emission. The modifications![]() implemented in the Desert
et al. model are described in Compiègne
et al. (2008). When the dust properties, the
dust-to-gas mass ratio, and the incident radiation field are given, the
code calculates the dust SED
implemented in the Desert
et al. model are described in Compiègne
et al. (2008). When the dust properties, the
dust-to-gas mass ratio, and the incident radiation field are given, the
code calculates the dust SED
![]() in
units of erg s-1 H-1,
for each dust grain species, as a function of the wavelength.
in
units of erg s-1 H-1,
for each dust grain species, as a function of the wavelength.
We use the diffuse Galactic ISM size distribution (a power-law
![]() ,
Mathis et al. 1977),
and dust-to-gas mass ratio inferred from the fitting of the SED and
extinction curve of the diffuse ISM (Compiègne
et al. 2008).
The DUSTEM model includes a mixture of three
populations of dust grains with increasing sizes:
,
Mathis et al. 1977),
and dust-to-gas mass ratio inferred from the fitting of the SED and
extinction curve of the diffuse ISM (Compiègne
et al. 2008).
The DUSTEM model includes a mixture of three
populations of dust grains with increasing sizes:
- polycyclic aromatic hydrocarbons (PAHs) of radius a = 0.4-1.2 nm, responsible for the aromatic infrared bands (AIBs) and the FUV non-linear rise in the extinction curve.
- Very Small Grains (VSGs, a = 1-4 nm), which are carbonaceous (graphitic) nanoparticles producing the mid-IR continuum emission and the extinction bump at 2175 Å.
- Big Grains (BGs, a
= 4 - 110 nm) of silicates with carbonaceous
mantles or inclusions, which account for the far IR emission and the
 rise in extinction at visible and near-IR wavelengths.
5.2 Radiation field
We model the radiation field used to compute the dust emission. Stellar radiation originates in the surrounding galaxies and/or stars in the ridge (Gallagher et al. 2001). The presence of ionizing radiation in the SQ ridge is also indicated by the lack of H I gas in the H2-bright shock structure (Sulentic et al. 2001), and by emission from ionized gas lines. Optical line emission diagnostics suggest that shocks are responsible for hydrogen ionization in the ridge (Xu et al. 2003).
We therefore consider that the SED of the input radiation field consists of two components: a stellar component (Sect. 5.2.1), and photo-ionizing radiation from gas shocked at high-velocities (Sect. 5.2.2).
5.2.1 The interstellar radiation field (ISRF)
The photometry performed on NUV and FUV GALEX
images shows that UV flux in the shock, outside star-forming regions,
corresponds to an interstellar radiation field of intensity
![]() (see
Table 2).
What is the origin of this UV radiation in the shock? We estimate the
UV emission in the ridge that comes from H II
regions associated with star formation in the surrounding sources, i.e.
NGC 7318a/b, the star-forming region SQ-A at the northern tip
of the shock structure, and NGC 7319. The extinction-corrected
FUV luminosities of these main sources surrounding the ridge are
(see
Table 2).
What is the origin of this UV radiation in the shock? We estimate the
UV emission in the ridge that comes from H II
regions associated with star formation in the surrounding sources, i.e.
NGC 7318a/b, the star-forming region SQ-A at the northern tip
of the shock structure, and NGC 7319. The extinction-corrected
FUV luminosities of these main sources surrounding the ridge are
![]() ,
,
![]() ,
and
,
and
![]() (Xu et al. 2005).
Assuming that their distances to the center of the ridge are 10, 20 and
25 kpc, respectively, we find that the total UV flux in the
ridge is
(Xu et al. 2005).
Assuming that their distances to the center of the ridge are 10, 20 and
25 kpc, respectively, we find that the total UV flux in the
ridge is ![]() erg s-1 cm-2,
i.e.
erg s-1 cm-2,
i.e. ![]() in Habing units. Most of the UV flux originates in
NGC 7318a/b. Although this simple calculation does not take
into account the extinction between the UV sources and the ridge, it
shows that this estimate of the UV field is roughly consistent with our
estimate from UV observations. The very small number (of the order of
unity) of star clusters that lie within the center of the
SQ shock (Gallagher
et al. 2001) shows that their contribution to the UV
field is small.
in Habing units. Most of the UV flux originates in
NGC 7318a/b. Although this simple calculation does not take
into account the extinction between the UV sources and the ridge, it
shows that this estimate of the UV field is roughly consistent with our
estimate from UV observations. The very small number (of the order of
unity) of star clusters that lie within the center of the
SQ shock (Gallagher
et al. 2001) shows that their contribution to the UV
field is small.
The SED of the stellar component of the radiation field is
shown in Fig. 5
(green dashed line). We use the Mathis
et al. (1983) ISRF, scaled by a factor of 1.4 to fit
the FUV and NUV GALEX photometry. The HST
V-band and WIRC near-IR
photometric measurements (see Sect. 2.2.3
for observational details) are overlaid on Fig. 5
(see Table 3).
The colors of the J, H, and ![]() fluxes do not exactly match that of the (Mathis
et al. 1983) radiation field, but we recall that
these measurements are uncertain (because at these wavelengths, the
radiation field is anisotropic, see Sect. 3.1.2).
This effect does not significantly affect our dust modeling because the
near-IR part of the radiation field has a small impact on the dust
emission.
fluxes do not exactly match that of the (Mathis
et al. 1983) radiation field, but we recall that
these measurements are uncertain (because at these wavelengths, the
radiation field is anisotropic, see Sect. 3.1.2).
This effect does not significantly affect our dust modeling because the
near-IR part of the radiation field has a small impact on the dust
emission.
5.2.2 Photo-ionizing radiation field: shock and precursor components
![\begin{figure}
\par\includegraphics[angle=90, width = 14.5cm,clip]{13430fg6.eps}
\end{figure}](/articles/aa/full_html/2010/10/aa13430-09/img188.png)
|
Figure 5:
The 2-component SED of the radiation field (stellar + shock) used as
input for dust models to calculate the dust emission from molecular
gas. The radiation field is the sum of an ISRF of intensity
|
| Open with DEXTER | |
In the shock sub-region, the [O I]6300 Å and
[N II]6584 Å to H![]() line ratios are
line ratios are ![]() 0.7
and
0.7
and ![]() 0.3,
respectively, which is evidence of shock ionization (Xu et al. 2003). We
therefore model the SED of the ionizing field using emission from a
radiative shock. In the following, we constrain the shock parameters we
use to model the emission from the ionized gas. The mid-IR IRS
spectrum extracted from the core of the shock (Fig. 3)
exhibits fine-structure line emission from [Ne II]
0.3,
respectively, which is evidence of shock ionization (Xu et al. 2003). We
therefore model the SED of the ionizing field using emission from a
radiative shock. In the following, we constrain the shock parameters we
use to model the emission from the ionized gas. The mid-IR IRS
spectrum extracted from the core of the shock (Fig. 3)
exhibits fine-structure line emission from [Ne II]
![]() m,
[Ne III]
m,
[Ne III]
![]() m,
[Fe II]
m,
[Fe II]
![]() m,
[S III]
m,
[S III]
![]() m,
and [Si II]
m,
and [Si II]
![]() m.
The spatial distribution of this emission and mid-IR line diagnostics
of the excitation mechanisms are discussed in Cluver
et al. (2010). We summarize here the main results
that are relevant to constraining the shock parameters.
m.
The spatial distribution of this emission and mid-IR line diagnostics
of the excitation mechanisms are discussed in Cluver
et al. (2010). We summarize here the main results
that are relevant to constraining the shock parameters.
The comparison between the high value of
![]() and
shock models (Hartigan
et al. 1987; Allen et al. 2008)
allows us to firmly constrain the range of shock velocities to be
and
shock models (Hartigan
et al. 1987; Allen et al. 2008)
allows us to firmly constrain the range of shock velocities to be ![]() 80-200 km s-1
(Cluver et al. 2010).
In the case of clumpy gas, if we were to consider the line emission
from the shock only (discarding line emission from the pre-shock gas
ionized by emission from the shocked gas), the upper limit to the shock
velocities would be a little higher (300 instead
of 200 km s-1). In
addition, the comparison of the [S III]
80-200 km s-1
(Cluver et al. 2010).
In the case of clumpy gas, if we were to consider the line emission
from the shock only (discarding line emission from the pre-shock gas
ionized by emission from the shocked gas), the upper limit to the shock
velocities would be a little higher (300 instead
of 200 km s-1). In
addition, the comparison of the [S III]
![]() [S
III]
[S
III]
![]() m
line ratios with these shock models constrains the pre-shock gas
density to be
m
line ratios with these shock models constrains the pre-shock gas
density to be ![]() cm-3.
In the following, we therefore adopt a shock velocity of
cm-3.
In the following, we therefore adopt a shock velocity of
![]() km s-1
and a pre-shock density of
km s-1
and a pre-shock density of ![]() cm-3.
The photoionizing emission spectrum from shocked gas is taken from the
library of the Mappings III shock code
cm-3.
The photoionizing emission spectrum from shocked gas is taken from the
library of the Mappings III shock code![]() (Allen et al. 2008).
We normalize the shock spectrum to the observed H
(Allen et al. 2008).
We normalize the shock spectrum to the observed H![]() flux
flux![]() . After this normalization,
the SED of the ionizing shock emission is weakly sensitive to the two
main shock parameters, the shock velocity and the gas density.
. After this normalization,
the SED of the ionizing shock emission is weakly sensitive to the two
main shock parameters, the shock velocity and the gas density.
Figure 5
shows the SED of the radiation field that we use as input for the DUSTEM
code to compute the outcoming dust emission from the molecular and
ionized gas. The black solid line is the sum of the two contributions
(stellar + shock) to the radiation field. The shock spectrum itself is
mostly composed of thermal bremsstrahlung (free-free) continuum and
resonance lines arising from many different elements and ionic stages.
It also exhibits a prominent low-temperature bound-free continuum of
hydrogen, produced in the cool, partially-ionized zone of the
recombination region of the shock, and the strong hydrogen two-photon
continuum produced mostly by the down-conversion of Ly![]() photons trapped in this same region of the shock structure. The
bound-free continuum arising from the heavier elements is also present,
though to a much weaker scale, with the helium continuum being the most
obvious.
photons trapped in this same region of the shock structure. The
bound-free continuum arising from the heavier elements is also present,
though to a much weaker scale, with the helium continuum being the most
obvious.
In the case of fast shocks (
![]() km s-1),
the shocked medium emits UV radiation that ionizes the pre-shock medium
before it is shocked. A so-called radiative precursor
propagates ahead of the shock, with an ionization front velocity that
exceeds that of the shock. The contribution of the precursor itself is
indicated in Fig. 5
by the red dotted line. The green dashed line shows the contribution of
the
km s-1),
the shocked medium emits UV radiation that ionizes the pre-shock medium
before it is shocked. A so-called radiative precursor
propagates ahead of the shock, with an ionization front velocity that
exceeds that of the shock. The contribution of the precursor itself is
indicated in Fig. 5
by the red dotted line. The green dashed line shows the contribution of
the ![]() ISRF. The UV GALEX, H
ISRF. The UV GALEX, H![]() line, and near-IR WIRC fluxes in the center of the
shock are indicated.
line, and near-IR WIRC fluxes in the center of the
shock are indicated.
The contribution of the precursor to the total H II
column density and radiative flux depends on the clumpiness of the
pre-shock medium.
This contribution is negligible if the molecular gas is clumpy, i.e.
fragmented into dense (
![]() cm-3)
clouds that have a small volume filling factor, because most of the
ionizing photons do not interact with neutral gas but with the
volume-filling, hot plasma that is optically thin to ionizing
radiation. However, diffuse H2 gas is
expected to have a much higher volume-filling factor. Our modeling of
the dust emission from the ionized gas takes into account the precursor
contribution, weighted by the volume-filling factor of the clumpy
molecular gas.
cm-3)
clouds that have a small volume filling factor, because most of the
ionizing photons do not interact with neutral gas but with the
volume-filling, hot plasma that is optically thin to ionizing
radiation. However, diffuse H2 gas is
expected to have a much higher volume-filling factor. Our modeling of
the dust emission from the ionized gas takes into account the precursor
contribution, weighted by the volume-filling factor of the clumpy
molecular gas.
6 On the structure of the molecular gas
The dust emission depends on the optical thickness of the molecular gas to UV radiation. Is the molecular gas diffuse or fragmented in optically thick clumps? In Sect. 6.1, we describe the assumptions we make about the structure of the molecular gas. We then present the results of our modeling of the dust emission in the SQ shock. We discuss the dust emission for the two physical structures of the H2 gas presented in Sect. 6.1: diffuse (Sect. 6.2) and clumpy molecular gas (Sect. 6.3). Both models include the contribution of the ionized gas (H II) to the dust emission (this calculation is described in Sect. 6.4). This detailed modeling is fitted to mid-IR observations, and used to investigate the influence of the structure of the molecular gas on the FIR dust SED.
6.1 Two limiting cases for the structure of the molecular gas
![\begin{figure}
\par\includegraphics[width = 4.3cm,clip]{13430fg7.eps}\hspace*{2mm}
\includegraphics[width = 4.3cm,clip]{13430fg8.eps}
\end{figure}](/articles/aa/full_html/2010/10/aa13430-09/img201.png)
|
Figure 6: Sketch of the two limiting physical states of the multiphase molecular gas we consider in the framework of our modeling of dust emission. (Left) Dust is associated with diffuse molecular gas that is broken into fragments, filaments, or sheets, penetrated by UV radiation. (Right) The dusty molecular gas is in clouds that are optically thick to UV light. |
| Open with DEXTER | |
The spectral energy distribution of the dust emission depends also on the structure of the molecular gas, and in particular on the optical depth of the clouds. The physical structure of the molecular gas in the SQ shock is an open question. In the following, we explore these two cases.
- 1.
- The molecular gas is diffuse, like the gas observed in the solar neighborhood by UV spectroscopy (e.g., Rachford et al. 2002) and across the Galaxy by observations of mid-IR H2 line emission (Falgarone et al. 2005). In this case, we assume that the molecular gas is optically thin to UV radiation.
- 2.
- The molecular gas is within clouds that are optically thick to UV photons, as those observed in star-forming regions.
To compute the dust emission from optically thick (to
UV photons) clouds (Fig. 6, right
panel), we use the Meudon PDR (Photon Dominated
Region) code (Le Petit
et al. 2006) to compute the radiative transfer
through the cloud. This 1-dimensional, steady-state model considers a
stationary plane-parallel slab of gas and dust, illuminated by UV
radiation. The radiation field output ![]() of the Meudon PDR code is used as input to
the DUSTEM program to compute the spectral energy
distribution (SED) of the
dust as a function of the optical depth into the cloud. This 2-step
process is iterated to take into account dust heating by the dust IR
emission. Usually 4-5 iterations are needed before the
radiation field converges.
of the Meudon PDR code is used as input to
the DUSTEM program to compute the spectral energy
distribution (SED) of the
dust as a function of the optical depth into the cloud. This 2-step
process is iterated to take into account dust heating by the dust IR
emission. Usually 4-5 iterations are needed before the
radiation field converges.
6.2 Dust emission from diffuse molecular gas
![\begin{figure}
\par\includegraphics[width = 14cm,clip]{13430fg9.eps}\par\vspace*{2mm}
\includegraphics[width = 14cm,clip]{13430f10.eps}
\par\end{figure}](/articles/aa/full_html/2010/10/aa13430-09/img203.png)
|
Figure 7:
SED of the dust emission associated with diffuse (top)
or clumpy (bottom) molecular gas. The cloud is
exposed to a radiation field consisting of a mixture (stellar + shock)
of the Mathis et al. (1977)
ISRF (scaled by a factor |
| Open with DEXTER | |
The DUSTEM code is used to model the dust
emission from diffuse molecular gas (Sect. 5.1),
penetrated by UV photons.
The cloud is illuminated by a composite field, made up of a stellar
component (ISRF of intensity
![]() Habing
units) and the ionizing radiation from the shocked gas (see
Sect. 5.2
and Fig. 5).
The dust properties are those of Sect. 5.1. The
abundances and size distribution of the dust grains are Galactic. The
dust emission from the ionized gas is included in the model SED. It is
calculated separately with the DUSTEM code and
added to the contribution of the cloud (see Sect. 6.4).
Habing
units) and the ionizing radiation from the shocked gas (see
Sect. 5.2
and Fig. 5).
The dust properties are those of Sect. 5.1. The
abundances and size distribution of the dust grains are Galactic. The
dust emission from the ionized gas is included in the model SED. It is
calculated separately with the DUSTEM code and
added to the contribution of the cloud (see Sect. 6.4).
The top panel of Fig. 7 shows
the ![]() m SED resulting from the model
(black solid line), so that both the UV radiation field and IR dust
emission can be seen. The dashed line (in the bottom right corner of
the plot) shows the dust emission from the H II
gas. The other three broken curves show the contributions of the
different populations of dust grains, i.e., PAHs, VSGs, and BGs,
respectively.
The GALEX, WIRC, and Spitzer
fluxes are indicated for comparison (see Sect. 3,
Tables 1-3). The
7.7, 11.3, and
m SED resulting from the model
(black solid line), so that both the UV radiation field and IR dust
emission can be seen. The dashed line (in the bottom right corner of
the plot) shows the dust emission from the H II
gas. The other three broken curves show the contributions of the
different populations of dust grains, i.e., PAHs, VSGs, and BGs,
respectively.
The GALEX, WIRC, and Spitzer
fluxes are indicated for comparison (see Sect. 3,
Tables 1-3). The
7.7, 11.3, and ![]() m
points are the peak values of the PAH bands detected in the IRS
spectrum (Sect. 4.3).
Other points come from imaging broadband photometry (GALEX, HST, IRAC,
and MIPS) measurements performed in the center of the SQ ridge
(over an aperture of 17'' in diameter, see Sect. 3).
m
points are the peak values of the PAH bands detected in the IRS
spectrum (Sect. 4.3).
Other points come from imaging broadband photometry (GALEX, HST, IRAC,
and MIPS) measurements performed in the center of the SQ ridge
(over an aperture of 17'' in diameter, see Sect. 3).
The 11.3, 16 and ![]() m
data points are used to fit the model SED. Since it may be a lower
limit, the
m
data points are used to fit the model SED. Since it may be a lower
limit, the ![]() m
point was not included in the fit.
The gas column density is the only free parameter to fit the data. The
model SED is obtained by multiplying the emissivity output of the DUSTEM
code with the column density of warm molecular gas determined by
fitting the SED to the mid-IR data. We find that the column density
that most closely fits the data is
m
point was not included in the fit.
The gas column density is the only free parameter to fit the data. The
model SED is obtained by multiplying the emissivity output of the DUSTEM
code with the column density of warm molecular gas determined by
fitting the SED to the mid-IR data. We find that the column density
that most closely fits the data is
![]() cm-2
for a Galactic dust-to-gas mass ratio. This column density obtained
from the model is close to the column density derived from the H2 line
fluxes (
cm-2
for a Galactic dust-to-gas mass ratio. This column density obtained
from the model is close to the column density derived from the H2 line
fluxes (
![]() cm-2)
within this aperture. This column density is obtained by fitting the
rotational H2 line fluxes with C-shocks
models as described in Guillard
et al. (2009).
This suggests that the column density of cold (
cm-2)
within this aperture. This column density is obtained by fitting the
rotational H2 line fluxes with C-shocks
models as described in Guillard
et al. (2009).
This suggests that the column density of cold (![]() K) molecular gas is
much smaller than that of the warm H2. However,
this may not be the case because the dust-to-gas mass ratio is possibly
lower than the Galactic value we assumed here, and the molecular gas
may be in clumps optically thick to UV photons (see next section).
K) molecular gas is
much smaller than that of the warm H2. However,
this may not be the case because the dust-to-gas mass ratio is possibly
lower than the Galactic value we assumed here, and the molecular gas
may be in clumps optically thick to UV photons (see next section).
6.3 Dust emission from clumpy molecular gas
We model the dust emission associated with molecular gas fragmented
into clumps that are optically thick to UV radiation.
Here the DUSTEM and Meudon PDR
codes (see Sect. 5.1)
are combined to calculate the emission from a molecular cloud of total AV
= 3. The column density of the cloud is thus
![]() cm-2.
The choice of the AV
value is arbitrary.
We check that the model SED in the mid-IR domain does not depend much
on the total AV
because the mid-IR emission comes mainly from the surface of the cloud.
The cloud is illuminated by a composite field (stellar + shock),
consisting of the ISRF of intensity
cm-2.
The choice of the AV
value is arbitrary.
We check that the model SED in the mid-IR domain does not depend much
on the total AV
because the mid-IR emission comes mainly from the surface of the cloud.
The cloud is illuminated by a composite field (stellar + shock),
consisting of the ISRF of intensity
![]() (Habing
units) and the ionizing radiation from the shocked gas (see
Sect. 5.2
and Fig. 5).
(Habing
units) and the ionizing radiation from the shocked gas (see
Sect. 5.2
and Fig. 5).
Figure 7
shows the sum of the outcoming radiation (cloud + ionized gas)
emission spectrum and the incoming radiation, from the UV to the FIR (
![]() m). The dashed line shows the
emission from the ionized gas. The UV and IR photometric measurements
are overlaid for comparison between data and models.
m). The dashed line shows the
emission from the ionized gas. The UV and IR photometric measurements
are overlaid for comparison between data and models.
From UV to FIR wavelengths, the total SED (solid black line)
consists of the ISRF, including the free-free, free-bound, and
resonance line emission from the shocked gas, and the dust emission
including the AIBs, the emission from the VSGs, and the grey body of
the BGs at long wavelengths. The spectrum also exhibits some
fine-structure IR lines, indicated in the spectrum, e.g., ![]() m [S III],
m [S III],
![]() m [Si II],
and
m [Si II],
and ![]() m
[C II].
To fit the data, the model IR emission from the cloud is scaled by a
factor of f=0.03, which represents an effective
surface-filling factor for the molecular gas.
The low value of f is consistent with the low value
of the average optical extinction in the shock region. For clumps of AV
= 3, the average column density of the cloud phase is thus
m
[C II].
To fit the data, the model IR emission from the cloud is scaled by a
factor of f=0.03, which represents an effective
surface-filling factor for the molecular gas.
The low value of f is consistent with the low value
of the average optical extinction in the shock region. For clumps of AV
= 3, the average column density of the cloud phase is thus
![]() cm-2.
Our specific choice of AV
= 3 leads to a value of
cm-2.
Our specific choice of AV
= 3 leads to a value of
![]() that
is consistent with the column density of the warm H2 gas
seen by Spitzer. For larger values of AV,
the total column density of molecular gas will be larger than the
column density of warm H2 inferred from
rotational lines.
that
is consistent with the column density of the warm H2 gas
seen by Spitzer. For larger values of AV,
the total column density of molecular gas will be larger than the
column density of warm H2 inferred from
rotational lines.
![\begin{figure}
\par\includegraphics[width = 17.5cm,clip]{13430f11.eps}
\par\end{figure}](/articles/aa/full_html/2010/10/aa13430-09/img212.png)
|
Figure 8:
Comparison between the two models presented in this paper: diffuse
(dashed blue line, same model as Fig. 7) and
clumpy (black line, same model as Fig. 7)
molecular gas. The overlaid points indicate the Spitzer
fluxes extracted within the shock region (see bottom right inset). The
gas lines are removed from these spectra, as well as the IR component
of the incident ISRF (
|
| Open with DEXTER | |
6.4 Dust emission from shock- and precursor-ionized gas
We describe how we calculated the emission from dust associated with
the ionized gas. This contribution was added to both models (diffuse
and clumpy). We used the input radiation field of Fig. 5,
including the ionizing part of the spectrum (
![]() Å), to compute the
dust emissivity with the DUSTEM code. The column
density of ionized gas was constrained by the integrated flux of the
Å), to compute the
dust emissivity with the DUSTEM code. The column
density of ionized gas was constrained by the integrated flux of the ![]() m
[Ne II] fine-structure line,
m
[Ne II] fine-structure line,
![]() ,
measured on the IRS spectrum. The
,
measured on the IRS spectrum. The
![]() line
flux ratio is low
line
flux ratio is low![]() ,
which implies that Ne II is the
main ionization state of Ne in the shock. Therefore, the column density
of ionized gas can be expressed as
,
which implies that Ne II is the
main ionization state of Ne in the shock. Therefore, the column density
of ionized gas can be expressed as
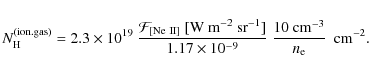
We used the relation between the [Ne II] line intensity and the emission measure given in Ho & Keto (2007) and we assumed that the electronic density of the 104 K gas is
The dust emission associated with this amount of ionized gas is the black dashed line in the top plot of Fig. 7. The column density of the ionized gas being one order of magnitude smaller than that of the warm H2, the contribution of the ionized gas to the IR dust emission is negligible.
6.5 Comparison between models and degeneracies
Figure 8 shows the comparison between the result of the two models presented above. We focus on the dust emission, so the gas lines and the stellar continuum from the ISRF are removed from the spectra. The FIR SEDs are different between the two models. The FIR peak brightness of the SED of the diffuse molecular gas is brighter (by a factor of 1.7) and shifted towards shorter wavelengths than the clumpy model. This difference can be easily explained. When the molecular gas is clumpy, the dust grains see, on average, an attenuated radiation field, and are thus colder than in the diffuse model. For a given column density of matter, the FIR brightness is also fainter.
Current observations do not allow us to decide whether the gas
is diffuse or fragmented into optically thick clumps. The spatial
resolution of Spitzer at long wavelengths (
![]() m) is not high enough to
obtain accurate photometric measurements. FIR observations with the Herschel
Space Telescope will provide the sensitivity and angular
resolution needed to test our models.
However, it may not be so straightforward to conclude anything about
the structure of the molecular gas because we assume a Galactic
dust-to-gas mass ratio and size distribution.
The IR SED also depends on the relative abundances of VSGs
and BGs.
m) is not high enough to
obtain accurate photometric measurements. FIR observations with the Herschel
Space Telescope will provide the sensitivity and angular
resolution needed to test our models.
However, it may not be so straightforward to conclude anything about
the structure of the molecular gas because we assume a Galactic
dust-to-gas mass ratio and size distribution.
The IR SED also depends on the relative abundances of VSGs
and BGs.
We defer the discussion about future observations needed to
differentiate between the cloud structure and the dust size
distribution to Sect. 8. We also
note that we cannot estimate the total dust extinction from the models,
given the lack of observational constraints in the FIR. The AV
value may be higher than the value derived from our modeling if the
total H2 column density including cold
molecular gas is higher than that derived from the mid-IR H2
rotational lines. If we assume that the molecular gas is diffuse and
![]() cm-2,
this corresponds to AV=0.1.
This is smaller than the average value derived from optical
observations (
cm-2,
this corresponds to AV=0.1.
This is smaller than the average value derived from optical
observations (
![]() in the main shock region for
the diffuse emission).
in the main shock region for
the diffuse emission).
7 Dust processing in the Stephan's Quintet shock?
The Stephan's Quintet galaxy-wide collision is an extreme environment
where observations and modeling dust emission may provide insight into
dust processing in shocks. The galaxy collision must have triggered
shocks across the whole ISM. As discussed in Guillard
et al. (2009), the shock velocity depends on the
preshock gas density. Gas at preshock densities
![]() cm-3
has been shocked at velocities small enough (
cm-3
has been shocked at velocities small enough (
![]() km s-1)
to cool, to keep most of its dust, and to become molecular within a few
million years.
To account for the H2 emission, the
molecular gas must be processed by low-velocity
(5-20 km s-1) MHD shocks,
repeatedly. Therefore, the origin and dynamical state of the
SQ molecular gas is very different from that of the Galactic
ISM.
km s-1)
to cool, to keep most of its dust, and to become molecular within a few
million years.
To account for the H2 emission, the
molecular gas must be processed by low-velocity
(5-20 km s-1) MHD shocks,
repeatedly. Therefore, the origin and dynamical state of the
SQ molecular gas is very different from that of the Galactic
ISM.
In the previous section, we assumed that the dust properties in the SQ ridge are identical to those of the Galaxy, which obviously is a simplifying assumption, that may be far from reality. In the shock region, various processes can affect dust grains (e.g., thermal sputtering of grains in the hot gas or destruction in shocks due to gas-grain and grain-grain interactions, see Jones 2004, and references therein) that can affect both the dust-to-gas mass ratio and the dust size distribution. To date, observational evidence of dust processing has come mainly from gas-phase depletions of metals (Sembach & Savage 1996). To our knowledge, there is no direct observational evidence of changes in the dust size distribution that can be unambiguously associated with shock-processing. Stephan's Quintet is an outstanding target to look for such evidence on galactic scales.
Dust destruction processes depend on the type of shocks. Guillard et al. (2009)
show that within the timescale of the galaxy collision (![]()
![]() yr), the destruction
of grains smaller than
yr), the destruction
of grains smaller than ![]()
![]() m is
complete in the hot, teneous gas (corresponding to pre-shock densities
m is
complete in the hot, teneous gas (corresponding to pre-shock densities
![]() cm-3)
that is shocked at high velocities (
cm-3)
that is shocked at high velocities (
![]() km s-1).
For intermediate preshock densities (
km s-1).
For intermediate preshock densities (
![]() cm-3,
cm-3,
![]() km s-1),
models predict significant dust destruction (10-50% in mass) and
possibly the production of an excess of small grains by shattering
(e.g., Jones & Tielens 1994).
Within the dense (
km s-1),
models predict significant dust destruction (10-50% in mass) and
possibly the production of an excess of small grains by shattering
(e.g., Jones & Tielens 1994).
Within the dense (
![]() cm-3)
molecular gas, low-velocity MHD
cm-3)
molecular gas, low-velocity MHD![]() shocks (5-20 km s1), may have
little effect on dust (Gusdorf et al. 2008; Guillet
et al. 2007).
shocks (5-20 km s1), may have
little effect on dust (Gusdorf et al. 2008; Guillet
et al. 2007).
The present SQ data provide some constraints on the
dust size distribution.
The detection of PAH emission from such a violent and extreme
environment as the SQ shock may be seen as a surprise. PAHs
are predicted to be completely destroyed for
![]() km s-1
(
km s-1
(
![]() cm-3)
and their structure would be deeply affected for
cm-3)
and their structure would be deeply affected for
![]() km s-1
(Micelotta et al. 2010).
The PAH detection therefore provides interesting constraints on the
density structure of the preshock gas.
Since it is unlikely that PAHs reform efficiently from carbon atoms in
the postshock gas, we conclude that (i) they were
protected from high-velocity shocks in high preshock density regions (
km s-1
(Micelotta et al. 2010).
The PAH detection therefore provides interesting constraints on the
density structure of the preshock gas.
Since it is unlikely that PAHs reform efficiently from carbon atoms in
the postshock gas, we conclude that (i) they were
protected from high-velocity shocks in high preshock density regions (
![]() cm-3),
or/and (ii) they are the products of the shattering
of VSGs in the shock.
cm-3),
or/and (ii) they are the products of the shattering
of VSGs in the shock.
We note that the ![]() m AIB is absent and that the
m AIB is absent and that the ![]() m complex is
prominent. This suggests that large PAHs, which emit more efficiently
at longer wavelengths (e.g., Draine
& Li 2007), are predominant in the shock. This may
result from PAH processing in shocks, larger molecules being less
fragile than smaller ones (Micelotta
et al. 2010). This interpretation is supported by Spitzer
observations by Tappe
et al. (2006) that show a prominent
m complex is
prominent. This suggests that large PAHs, which emit more efficiently
at longer wavelengths (e.g., Draine
& Li 2007), are predominant in the shock. This may
result from PAH processing in shocks, larger molecules being less
fragile than smaller ones (Micelotta
et al. 2010). This interpretation is supported by Spitzer
observations by Tappe
et al. (2006) that show a prominent ![]() m emission
from the supernova remnant N132D in the Large Magellanic Cloud.
m emission
from the supernova remnant N132D in the Large Magellanic Cloud.
![\begin{figure}
\par\includegraphics[angle=90,width = 8.5cm,clip]{13430f12.eps}
\end{figure}](/articles/aa/full_html/2010/10/aa13430-09/img235.png)
|
Figure 9:
Predicted |
| Open with DEXTER | |
The ![]() m
flux ratio is sensitive to the relative mass abundances of PAHs and
VSGs. Figure 9
shows the predicted
m
flux ratio is sensitive to the relative mass abundances of PAHs and
VSGs. Figure 9
shows the predicted ![]() m
flux ratio as a function of the PAH/VSG dust mass ratio. For each
PAH/VSG ratio, the dust emission spectrum is calculated for an ISRF of
m
flux ratio as a function of the PAH/VSG dust mass ratio. For each
PAH/VSG ratio, the dust emission spectrum is calculated for an ISRF of
![]() with
the DUSTEM code. We derive the 12 and
with
the DUSTEM code. We derive the 12 and ![]() m fluxes by
integrating the model spectrum over the
m fluxes by
integrating the model spectrum over the ![]() m IRAS and
m IRAS and
![]() m MIPS
filter bandpasses. The PAH/VSG mass ratio in the SQ shock is
remarkably close to the value for the Galactic diffuse ISM. A deviation
would be expected if the dust had been processed by high-speed
(>100 km s-1) shocks (Jones et al. 1996). As
for PAHs, this suggests that the postshock dust was lying in gas dense
enough to have been protected
from destruction by fast shocks, and thus was protected from the effect
of fast shocks, as proposed by Guillard
et al. (2009). However, as discussed in
Sect. 4.3.2,
the PAH spectrum in the shock is significantly different from that
observed in the diffuse Galactic ISM. The fact that the long wavelength
bands (11.3 and 17
m MIPS
filter bandpasses. The PAH/VSG mass ratio in the SQ shock is
remarkably close to the value for the Galactic diffuse ISM. A deviation
would be expected if the dust had been processed by high-speed
(>100 km s-1) shocks (Jones et al. 1996). As
for PAHs, this suggests that the postshock dust was lying in gas dense
enough to have been protected
from destruction by fast shocks, and thus was protected from the effect
of fast shocks, as proposed by Guillard
et al. (2009). However, as discussed in
Sect. 4.3.2,
the PAH spectrum in the shock is significantly different from that
observed in the diffuse Galactic ISM. The fact that the long wavelength
bands (11.3 and 17![]() m)
are brighter than the 6.2 and 7.7
m)
are brighter than the 6.2 and 7.7![]() m features imply that a higher fraction of the
PAH emission is emitted within the 12
m features imply that a higher fraction of the
PAH emission is emitted within the 12![]() m IRAS band. If this were true, this correction
would imply a lower PAH/VSGs abundance than in the Galactic diffuse
ISM.
m IRAS band. If this were true, this correction
would imply a lower PAH/VSGs abundance than in the Galactic diffuse
ISM.
Far-IR SED imaging of the dust, possible with the PACS![]() and SPIRE
and SPIRE![]() instruments onboard Herschel,
combined with modeling of the full IR spectral energy distribution,
would provide diagnostics for measuring the relative abundances of the
different grain populations.
instruments onboard Herschel,
combined with modeling of the full IR spectral energy distribution,
would provide diagnostics for measuring the relative abundances of the
different grain populations.
In our modeling (Sect. 6), we did not
consider any thermal emission from collisionally heated dust in the hot
plasma.
This emission may arise after a fast shock wave traveled through
tenuous, dusty gas, but it will last a very short period of time (![]() 106 yr),
producing a ``flash'' of FIR emission, because the dust cooling
efficiency drops as the grain sputtering occurs in the hot (>106 K)
gas (Guillard
et al. 2009; Smith et al. 1996).
However, there are two reasons why this may not be a valid assumption.
First, if there is significant dust mass in grains larger than about
106 yr),
producing a ``flash'' of FIR emission, because the dust cooling
efficiency drops as the grain sputtering occurs in the hot (>106 K)
gas (Guillard
et al. 2009; Smith et al. 1996).
However, there are two reasons why this may not be a valid assumption.
First, if there is significant dust mass in grains larger than about ![]() m, this dust
may survive for
m, this dust
may survive for ![]()
![]() yr. These grains may
contribute to the FIR emission, as proposed by Xu
et al. (2003) and further investigated by Natale
et al. (in prep.). Second, we cannot exclude that some dust
may be injected into the hot phase by the ablation of clouds (turbulent
mixing), due to their dynamical interaction with the background plasma (Guillard et al. 2009).
A continuous supply of dust from the warm to hot phase could balance
destruction by sputtering. This possibility needs to be quantified, but
was beyond the scope of this paper.
yr. These grains may
contribute to the FIR emission, as proposed by Xu
et al. (2003) and further investigated by Natale
et al. (in prep.). Second, we cannot exclude that some dust
may be injected into the hot phase by the ablation of clouds (turbulent
mixing), due to their dynamical interaction with the background plasma (Guillard et al. 2009).
A continuous supply of dust from the warm to hot phase could balance
destruction by sputtering. This possibility needs to be quantified, but
was beyond the scope of this paper.
8 Summary and concluding remarks
In this paper, we have presented new Spitzer imaging and spectroscopic observations that reveal PAH and VSG emission from the galaxy-scale shock in Stephan's Quintet (SQ). We now provide our main observational results:
- Faint dust emission was detected at the center of the H2-bright
SQ shock structure, outside star-forming regions lying in the
SQ halo. The m
flux density ratio in the SQ ridge is remarkably similar to
that of the diffuse Galactic ISM. This suggests that the PAH to VSG
abundance ratio is similar to that of the diffuse ISM of the Galaxy.
- The global mid-IR SED is consistent with the expected dust
emission from the amount of warm H2 detected
by Spitzer (
 cm-2)
for a UV radiation field intensity of
cm-2)
for a UV radiation field intensity of
 [Habing
unit], which is consistent with UV observations of the shock.
[Habing
unit], which is consistent with UV observations of the shock.
- The PAH emission spectrum in the SQ shock differs
significantly from that of the diffuse Galactic ISM. The 7.7, 11.3, and
 m aromatic
bands are detected, but the
m aromatic
bands are detected, but the  m band is absent. The m complex is
prominent, but the
m band is absent. The m complex is
prominent, but the  m
is not detected. Interestingly, the
m
is not detected. Interestingly, the
 m
flux ratio
in the SQ shock is a factor 2 lower than that of the
diffuse Galactic PAHs. These characteristics may be indicative of an
enhanced fraction of neutral and large PAHs.
m
flux ratio
in the SQ shock is a factor 2 lower than that of the
diffuse Galactic PAHs. These characteristics may be indicative of an
enhanced fraction of neutral and large PAHs.
- We have modeled the emission from dust associated with
diffuse or clumpy molecular gas, embedded within H II
gas and X-ray emitting plasma. The model SED is consistent with mid-IR Spitzer
observations for both cases, for a Galactic dust-to-gas mass ratio and
a Galactic dust size distribution. For diffuse gas, the best-fit column
density is
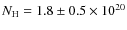 cm-2,
which is close to the value derived from warm H2 observations.
For clumpy molecular clouds that are optically thick to UV radiation,
we found that the H2 surface filling
factor is
cm-2,
which is close to the value derived from warm H2 observations.
For clumpy molecular clouds that are optically thick to UV radiation,
we found that the H2 surface filling
factor is  .
So far, the present data and the degeneracy between the dust size
distribution and the cloud structure do not allow us to decide whether
the molecular gas is diffuse or fragmented into clouds that are
optically thick to UV photons.
.
So far, the present data and the degeneracy between the dust size
distribution and the cloud structure do not allow us to decide whether
the molecular gas is diffuse or fragmented into clouds that are
optically thick to UV photons.
- The presence of dust in the SQ shock shows that
dust is able to survive in such a violent environment. We propose that
at the time of the high-speed galaxy encounter, the dust that survived
destruction was in pre-shock gas of density higher than a few
0.1 cm-3, which had not been shocked at
velocities larger than 200 km s-1
(see Guillard et al. 2009).
Current data do not allow us to identify a plausible impact of the
shock on the dust size distribution, but the peculiar properties of the
PAH emission in the SQ ridge (summarized above) may be the
result of PAH processing in shocks.
The Stephan's Quintet galaxy-collision is a unique environment for studying dust survival in shocks, on galactic scales. The presence of dust in the SQ shock highlights the need to revisit the standard calculations of dust survival timescales in the ISM, by taking into account its multiphase structure.
AcknowledgementsThis work is partly based on observations made with the Spitzer Space Telescope, which is operated by the Jet Propulsion Laboratory, California Institute of Technology under a contract with NASA.GALEX (Galaxy Evolution Explorer) is a NASA small explorer launched in 2003 April. We gratefully acknowledge NASA's support for construction, operation, and science analysis for the GALEX mission, developed in cooperation with the Centre National d'Etudes Spatiales (CNES) of France and the Korean Ministry of Science and Technology.
This research has made use of the NASA/IPAC Extragalactic Database (NED) which is operated by the Jet Propulsion Laboratory, California Institute of Technology, under contract with the National Aeronautics and Space Administration.
P.G. would like to thank M. Gonzalez Garcia and J. Le Bourlot for help about the PDR code, and V. Guillet for helpful discussions about dust processing in shocks. We wish to aknowledge R. Tuffs, C. Popescu, G. Natale and E. Dwek for fruitful discussions we had about dust emission in SQ. The authors are indebted to V. Charmandaris for having provided his deep near-IR images of Stephan's Quintet taken with the WIRC instrument on the Palomar 200-inches telescope. We are grateful to M.G. Allen for making publicly available the Mappings III shock library. We also thanks the anonymous referee for useful comments that helped us improve the clarity of the manuscript and for having suggested the use of optical data.
Appendix A: Fitting PAH features
The results of the PAHFit decompositions of the Spitzer IRS spectrum of the center of SQ ridge and, for comparison, of the ISO-CVF spectrum of the diffuse Galactic medium, are presented in Figs. A.1, A.2, and A.3. No extinction parameter was introduced into the fit.
![\begin{figure}
\par\includegraphics[width =12cm,clip]{13430fA1.eps}
\end{figure}](/articles/aa/full_html/2010/10/aa13430-09/img245.png)
|
Figure A.1:
Result of a PAHFit model fit on the
|
| Open with DEXTER | |
![\begin{figure}
\par\includegraphics[width = 12cm,clip]{13430fA2.eps}
\end{figure}](/articles/aa/full_html/2010/10/aa13430-09/img246.png)
|
Figure A.2: PAHFit decomposition of the Spitzer IRS dust spectrum (smoothed over 5 resolution elements, and from which gas lines have been removed) extracted from the center of the SQ ridge. Blue solid lines shows the Lorentzian components of the PAH decomposition, and the thick gray line is the total (dust + starlight) continuum. The result of the fit is the green solid line. |
| Open with DEXTER | |
![\begin{figure}
\par\includegraphics[width = 12cm,clip]{13430fA3.eps}
\end{figure}](/articles/aa/full_html/2010/10/aa13430-09/img247.png)
|
Figure A.3: PAHFit decomposition of the ISO-CVF spectrum of the diffuse Galactic light (Flagey et al. 2006), centered on the Galactic coordinates (26.8, +0.8). The gas lines have been removed from the spectrum. The Lorentzian components of the decomposition of the PAH features are shown in blue. All components are diminished by the extinction, indicated by the dotted black line, with axis at right. The solid green line is the full fitted model, plotted on the observed flux intensities and uncertainties. |
| Open with DEXTER | |
References
- Allen, M. G., Groves, B. A., Dopita, M. A., Sutherland, R. S., & Kewley, L. J. 2008, ApJS, 178, 20 [Google Scholar]
- Allen, R. J., & Hartsuiker, J. W. 1972, Nature, 239, 324 [NASA ADS] [CrossRef] [PubMed] [Google Scholar]
- Allen, R. J., & Sullivan, III, W. T. 1980, A&A, 84, 181 [NASA ADS] [Google Scholar]
- Appleton, P. N., Xu, K. C., Reach, W., et al. 2006, ApJ, 639, L51 [NASA ADS] [CrossRef] [Google Scholar]
- Bakes, E. L. O., & Tielens, A. G. G. M. 1994, ApJ, 427, 822 [NASA ADS] [CrossRef] [Google Scholar]
- Bakes, E. L. O., Tielens, A. G. G. M., & Bauschlicher, C. W. 2001a, ApJ, 556, 501 [Google Scholar]
- Bakes, E. L. O., Tielens, A. G. G. M., jr, Bauschlicher, C. W., Hudgins, D. M., & Allamandola, L. J. 2001b, ApJ, 560, 261 [NASA ADS] [CrossRef] [Google Scholar]
- Bauschlicher, Jr., C. W. 2002, ApJ, 564, 782 [NASA ADS] [CrossRef] [Google Scholar]
- Cazaux, S., & Tielens, A. G. G. M. 2004, ApJ, 604, 222 [NASA ADS] [CrossRef] [Google Scholar]
- Cluver, M. E., Appleton, P. N., Boulanger, F., et al. 2010, ApJ, 710, 248 [NASA ADS] [CrossRef] [Google Scholar]
- Cohen, M., Wheaton, W. A., & Megeath, S. T. 2003, AJ, 126, 1090 [NASA ADS] [CrossRef] [Google Scholar]
- Compiègne, M., Abergel, A., Verstraete, L., et al. 2007, A&A, 471, 205 [NASA ADS] [CrossRef] [EDP Sciences] [Google Scholar]
- Compiègne, M., Abergel, A., Verstraete, L., & Habart, E. 2008, A&A, 491, 797 [NASA ADS] [CrossRef] [EDP Sciences] [Google Scholar]
- Désert, F.-X., Boulanger, F., & Puget, J. L. 1990, A&A, 237, 215 [NASA ADS] [Google Scholar]
- Draine, B. T., & Li, A. 2001, ApJ, 551, 807 [NASA ADS] [CrossRef] [Google Scholar]
- Draine, B. T., & Li, A. 2007, ApJ, 657, 810 [NASA ADS] [CrossRef] [Google Scholar]
- Falgarone, E., Verstraete, L., Pineau Des Forêts, G., & Hily-Blant, P. 2005, A&A, 433, 997 [NASA ADS] [CrossRef] [EDP Sciences] [Google Scholar]
- Fazio, G. G., Hora, J. L., Allen, L. E., et al. 2004, ApJS, 154, 10 [NASA ADS] [CrossRef] [Google Scholar]
- Flagey, N., Boulanger, F., Verstraete, L., et al. 2006, A&A, 453, 969 [NASA ADS] [CrossRef] [EDP Sciences] [Google Scholar]
- Gallagher, S. C., Charlton, J. C., Hunsberger, S. D., Zaritsky, D., & Whitmore, B. C. 2001, AJ, 122, 163 [NASA ADS] [CrossRef] [Google Scholar]
- Gao, Y., & Xu, C. 2000, ApJ, 542, L83 [NASA ADS] [CrossRef] [Google Scholar]
- Guillard, P., Boulanger, F., Pineau Des Forêts, G., & Appleton, P. N. 2009, A&A, 502, 515 [NASA ADS] [CrossRef] [EDP Sciences] [Google Scholar]
- Guillet, V., Pineau Des Forêts, G., & Jones, A. P. 2007, A&A, 476, 263 [NASA ADS] [CrossRef] [EDP Sciences] [Google Scholar]
- Gusdorf, A., Cabrit, S., Flower, D. R., & Pineau Des Forêts, G. 2008, A&A, 482, 809 [Google Scholar]
- Habing, H. J. 1968, Bull. Astron. Inst. Netherlands, 19, 421 [Google Scholar]
- Hartigan, P., Raymond, J., & Hartmann, L. 1987, ApJ, 316, 323 [NASA ADS] [CrossRef] [Google Scholar]
- Hauser, M. G., Arendt, R. G., Kelsall, T., et al. 1998, ApJ, 508, 25 [NASA ADS] [CrossRef] [Google Scholar]
- Ho, L. C., & Keto, E. 2007, ApJ, 658, 314 [NASA ADS] [CrossRef] [Google Scholar]
- Houck, J. R., Roellig, T. L., van Cleve, J., et al. 2004, ApJS, 154, 18 [NASA ADS] [CrossRef] [Google Scholar]
- Jones, A., & Tielens, A. 1994, The Cold Universe, XIIIth Moriond Astrophysics Meeting, ed. T. Montmerle, C. Lada, I. Mirabel, & J. Thanh Van (Gif-sur Yvette: Éditions Frontières) [Google Scholar]
- Jones, A. P. 2004, in Astrophysics of Dust, ed. A. N. Witt, G. C. Clayton, & B. T. Draine, ASP Conf. Ser., 309, 347 [Google Scholar]
- Jones, A. P., Tielens, A. G. G. M., & Hollenbach, D. J. 1996, ApJ, 469, 740 [NASA ADS] [CrossRef] [Google Scholar]
- Kaneda, H., Onaka, T., & Sakon, I. 2005, ApJ, 632, L83 [NASA ADS] [CrossRef] [Google Scholar]
- Langhoff, S. 1996, J. Phys. Chem., 100, 2819 [CrossRef] [Google Scholar]
- Le Petit, F., Nehmé, C., Le Bourlot, J., & Roueff, E. 2006, ApJS, 164, 506 [NASA ADS] [CrossRef] [EDP Sciences] [Google Scholar]
- Lisenfeld, U., Braine, J., Duc, P.-A., et al. 2002, A&A, 394, 823 [NASA ADS] [CrossRef] [EDP Sciences] [Google Scholar]
- Martin, D. C., Fanson, J., Schiminovich, D., et al. 2005, ApJ, 619, L1 [Google Scholar]
- Mathis, J. S., Rumpl, W., & Nordsieck, K. H. 1977, ApJ, 217, 425 [NASA ADS] [CrossRef] [Google Scholar]
- Mathis, J. S., Mezger, P. G., & Panagia, N. 1983, A&A, 128, 212 [NASA ADS] [Google Scholar]
- Micelotta, E. R., Jones, A. P., & Tielens, A. G. G. M. 2010, A&A, 510, A36+ [NASA ADS] [CrossRef] [EDP Sciences] [Google Scholar]
- Miville-Deschênes, M.-A. & Lagache, G. 2005, ApJS, 157, 302 [NASA ADS] [CrossRef] [Google Scholar]
- Moles, M., Sulentic, J. W., & Marquez, I. 1997, ApJ, 485, L69+ [NASA ADS] [CrossRef] [Google Scholar]
- Morrissey, P., Conrow, T., Barlow, T. A., et al. 2007, ApJS, 173, 682 [NASA ADS] [CrossRef] [Google Scholar]
- O'Sullivan, E., Giacintucci, S., Vrtilek, J. M., Raychaudhury, S., & David, L. P. 2009, ApJ, 701, 1560 [NASA ADS] [CrossRef] [Google Scholar]
- Pietsch, W., Trinchieri, G., Arp, H., & Sulentic, J. W. 1997, A&A, 322, 89 [NASA ADS] [Google Scholar]
- Popescu, C. C., Tuffs, R. J., Fischera, J., & Völk, H. 2000, A&A, 354, 480 [NASA ADS] [Google Scholar]
- Rachford, B. L., Snow, T. P., Tumlinson, J., et al. 2002, ApJ, 577, 221 [NASA ADS] [CrossRef] [Google Scholar]
- Rapacioli, M., Joblin, C., & Boissel, P. 2005, A&A, 429, 193 [NASA ADS] [CrossRef] [EDP Sciences] [Google Scholar]
- Rieke, G. H., Young, E. T., Engelbracht, C. W., et al. 2004, ApJS, 154, 25 [NASA ADS] [CrossRef] [Google Scholar]
- Roussel, H., Helou, G., Hollenbach, D. J., et al. 2007, ApJ, 669, 959 [NASA ADS] [CrossRef] [Google Scholar]
- Sellgren, K., Uchida, K. I., & Werner, M. W. 2007, ApJ, 659, 1338 [NASA ADS] [CrossRef] [Google Scholar]
- Sembach, K. R., & Savage, B. D. 1996, ApJ, 457, 211 [NASA ADS] [CrossRef] [Google Scholar]
- Smith, B. J., & Struck, C. 2001, AJ, 121, 710 [NASA ADS] [CrossRef] [Google Scholar]
- Smith, J. D. T., Dale, D. A., Armus, L., et al. 2004, ApJS, 154, 199 [NASA ADS] [CrossRef] [Google Scholar]
- Smith, J. D. T., Draine, B. T., Dale, D. A., et al. 2007, ApJ, 656, 770 [NASA ADS] [CrossRef] [Google Scholar]
- Smith, R. K., Krzewina, L. G., Cox, D. P., Edgar, R. J., & Miller, W. W. I. 1996, ApJ, 473, 864 [NASA ADS] [CrossRef] [Google Scholar]
- Sulentic, J. W., Rosado, M., Dultzin-Hacyan, D., et al. 2001, AJ, 122, 2993 [NASA ADS] [CrossRef] [Google Scholar]
- Szczepanski, J., & Vala, M. 1993, ApJ, 414, 646 [NASA ADS] [CrossRef] [Google Scholar]
- Tappe, A., Rho, J., & Reach, W. T. 2006, ApJ, 653, 267 [NASA ADS] [CrossRef] [Google Scholar]
- Trinchieri, G., Sulentic, J., Breitschwerdt, D., & Pietsch, W. 2003, A&A, 401, 173 [NASA ADS] [CrossRef] [EDP Sciences] [Google Scholar]
- Trinchieri, G., Sulentic, J., Pietsch, W., & Breitschwerdt, D. 2005, A&A, 444, 697 [NASA ADS] [CrossRef] [EDP Sciences] [Google Scholar]
- Weingartner, J. C., & Draine, B. T. 2001a, ApJ, 548, 296 [NASA ADS] [CrossRef] [Google Scholar]
- Weingartner, J. C., & Draine, B. T. 2001b, ApJ, 563, 842 [Google Scholar]
- Weingartner, J. C., & Draine, B. T. 2001c, ApJS, 134, 263 [NASA ADS] [CrossRef] [MathSciNet] [Google Scholar]
- Williams, B. A., Yun, M. S., & Verdes-Montenegro, L. 2002, AJ, 123, 2417 [NASA ADS] [CrossRef] [Google Scholar]
- Xu, C., Sulentic, J. W., & Tuffs, R. 1999, ApJ, 512, 178 [NASA ADS] [CrossRef] [Google Scholar]
- Xu, C. K., Lu, N., Condon, J. J., Dopita, M., & Tuffs, R. J. 2003, ApJ, 595, 665 [NASA ADS] [CrossRef] [Google Scholar]
- Xu, C. K., Iglesias-Páramo, J., Burgarella, D., et al. 2005, ApJ, 619, L95 [NASA ADS] [CrossRef] [Google Scholar]
- Xu, C. K., Appleton, P. N., Dopita, M., et al. 2008, in Infrared Diagnostics of Galaxy Evolution, ed. R.-R. Chary, H. I. Teplitz, & K. Sheth, ASP Conf. Ser., 381, 88 [Google Scholar]
Footnotes
- ... guide
![[*]](/icons/foot_motif.png)
- http://galexgi.gsfc.nasa.gov/docs/galex/
- ... software
- http://astromatic.iap.fr/software/swarp
- ... units
- The flux of the Habing field (
 )
equals
)
equals  erg s-1 cm-2
at
erg s-1 cm-2
at  Å (Mathis
et al. 1983; Habing 1968).
Å (Mathis
et al. 1983; Habing 1968).
- ... ISOCAM-CVF
- Camera equipped with a Circular Variable Filter (CVF) on-board the Infrared Space Observatory (ISO).
- ... tool
- Available at http://tir.astro.utoledo.edu/jdsmith/pahfit.php.
- ...SINGS
- Spitzer Infrared Nearby Galaxies Survey, http://sings.stsci.edu/.
- ... PDR
- Photo-Dissociation Region.
- ... modifications
- In particular, the absorption cross-sections of the PAHs (with the addition of new aromatic infrared bands, AIBs) and the big grains (BGs), as well as the heat capacities (graphite, PAH C-H, silicate, and amorphous carbon) were updated.
- ... code
- http://cdsweb.u-strasbg.fr/ allen/mappings_page1.html
- ... flux
-
 W m-2 sr-1
from Xu et al. (2003).
W m-2 sr-1
from Xu et al. (2003).
- ... low
-
![$\mathcal{F}_{\rm [Ne~III]} / \mathcal{F}_{\rm [Ne~II]} = 0.14 \pm 0.04$](/articles/aa/full_html/2010/10/aa13430-09/img217.png) in
the center of the SQ ridge, see Table 3 in Cluver et al. (2010).
in
the center of the SQ ridge, see Table 3 in Cluver et al. (2010).
- ... MHD
- Magneto-hydrodynamic
- ... PACS
- Photodetector Array Camera and Spectrometer.
- ... SPIRE
- Spectral and Photometric Imaging Receiver.
All Tables
Table 1:
Summary of the mid-IR photometric measurements1
performed on the Spitzer IRAC, IRS PUI
![]() m, and MIPS
24, and
m, and MIPS
24, and ![]() m
images (Fig. 1).
m
images (Fig. 1).
Table 2: Summary of the UV photometric measurements performed on GALEX FUV and NUV images (see Fig. 1).
Table 3:
Optical HST V-band and
near-infrared WIRC surface brightnesses1
in the J, H, and ![]() bands for the SQ ridge.
bands for the SQ ridge.
Table 4: Fluxes of the PAH bands measured with the PAHFit IDL tool on the Spitzer IRS spectrum of the center of the SQ ridge and the ISO-CVF spectrum of the Galactic light.
Table 5: Flux ratios of the PAH bands for the Spitzer IRS spectrum at the center of the SQ ridge, and the ISO-CVF spectrum of the diffuse Galactic light.
All Figures
|
|
Figure 1:
UV and mid-IR observations of Stephan's Quintet. Top-left
is a near-UV (2 267 Å) GALEX
image from Xu et al. (2005),
top-right is the Spitzer IRS
|
| Open with DEXTER | |
| In the text | |
|
|
Figure 2:
The SED of the dust emission from the SQ shock seen by Spitzer
(Table 1),
compared to that of the Galactic diffuse emission observed with Spitzer
IRAC, IRAS, and DIRBE
towards the line-of-sight centered on the Galactic coordinates
(28.6, +0.8). The contribution of the gas lines is subtracted. The
Galactic SED is scaled down by a factor 200. Between |
| Open with DEXTER | |
| In the text | |
|
|
Figure 3:
Spitzer IRS mid-IR spectra extracted over a |
| Open with DEXTER | |
| In the text | |
|
|
Figure 4:
Spitzer IRS PAH emission spectrum extracted at
the center of the SQ ridge (black solid line), compared with
the ISOCAM-CVF spectrum of the diffuse galactic
medium (blue dashed line, with flux density labeled on the right). The IRS
spectrum is smoothed to a resolution
|
| Open with DEXTER | |
| In the text | |
|
|
Figure 5:
The 2-component SED of the radiation field (stellar + shock) used as
input for dust models to calculate the dust emission from molecular
gas. The radiation field is the sum of an ISRF of intensity
|
| Open with DEXTER | |
| In the text | |
|
|
Figure 6: Sketch of the two limiting physical states of the multiphase molecular gas we consider in the framework of our modeling of dust emission. (Left) Dust is associated with diffuse molecular gas that is broken into fragments, filaments, or sheets, penetrated by UV radiation. (Right) The dusty molecular gas is in clouds that are optically thick to UV light. |
| Open with DEXTER | |
| In the text | |
|
|
Figure 7:
SED of the dust emission associated with diffuse (top)
or clumpy (bottom) molecular gas. The cloud is
exposed to a radiation field consisting of a mixture (stellar + shock)
of the Mathis et al. (1977)
ISRF (scaled by a factor |
| Open with DEXTER | |
| In the text | |
|
|
Figure 8:
Comparison between the two models presented in this paper: diffuse
(dashed blue line, same model as Fig. 7) and
clumpy (black line, same model as Fig. 7)
molecular gas. The overlaid points indicate the Spitzer
fluxes extracted within the shock region (see bottom right inset). The
gas lines are removed from these spectra, as well as the IR component
of the incident ISRF (
|
| Open with DEXTER | |
| In the text | |
|
|
Figure 9:
Predicted |
| Open with DEXTER | |
| In the text | |
|
|
Figure A.1:
Result of a PAHFit model fit on the
|
| Open with DEXTER | |
| In the text | |
|
|
Figure A.2: PAHFit decomposition of the Spitzer IRS dust spectrum (smoothed over 5 resolution elements, and from which gas lines have been removed) extracted from the center of the SQ ridge. Blue solid lines shows the Lorentzian components of the PAH decomposition, and the thick gray line is the total (dust + starlight) continuum. The result of the fit is the green solid line. |
| Open with DEXTER | |
| In the text | |
|
|
Figure A.3: PAHFit decomposition of the ISO-CVF spectrum of the diffuse Galactic light (Flagey et al. 2006), centered on the Galactic coordinates (26.8, +0.8). The gas lines have been removed from the spectrum. The Lorentzian components of the decomposition of the PAH features are shown in blue. All components are diminished by the extinction, indicated by the dotted black line, with axis at right. The solid green line is the full fitted model, plotted on the observed flux intensities and uncertainties. |
| Open with DEXTER | |
| In the text | |
Copyright ESO 2010
Current usage metrics show cumulative count of Article Views (full-text article views including HTML views, PDF and ePub downloads, according to the available data) and Abstracts Views on Vision4Press platform.
Data correspond to usage on the plateform after 2015. The current usage metrics is available 48-96 hours after online publication and is updated daily on week days.
Initial download of the metrics may take a while.