| Issue |
A&A
Volume 517, July 2010
|
|
|---|---|---|
| Article Number | A24 | |
| Number of page(s) | 29 | |
| Section | Stellar structure and evolution | |
| DOI | https://doi.org/10.1051/0004-6361/201014477 | |
| Published online | 28 July 2010 | |
Properties and nature of Be stars![[*]](/icons/foot_motif.png) ,
,
28. Implications of systematic observations for the nature of the multiple system with the Be star o Cassiopeæ and its circumstellar environment
P. Koubský1 - C. A. Hummel2 - P. Harmanec3 - C. Tycner4 - F. van Leeuwen5 - S. Yang6 - M. Slechta1 - H. Bozic7 - R. T. Zavala8 - D. Ruzdjak7 - D. Sudar7
1 - Astronomical Institute, Academy of Sciences of the Czech Republic,
251 65 Ondrejov, Czech Republic
2
- European Organisation for Astronomical Research in the Southern
Hemisphere, Karl-Schwarzschild-Str. 2, 85748 Garching bei München,
Germany
3 - Astronomical Institute of the Charles University, Faculty of
Mathematics and Physics, V Holesovickách 2, 180 00
Praha 8 - Troja, Czech Republic
4 -
Department of Physics, Central Michigan University, Mount Pleasant, MI 48859, USA
5 -
Institute of Astronomy, Madingley Road, Cambridge, UK
6 -
University of Victoria, Dept of Physics and Astronomy, PO Box 3055 Victoria, BC V8W 3P6, Canada
7 -
Hvar Observatory, Faculty of Geodesy, Zagreb University, Kaciceva 26, 10000 Zagreb, Croatia
8 -
US Naval Observatory, Flagstaff Station, 10391 West Naval Observatory Road, Flagstaff, AZ 86001, USA
Received 22 March 2010 / Accepted 19 April 2010
Abstract
The analysis of radial velocities of the Be star o Cas from
spectra taken between 1992 and 2008 at the Ondrejov Observatory and the Dominion
Astrophysical Observatory allowed us to reconfirm the binary nature of
this object, first suggested by Abt and Levy in 1978, but later refuted
by several authors. The orbital parameters of this SB1 system imply
a very high mass function of about one solar mass. This in turn leads
to a very high mass of the secondary, possibly higher than that of the
primary. In order to look for such a massive secondary,
o Cas was observed with the Navy Prototype Optical Interferometer,
which allowed the binary components to be spatially resolved for the
first time. The interferometric observations lead to the detection of a
secondary, about 3 mag fainter than the primary. The possible properties
of this peculiar binary system and the reasons why the massive secondary
does not dominate the optical spectrum are discussed.
Key words: binaries: close -
binaries: spectroscopic -
stars: emission-line, Be -
stars: fundamental parameters -
stars: individual: o Cas
1 Introduction
o Cas (HD 4180, HR 193, BD+47![]() 183, HIP 3504) is a bright Be star
(V=4
183, HIP 3504) is a bright Be star
(V=4
![]() 3-4
3-4
![]() 6 var., B5III-IVe, v sin i = 220 km s-1). It is also the
brighter component of the wide double system WDS 00447+4817 (Mason,
Wycoff & Hartkopf, http://ad.usno.navy.mil/wds). This system
exhibits little or no orbital motion over the time interval of available
observations (separation 32
6 var., B5III-IVe, v sin i = 220 km s-1). It is also the
brighter component of the wide double system WDS 00447+4817 (Mason,
Wycoff & Hartkopf, http://ad.usno.navy.mil/wds). This system
exhibits little or no orbital motion over the time interval of available
observations (separation 32
![]() 8-33
8-33
![]() 8), and the fainter component
is an 11-mag. star. Spectral variability of o Cas was reported by several
authors. A good summary of the historical records of H
8), and the fainter component
is an 11-mag. star. Spectral variability of o Cas was reported by several
authors. A good summary of the historical records of H![]() profile changes
can be found in Peton (1972). The H
profile changes
can be found in Peton (1972). The H![]() emission apparently persisted from
the early 1930's to the early 1950's. Hubert-Delplace & Hubert (1979) stated that o Cas was without
emission from 1953 to 1959. Between December 1975 and November 1976,
another emission episode started and continued through the early 1980's
(Andrillat & Fehrenbach 1982; Slettebak & Reynolds 1978). In December 1982 the H
emission apparently persisted from
the early 1930's to the early 1950's. Hubert-Delplace & Hubert (1979) stated that o Cas was without
emission from 1953 to 1959. Between December 1975 and November 1976,
another emission episode started and continued through the early 1980's
(Andrillat & Fehrenbach 1982; Slettebak & Reynolds 1978). In December 1982 the H![]() emission
reached an intensity of 2.0 relative to the continuum (Barker 1983).
The Ondrejov spectra, taken since 1992, have shown relatively strong
emission in H
emission
reached an intensity of 2.0 relative to the continuum (Barker 1983).
The Ondrejov spectra, taken since 1992, have shown relatively strong
emission in H![]() (4.0 to 6.5 times the continuum intensity). This
is in accordance with Christian Buil's The spectroscopic Be-stars
Atlas
(4.0 to 6.5 times the continuum intensity). This
is in accordance with Christian Buil's The spectroscopic Be-stars
Atlas![]() . Photometric
variability of o Cas was first reported by Haupt & Schroll (1974). Pavlovski et al. (1997)
summarized the observations of o Cas at Hvar from about HJD 2 445 000
to 2 447 900. Hubert & Floquet (1998) investigated variability of bright Be stars using Hipparcos photometry. For o Cas they detected a long-term
monotonic decline of 0
. Photometric
variability of o Cas was first reported by Haupt & Schroll (1974). Pavlovski et al. (1997)
summarized the observations of o Cas at Hvar from about HJD 2 445 000
to 2 447 900. Hubert & Floquet (1998) investigated variability of bright Be stars using Hipparcos photometry. For o Cas they detected a long-term
monotonic decline of 0
![]() 06 between HJD 2 447 800 and 2 449 200. When this
trend was subtracted, a short-term variability with a period of 1
06 between HJD 2 447 800 and 2 449 200. When this
trend was subtracted, a short-term variability with a period of 1
![]() 257
and semi-amplitude 0
257
and semi-amplitude 0
![]() 01 was clearly visible.
01 was clearly visible.
Analyzing He I absorption radial velocities (RVs hereafter) from
20 photographic spectra, Abt & Levy (1978) (AL) proposed that o Cas is
a single-line spectroscopic binary with an orbital period of 1033 days
and an insignificant eccentricity (
![]() ).
Their finding was confirmed by Elias et al. (1978). However, Horn et al. (1985)
re-analyzed AL's RVs together with a series of high-dispersion
photographic spectra secured on two consecutive nights at Rozhen and
concluded that they can be better reconciled with a short period of
1
).
Their finding was confirmed by Elias et al. (1978). However, Horn et al. (1985)
re-analyzed AL's RVs together with a series of high-dispersion
photographic spectra secured on two consecutive nights at Rozhen and
concluded that they can be better reconciled with a short period of
1
![]() 1679, probably identical to the photometric period.
Harmanec (1987) collected all available RVs from several sources and
showed that they could be folded with various periods and suggested that
the star should not be considered a spectroscopic binary. He suspected
that the RV curve derived by AL was a manifestation of long-term
variations known for a number of other Be stars. Koubský et al. (2004) secured
a new series of electronic spectra of o Cas with a good S/N. Measuring
RVs of the steep wings of the H
1679, probably identical to the photometric period.
Harmanec (1987) collected all available RVs from several sources and
showed that they could be folded with various periods and suggested that
the star should not be considered a spectroscopic binary. He suspected
that the RV curve derived by AL was a manifestation of long-term
variations known for a number of other Be stars. Koubský et al. (2004) secured
a new series of electronic spectra of o Cas with a good S/N. Measuring
RVs of the steep wings of the H![]() emission, they demonstrated that the
RV variations are strictly periodic and therefore almost certainly due
to orbital motion. They found P=1031 d and e=0. However, they were unable
to explain why the lines of the secondary, probably more massive than
the primary (as implied by the high mass function of 0.867
emission, they demonstrated that the
RV variations are strictly periodic and therefore almost certainly due
to orbital motion. They found P=1031 d and e=0. However, they were unable
to explain why the lines of the secondary, probably more massive than
the primary (as implied by the high mass function of 0.867 ![]() ), were
unobservable. Jancart et al. (2005) analyzed the Hipparcos astrometric data
and concluded that o Cas is undoubtedly an astrometric binary.
Adopting the AL elliptical-orbit solution, they derived the
astrometric orbit with a semi-major axis of 0
), were
unobservable. Jancart et al. (2005) analyzed the Hipparcos astrometric data
and concluded that o Cas is undoubtedly an astrometric binary.
Adopting the AL elliptical-orbit solution, they derived the
astrometric orbit with a semi-major axis of 0
![]() 0074
0074 ![]() 0
0
![]() 0013
and inclination 107
0013
and inclination 107
![]() 2
2 ![]() 4
4
![]() 3.
3.
2 Observations and reductions
2.1 Spectroscopy
The star was observed in Ondrejov
and later also at the Dominion Astrophysical Observatory (DAO hereafter).
Altogether, we secured and reduced 442 usable electronic spectra
covering the red spectral region around the H![]() and He I 6678 lines.
We measured RVs on the steep wings of the H
and He I 6678 lines.
We measured RVs on the steep wings of the H![]() emission line
and also on the outer wings of the He I 6678 absorption line. We
measured the peak intensity of the H
emission line
and also on the outer wings of the He I 6678 absorption line. We
measured the peak intensity of the H![]() emission to characterize
the long-term changes of the envelope.
Additionally, we compiled and analyzed several sets of RVs
published by various authors as well as all available records of the
peak intensity of the H
emission to characterize
the long-term changes of the envelope.
Additionally, we compiled and analyzed several sets of RVs
published by various authors as well as all available records of the
peak intensity of the H![]() emission.
A journal of all RV observations is given in Table 1.
emission.
A journal of all RV observations is given in Table 1.
Table 1: Journal of RV data sets.
Details on data reduction and on RV and peak-intensity measurements
can be found in Appendix A. In the same Appendix, readers
can also find Table A.1 with HJDs and individual RVs compiled
from the literature, Table A.2 with records of
the peak intensity of the H![]() emission compiled from the literature and
public databases of the Be-star spectra, and
Table A.3 with all H
emission compiled from the literature and
public databases of the Be-star spectra, and
Table A.3 with all H![]() emission and He I 6678 absorption
RVs and the H
emission and He I 6678 absorption
RVs and the H![]() peak intensities measured in the electronic spectra.
peak intensities measured in the electronic spectra.
2.2 Photometry
![]() :
photometry has been carried out at Hvar
since 1982. The measurements were carefully transformed to the standard Johnson
:
photometry has been carried out at Hvar
since 1982. The measurements were carefully transformed to the standard Johnson ![]() system via non-linear tranformation formulæ using
the program HEC22 (Harmanec & Horn 1998; Harmanec et al. 1994).
We also used the Hipparcos
system via non-linear tranformation formulæ using
the program HEC22 (Harmanec & Horn 1998; Harmanec et al. 1994).
We also used the Hipparcos ![]() broadband all-sky observations.
To be able to combine them with the Hvar observations, we transformed
them to the Johnson V magnitudes following Harmanec (1998).
Additionally, we compiled all photometric observations from the
literature which either were on or could be transformed to the Johnson
broadband all-sky observations.
To be able to combine them with the Hvar observations, we transformed
them to the Johnson V magnitudes following Harmanec (1998).
Additionally, we compiled all photometric observations from the
literature which either were on or could be transformed to the Johnson
![]() system. Basic information on available data sets with known
times of observations can be found
in Table 2.
system. Basic information on available data sets with known
times of observations can be found
in Table 2.
Table 2: Journal of the photoelectric measurements with known times of observations.
We also compiled all-sky ![]() observations without known times of
observations, which are summarized in Table 3.
observations without known times of
observations, which are summarized in Table 3.
Table 3:
Published all-sky ![]() observations with unknown epoch.
observations with unknown epoch.
Details on photometric data sets and their reductions and transformations can be found in Appendix B.
2.3 Interferometry
The star was observed with the Navy Prototype Optical Interferometer
(NPOI) located near Flagstaff, Arizona, during three successive
observing seasons in 2005, 2006, and 2007. The NPOI was described by
Armstrong et al. (1998) and measures interference fringe amplitudes and
closure phases in 16 spectral channels between 550 nm and 850 nm, on
baselines up to 64 m in length on the ground (for the observations reported
here). The width of the channels ranges from 3% to 2% of the central
wavelength from the red to the blue end of the spectrometer. The closure
phase, corresponding to the sum of the visibility phase measured for each
baseline in a triangle, is free of atmospheric phase fluctuations. The
observations of o Cas were interleaved with a calibrator star, taken
from a list maintained at NPOI. The calibrators, together with the
values adopted for their uniform disk diameters at 800 nm (estimated
uncertainty of 3%) and the predicted squared visibility at 800 nm on
a 60 m baseline were ![]() And (0.37 mas, V2=0.96),
And (0.37 mas, V2=0.96), ![]() And
(0.69 mas, V2=0.85), and
And
(0.69 mas, V2=0.85), and ![]() Cas (0.26 mas, V2=0.98). Diameters
at other wavelengths were computed based on the appropriate amount of
limb darkening. Dates of observation and other relevant information
as well as astrometric fitting results discussed further below are
listed in Table 4. The total uv-coverage achieved is shown
in Fig. 1.
Cas (0.26 mas, V2=0.98). Diameters
at other wavelengths were computed based on the appropriate amount of
limb darkening. Dates of observation and other relevant information
as well as astrometric fitting results discussed further below are
listed in Table 4. The total uv-coverage achieved is shown
in Fig. 1.
Table 4: NPOI observations and model fit results.
The reduction of the NPOI data followed the procedures described by Hummel et al. (1998), with the only difference that incoherent flux measurements (obtained by offsetting the optical delay lines) were done for each stellar fringe measurement in order to derive more precise estimates of the visibility amplitude bias due to non-Poisson detector statistics. The calibrator visibility measurements were smoothed in time with a Gaussian kernel of 80 min in length to interpolate values at the epochs of the o Cas measurements. While the amplitudes of o Cas were thus calibrated by division, closure phases were calibrated by subtraction of the interpolated calibrator phases. We computed calibration uncertainties by the scatter of the calibrator measurements around the smoothed values, and they ranged from 5% to 20% for the amplitudes from the red to the blue end of the spectrometer, while they were typically around one or two degrees for the closure phases. Instead of applying the calibration error to the formal visibility errors, we allowed the mean level of the amplitude on individual baselines to float up or down a few percent to improve the fits (described below). This procedure is based on the observation that channel-to-channel variations of the visibility amplitude are not affected by a calibration error and therefore must be preserved, as they contain calibration independent visibility information.
The image of o Cas shown in Fig. 2 was obtained with standard interferometric phase self-calibration techniques, and shows for the first time the companion. As an example of the calibrated visibilities we obtained, Fig. 3 shows data from 2007 Aug. 9.
![\begin{figure}
\par\includegraphics[width=8cm,clip]{14477-f1.ps}
\end{figure}](/articles/aa/full_html/2010/09/aa14477-10/img29.png)
|
Figure 1: uv-coverage achieved from the combined NPOI observations. |
| Open with DEXTER | |
![\begin{figure}
\par\includegraphics[width=9cm,clip]{14477-f2.eps}
\end{figure}](/articles/aa/full_html/2010/09/aa14477-10/img30.png)
|
Figure 2: Image of Omicron Cassiopeiae from the NPOI data of 2005 Sep. 15. Equidistant (logarithmically) contours start at 1.02% and end at 65.3%, the dashed contour denotes a level of -1.02%. The restoring beam size is shown in the lower left corner. |
| Open with DEXTER | |
![\begin{figure}
\par\includegraphics[width=9cm,clip]{14477-f3.ps}
\end{figure}](/articles/aa/full_html/2010/09/aa14477-10/img31.png)
|
Figure 3:
Calibrated (squared) visibility amplitudes plotted versus
wavelength for 2007 Aug. 9, on the AE-AN baseline at 10:18, 10:49, 11:17,
and 11:53 UT. The solid line shows the model prediction for a fit with
component separation |
| Open with DEXTER | |
3 Spectroscopic and interferometric-orbit solutions
3.1 Radial velocities
Similarly as for some other Be stars, we measured the radial velocity
on the steep wings of the H![]() emission line comparing the
direct and flipped line profiles in the program SPEFO (Horn et al. 1996; Skoda 1996).
Because the H
emission line comparing the
direct and flipped line profiles in the program SPEFO (Horn et al. 1996; Skoda 1996).
Because the H![]() emission of o Cas during the time
interval covered by our spectra reached
peak intensities four to six times higher than the continuum level,
these measurements are very accurate.
emission of o Cas during the time
interval covered by our spectra reached
peak intensities four to six times higher than the continuum level,
these measurements are very accurate.
Figure 4 shows a plot of these emission RVs vs. time.
One can see a clear periodic pattern of variations but there is also a
hint of mild long-term changes. This was
confirmed by trial phase plots for the known 1030-d period. Such
long-term variations are also known for some other Be stars which were
found to be spectroscopic binaries: ![]() Cas (Harmanec et al. 2000; Harmanec 2002)
may serve as a good example. To cope with this problem, we divided
the RVs into five time intervals, each covering not more than about
1000 days, and allowed the program FOTEL for the orbital solution
(Hadrava 2004,1990) to derive individual mean (systemic) velocities
for these subsets. This led to a very good fit (adopting a value of
zero for the eccentricity) given as solution 1
in Table 5. The corresponding orbital RV curve is shown
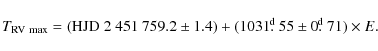
in Fig. 5 and the ephemeris for the 1032-d period reads:
Cas (Harmanec et al. 2000; Harmanec 2002)
may serve as a good example. To cope with this problem, we divided
the RVs into five time intervals, each covering not more than about
1000 days, and allowed the program FOTEL for the orbital solution
(Hadrava 2004,1990) to derive individual mean (systemic) velocities
for these subsets. This led to a very good fit (adopting a value of
zero for the eccentricity) given as solution 1
in Table 5. The corresponding orbital RV curve is shown
in Fig. 5 and the ephemeris for the 1032-d period reads:
Just to demonstrate how accurate our RV measurements of the H
![\begin{figure}
\par\includegraphics[width=9cm,clip]{14477-f4.eps}
\end{figure}](/articles/aa/full_html/2010/09/aa14477-10/img34.png)
|
Figure 4:
RVs measured on the steep wings of the H |
| Open with DEXTER | |
![\begin{figure}
\par\includegraphics[width=9cm,clip]{14477-f5.eps}\par\includegraphics[width=9cm,clip]{14477-f5b.eps}
\end{figure}](/articles/aa/full_html/2010/09/aa14477-10/img36.png)
|
Figure 5:
Phase diagram for the 1031-d period as defined by ephemeris (1). The RVs in the upper panel were measured on the steep
wings of the H |
| Open with DEXTER | |
Table 5: The (circular) orbital solutions based on the 1031-d period.
![\begin{figure}
\par\includegraphics[width=9cm,clip]{14477-f6.eps}
\end{figure}](/articles/aa/full_html/2010/09/aa14477-10/img38.png)
|
Figure 6:
Phase diagram for the 1
|
| Open with DEXTER | |
![\begin{figure}
\par\includegraphics[width=9cm,clip]{14477-f7.eps}
\end{figure}](/articles/aa/full_html/2010/09/aa14477-10/img39.png)
|
Figure 7:
Phase diagram for the old RVs from the literature for
the the orbital solution for the H |
| Open with DEXTER | |
As seen in the bottom panel of Fig. 5, the RVs of the presumably
photospheric He I 6678 line exhibit much larger scatter than that of the H![]() emission
wings, clearly due to strong line-profile variations. It is encouraging,
however, that the orbital solution for the He I 6678 RVs does not contradict
that from the more accurate emission RVs.
emission
wings, clearly due to strong line-profile variations. It is encouraging,
however, that the orbital solution for the He I 6678 RVs does not contradict
that from the more accurate emission RVs.
We also computed several orbital solutions in which we tried to combine
our new H![]() emission line RVs with RVs published in the literature -
see Table A.1 - to see if we could improve the value
of the orbital period. Regrettably, the lower accuracy and heterogeneity
of the published RVs did not allow that. Therefore, we show in
Fig. 7 only a phase diagram for our preferred period of 1031
emission line RVs with RVs published in the literature -
see Table A.1 - to see if we could improve the value
of the orbital period. Regrettably, the lower accuracy and heterogeneity
of the published RVs did not allow that. Therefore, we show in
Fig. 7 only a phase diagram for our preferred period of 1031
![]() 55 for
all RVs from the literature to demonstrate that these older observations
are also in phase with our more recent RV data.
Considering the above arguments, our subsequent analysis of binary masses
will be based on the orbital solution 1.
55 for
all RVs from the literature to demonstrate that these older observations
are also in phase with our more recent RV data.
Considering the above arguments, our subsequent analysis of binary masses
will be based on the orbital solution 1.
Table 6:
A sinusoidal fit for the 1.2578-d period in the H![]() emission RV O-C residuals.
emission RV O-C residuals.
3.2 Interferometric orbit and the basic physical properties of the system
As shown in Fig. 3, both the relative position of the binary
components as well as their magnitude difference can be extracted from
the data collected in each night. The astrometric results are reported in
Table 4 and were used to fit the inclination i of the orbit,
the angle of the ascending node ![]() ,
and the semimajor axis a,
adopting the remaining elements from the spectroscopic orbit. This orbit
is shown in Fig. 8. The results were finally confirmed by
fitting all component parameters, including their masses, and orbital
elements to the interferometric data (reduced
,
and the semimajor axis a,
adopting the remaining elements from the spectroscopic orbit. This orbit
is shown in Fig. 8. The results were finally confirmed by
fitting all component parameters, including their masses, and orbital
elements to the interferometric data (reduced
![]() )
and the radial velocities (reduced
)
and the radial velocities (reduced
![]() adopting 1 km s-1 for the uncertainty of a measurement) using procedures described
in Hummel et al. (1998). If one adopts the original Hipparcos parallax
of 0
adopting 1 km s-1 for the uncertainty of a measurement) using procedures described
in Hummel et al. (1998). If one adopts the original Hipparcos parallax
of 0
![]() 00360
00360 ![]() 0
0
![]() 00084 (Perryman & ESA 1997), it is also possible to
estimate the individual masses, giving
00084 (Perryman & ESA 1997), it is also possible to
estimate the individual masses, giving
![]()
![]() and
and
![]()
![]() ,
but the uncertainties due to the error of the parallax
are rather large. van Leeuwen (2007a) reanalyzed the Hipparcos data and
obtained a parallax of 0
,
but the uncertainties due to the error of the parallax
are rather large. van Leeuwen (2007a) reanalyzed the Hipparcos data and
obtained a parallax of 0
![]() 00464
00464 ![]() 0
0
![]() 00038 (van Leeuwen 2007b).
This would imply much lower masses of
00038 (van Leeuwen 2007b).
This would imply much lower masses of
![]()
![]() and
and
![]()
![]() for primary and secondary components,
respectively. Despite the uncertainties in these values, the conclusion
of Koubský et al. (2004) that the companion must have a mass comparable to,
or even higher than the much brighter Be primary, remains unaltered.
for primary and secondary components,
respectively. Despite the uncertainties in these values, the conclusion
of Koubský et al. (2004) that the companion must have a mass comparable to,
or even higher than the much brighter Be primary, remains unaltered.
![\begin{figure}
\par\includegraphics[width=7cm,clip]{14477-f8.ps}
\end{figure}](/articles/aa/full_html/2010/09/aa14477-10/img47.png)
|
Figure 8: Apparent orbit of o Cas from interferometry and spectroscopy. The size of the uncertainty ellipses are set to one-fifth of the synthesized beam widths. |
| Open with DEXTER | |
Table 7: Orbital elements from combined fits.
Both determinations of the parallax from the Hipparcos data accounted
for the motion of the binary, and resulted in values of the semimajor
axis of the orbit of the photo center, a0, as well as the inclination
and angle of the line of nodes when the remaining elements were adopted
from the spectroscopic orbit. While Jancart et al. (2005) published a
value of
![]() mas, we repeated this analysis based on the
new Hipparcos reduction by van Leeuwen (2007b) and our new spectroscopic
orbit, and confirmed a nearly circular orbit with
mas, we repeated this analysis based on the
new Hipparcos reduction by van Leeuwen (2007b) and our new spectroscopic
orbit, and confirmed a nearly circular orbit with
![]() ,
,
![]() ,
and
,
and
![]() .
These results provide an
additional constraint as they can be computed from the component mass
ratio and magnitude difference and from the semimajor axis of the orbit.
.
These results provide an
additional constraint as they can be computed from the component mass
ratio and magnitude difference and from the semimajor axis of the orbit.
Therefore we determined with Kepler's third law and the measured mass function,
that a parallax of
![]() mas would yield values
for a0 consistent with Jancart et al. (2005) and our own analysis. In
addition, only in this range would the stellar classes of the primary
corresponding to the determined mass (
mas would yield values
for a0 consistent with Jancart et al. (2005) and our own analysis. In
addition, only in this range would the stellar classes of the primary
corresponding to the determined mass (
![]()
![]() )
and
absolute magnitude (MV=-2
)
and
absolute magnitude (MV=-2
![]() 6) match. The secondary, however, is always
too massive for being almost 3 mag fainter than the primary.
A possible solution to this problem will be discussed later in this paper.
6) match. The secondary, however, is always
too massive for being almost 3 mag fainter than the primary.
A possible solution to this problem will be discussed later in this paper.
Because both giant B5 and dwarf B3 stars have masses consistent with our
results, we adopted the following approach. Because the visual companion
was found to be 2
![]() 9 fainter than the Be primary, one can use the
9 fainter than the Be primary, one can use the ![]() magnitudes from the time interval when the star was without emission V= 4
magnitudes from the time interval when the star was without emission V= 4
![]() 61, B-V = -0
61, B-V = -0
![]() 075, U-B = -0
075, U-B = -0
![]() 525 (see Table B.2)
to obtain dereddened values V0 = 4
525 (see Table B.2)
to obtain dereddened values V0 = 4
![]() 35, (B-V)0 = -0
35, (B-V)0 = -0
![]() 156, and
(U-B)0 =-0
156, and
(U-B)0 =-0
![]() 584. These values corresponds well to a B5 star and
to an effective temperature of 14 000 K according to the calibration by
Flower (1996). From the magnitude difference of 2
584. These values corresponds well to a B5 star and
to an effective temperature of 14 000 K according to the calibration by
Flower (1996). From the magnitude difference of 2
![]() 9, one obtains
the dereddened visual magnitude of the primary V01 = 4
9, one obtains
the dereddened visual magnitude of the primary V01 = 4
![]() 42. Adopting
log
42. Adopting
log
![]() and B.C. = -1
and B.C. = -1
![]() 05 after Flower (1996)
and the parallax of
05 after Flower (1996)
and the parallax of
![]() ,
one arrives at MV=-2
,
one arrives at MV=-2
![]() 55 and R= 8.0
55 and R= 8.0 ![]() ,
which agrees well with the spectral classification B5III.
,
which agrees well with the spectral classification B5III.
4 Circumstellar disk
4.1 Interferometric signature
The dip in the visibility amplitudes at 660 nm (see Fig. 3)
is caused by the extended H![]() emission around the primary.
To visualize this effect for all data from the NPOI channel centered on
the H
emission around the primary.
To visualize this effect for all data from the NPOI channel centered on
the H![]() line we divided the observed visibility amplitudes by the
those predicted with the binary model, which left a single unresolved
component and the envelope. (This is an approximation, but because the
closure phases are never larger than about 10 degrees and the secondary
is almost 3 mag fainter than the primary, it is a good one.)
The resulting amplitudes as a function of uv-radius are shown in
Fig. 10.
line we divided the observed visibility amplitudes by the
those predicted with the binary model, which left a single unresolved
component and the envelope. (This is an approximation, but because the
closure phases are never larger than about 10 degrees and the secondary
is almost 3 mag fainter than the primary, it is a good one.)
The resulting amplitudes as a function of uv-radius are shown in
Fig. 10.
![\begin{figure}
\par\includegraphics[width=8.5cm,clip]{14477-f9.eps}
\end{figure}](/articles/aa/full_html/2010/09/aa14477-10/img59.png)
|
Figure 9:
H |
| Open with DEXTER | |
In order to determine the size of this envelope and any apparent
flattening, we used the H![]() line profile (Fig. 9)
to estimate the fraction of H
line profile (Fig. 9)
to estimate the fraction of H![]() emission relative to the continuum
in the NPOI spectral channel centered on the line. The line profile was
measured with a fiber-fed echelle spectrograph connected to the John
S. Hall 1.1-m telescope at the Lowell Observatory. The spectra in the
H
emission relative to the continuum
in the NPOI spectral channel centered on the line. The line profile was
measured with a fiber-fed echelle spectrograph connected to the John
S. Hall 1.1-m telescope at the Lowell Observatory. The spectra in the
H![]() line region were reduced using standard reduction routines
developed by Hall et al. (1994) and had a spectral resolving
power of 10 000. The equivalent width of the line was measured to
be 3.3 nm, or 22% of the width of the NPOI channel containing the
line. To correct for the effect of the H
line region were reduced using standard reduction routines
developed by Hall et al. (1994) and had a spectral resolving
power of 10 000. The equivalent width of the line was measured to
be 3.3 nm, or 22% of the width of the NPOI channel containing the
line. To correct for the effect of the H![]() absorption of the star
itself, we estimated an equivalent width of about 0.26 nm, or 1.7% of
the NPOI channel based on a stellar atmosphere model with T=14 000 K
and
absorption of the star
itself, we estimated an equivalent width of about 0.26 nm, or 1.7% of
the NPOI channel based on a stellar atmosphere model with T=14 000 K
and
![]() .
Therefore the total emission of the disk will
be slightly larger, i.e. about 3.6 nm, or 24% of the NPOI channel.
It would be possible, as demonstrated by Tycner et al. (2006),
to disentangle the fractional flux contributed by the line to the total
flux measured in the channel from the diameter with better data on longer
baselines, where the amplitudes should reach asymptotically a value of
(1/1.24)2=65% based on our results.
.
Therefore the total emission of the disk will
be slightly larger, i.e. about 3.6 nm, or 24% of the NPOI channel.
It would be possible, as demonstrated by Tycner et al. (2006),
to disentangle the fractional flux contributed by the line to the total
flux measured in the channel from the diameter with better data on longer
baselines, where the amplitudes should reach asymptotically a value of
(1/1.24)2=65% based on our results.
Following Tycner et al. (2008,2006), we adopt
a circular Gaussian component representing the disk emission and fit
a diameter of 1.9 ![]() 0.1 mas to (non-divided) the H
0.1 mas to (non-divided) the H![]() data
using the complete model including the binary. The reduced
data
using the complete model including the binary. The reduced
![]() of the
fit indicates that substructure exists within the disk that is not
fitted by a circular Gaussian component. If we allow an elongation of
the component, an axial ratio of 0.6 with the major axis of an ellipse
oriented roughly in a north-south direction allows us to improve the fit to
of the
fit indicates that substructure exists within the disk that is not
fitted by a circular Gaussian component. If we allow an elongation of
the component, an axial ratio of 0.6 with the major axis of an ellipse
oriented roughly in a north-south direction allows us to improve the fit to
![]() .
However, at this position angle, the axial ratio
is only weakly constrained due to the lack of long baselines in east-west
direction (see Fig. 1). If we assumed instead a position angle of
90 degrees, our data would not allow an axial ratio of less than about
0.8 (
.
However, at this position angle, the axial ratio
is only weakly constrained due to the lack of long baselines in east-west
direction (see Fig. 1). If we assumed instead a position angle of
90 degrees, our data would not allow an axial ratio of less than about
0.8 (
![]() ), corresponding to an inclination of the disk
normal to the line of sight of not more than 36 degrees assuming the
disk has a narrow opening angle and is itself circular.
), corresponding to an inclination of the disk
normal to the line of sight of not more than 36 degrees assuming the
disk has a narrow opening angle and is itself circular.
The quality of our H![]() data due to the limits imposed by the
uv-coverage and the dilution of the emission with the stellar continuum
given the width of the NPOI channel does not allow further conclusions
except to say that a nearly face-on disk is consistent with our data.
At the same time, a disk aligned with the orbital plane is inconsistent
with our observations, unless a very wide disk opening angle is assumed.
data due to the limits imposed by the
uv-coverage and the dilution of the emission with the stellar continuum
given the width of the NPOI channel does not allow further conclusions
except to say that a nearly face-on disk is consistent with our data.
At the same time, a disk aligned with the orbital plane is inconsistent
with our observations, unless a very wide disk opening angle is assumed.
![\begin{figure}
\par\includegraphics[width=8cm,clip]{14477-f10.ps}
\end{figure}](/articles/aa/full_html/2010/09/aa14477-10/img65.png)
|
Figure 10:
Observed visibility amplitudes (H |
| Open with DEXTER | |
4.2 Correlated spectroscopic and photometric signatures
As pointed out already by Harmanec (1983), Be stars usually vary on three distinct time scales: long-term (years to decades), medium (weeks to months), and rapid (less than about two days). The variations on the two shorter time scales are often periodic, related to the binary nature and to the stellar rotation and/or pulsations, respectively. Because all these periods may be present in a particular star, it is necessary to obtain a very dense and complete observational coverage to be able to remove the non-periodic long-term changes and to search for periodic components of the variations.
o Cas is an example of a Be star with pronounced changes on all these
timescales. In Fig. 11 we show a plot of several observed
quantities as a function of time: individual photometric observations
of the Johnson V magnitude and
B-V and U-B indices, and the peak intensity of the H![]() emission line.
This diagram covers the time interval for which photoelectric observations
are available. The color-color diagram for all individual observations
for the same time interval is shown in Fig. 12.
It is obvious that the mutual correlation between the emission strength,
brightness and colors is rather complicated and obviously governed by at
least two different processes.
emission line.
This diagram covers the time interval for which photoelectric observations
are available. The color-color diagram for all individual observations
for the same time interval is shown in Fig. 12.
It is obvious that the mutual correlation between the emission strength,
brightness and colors is rather complicated and obviously governed by at
least two different processes.
- 1.
- The formation of each new emission-line episode (like the one which occurred around JD 2 439 000) is indicative of the positive correlation between the brightness of the object and the emission strength (Harmanec 2000,1983). In the color-color diagram the object moves from the main sequence towards supergiants. According to Harmanec (1983) this indicates that the inner, optically thick parts of the disk simulate a stellar photosphere which increases its radius. If such a pseudophotosphere is seen not just equator-on but under some smaller angle, it mimics an increase of the luminosity class of the star in the U-B vs. B-V diagram, which is indeed observed.
- 2.
- In the time interval between about JD 2 447 000 and 51 000, the
increase of the emission strength continues but the brightness of
the object started to decrease again. This is not a mere effect of the
change of the emission (ratio
 1.7) due to the continuum change
(ratio 1.15). This can be qualitatively interpreted as a gradual
rarification of the envelope, which becomes more extended but optically
thin in continuum, which means that the radius of the pseudophotosphere
is decreasing again. A remarkable variation occurs around JD 2 452 000
when the brightness rises again while at the same time both color
indices drop sharply (the object gets redder) and the emission strength also
decreases temporarily.
1.7) due to the continuum change
(ratio 1.15). This can be qualitatively interpreted as a gradual
rarification of the envelope, which becomes more extended but optically
thin in continuum, which means that the radius of the pseudophotosphere
is decreasing again. A remarkable variation occurs around JD 2 452 000
when the brightness rises again while at the same time both color
indices drop sharply (the object gets redder) and the emission strength also
decreases temporarily.
![\begin{figure}
\par\includegraphics[width=17cm,clip]{14477-f11.eps}
\end{figure}](/articles/aa/full_html/2010/09/aa14477-10/img67.png)
|
Figure 11:
Long-term variations seen in the peak intensity of the H |
| Open with DEXTER | |
![\begin{figure}
\par\includegraphics[width=8cm,clip]{14477-f12.eps}
\end{figure}](/articles/aa/full_html/2010/09/aa14477-10/img68.png)
|
Figure 12: Long-term variations of o Cas in the two-color diagram. They are characteristic for the positive correlation between the brightness and emission strength. |
| Open with DEXTER | |
4.3 Evidence for phase-locked changes
We attempted to remove the long-term peak-intensity variations from our
homogeneous observations with the program HEC13, which is based on a
fit via spline functions after Vondrák (1977,1969)![]() . After a few
experiments, we used the smoothing parameter
. After a few
experiments, we used the smoothing parameter
![]() through the 20-day moving box-car averaged data points as the optimal
choice. A period analysis of the O-C deviations from this fit clearly
indicated the orbital period of 1032 d. The corresponding phase
plot is shown in Fig. 13 and seems to indicate a double-wave
variation with minima centered on the binary elongations.
through the 20-day moving box-car averaged data points as the optimal
choice. A period analysis of the O-C deviations from this fit clearly
indicated the orbital period of 1032 d. The corresponding phase
plot is shown in Fig. 13 and seems to indicate a double-wave
variation with minima centered on the binary elongations.
![\begin{figure}
\par\includegraphics[width=8.5cm,clip]{14477-f13.eps}
\end{figure}](/articles/aa/full_html/2010/09/aa14477-10/img70.png)
|
Figure 13:
Phase diagram for the residual H |
| Open with DEXTER | |
5 Discussion
An important issue we have to address is the contradiction, now confirmed,
of a secondary of nearly the same mass as the primary, but
which is, however, 3 mag fainter. As already pointed
out by Koubský et al. (2004), the large mass function is inconsistent with the
absence of any discernable lines from the secondary. One possibility we
will discuss here is the binary nature of the secondary itself.
If we adopt an absolute magnitude MV=-2
![]() 55 for the primary (see
Sect. 3.2), the observed magnitude difference of 2
55 for the primary (see
Sect. 3.2), the observed magnitude difference of 2
![]() 9 implies MV=0
9 implies MV=0
![]() 35 for
the companion. If the companion is indeed formed by two identical stars
in a close binary orbit, each of these stars will be about 0
35 for
the companion. If the companion is indeed formed by two identical stars
in a close binary orbit, each of these stars will be about 0
![]() 7 fainter
in V, having MV=1
7 fainter
in V, having MV=1
![]() 05. According to the tabulation by Harmanec (1988),
this corresponds to two early A dwarfs. Their combined mass can easily
be something like 5
05. According to the tabulation by Harmanec (1988),
this corresponds to two early A dwarfs. Their combined mass can easily
be something like 5 ![]() ,
in agreement with our tentative estimate for the
mass of the companion in Sect. 3.2. The hypothesis that the companion is
a close binary is therefore internally consistent and seems to provide
a solution to the problem of its seemingly large mass following from the orbital solution.
,
in agreement with our tentative estimate for the
mass of the companion in Sect. 3.2. The hypothesis that the companion is
a close binary is therefore internally consistent and seems to provide
a solution to the problem of its seemingly large mass following from the orbital solution.
As to the size of the secondary binary, all we can say is that it must
be unresolved with respect to the interferometric resolution of our
observations. A possible example can easily be found in the double star
![]() Aurigae (Hummel et al. 1995), which consists of two
identical A2V components in a circular orbit of about four days period,
and with a separation of 0.08 AU. If placed at the distance of o Cas,
the apparent separation would be merely 0.3 mas. Only very high-
resolution observations with future interferometers would be able to
provide confirmation.
Aurigae (Hummel et al. 1995), which consists of two
identical A2V components in a circular orbit of about four days period,
and with a separation of 0.08 AU. If placed at the distance of o Cas,
the apparent separation would be merely 0.3 mas. Only very high-
resolution observations with future interferometers would be able to
provide confirmation.
A second issue is that if the H![]() emission region is formed in a disk,
it cannot be coplanar with the orbit as indicated by its nearly circular
apparent shape. This conclusion only holds if the disk is assumed to be
geometrically thin (as suggested by some studies, see for example the list
of references in Sect. 4.1 of Porter & Rivinius 2003). Otherwise coplanarity
would imply a wide opening angle (several tens of degrees) of the
circumstellar disk. If we
assume the stellar spin axis is orthogonal to the disk plane, the maximum
allowed angle of the disk normal to the line of sight of 36 degrees would
translate into a rotation speed of 375 km s-1 at the equator derived from
the measured
emission region is formed in a disk,
it cannot be coplanar with the orbit as indicated by its nearly circular
apparent shape. This conclusion only holds if the disk is assumed to be
geometrically thin (as suggested by some studies, see for example the list
of references in Sect. 4.1 of Porter & Rivinius 2003). Otherwise coplanarity
would imply a wide opening angle (several tens of degrees) of the
circumstellar disk. If we
assume the stellar spin axis is orthogonal to the disk plane, the maximum
allowed angle of the disk normal to the line of sight of 36 degrees would
translate into a rotation speed of 375 km s-1 at the equator derived from
the measured
![]() km s-1. Note that for the mass of 6.2
km s-1. Note that for the mass of 6.2 ![]() and radius of 8.0
and radius of 8.0 ![]() estimated in Sect. 3.2, the break-up velocity
would be 390 km s-1. Identifying the period of photometric and residual RV
variability of 1.257-d with the stellar rotational period would imply an
equatorial radius of 9.3
estimated in Sect. 3.2, the break-up velocity
would be 390 km s-1. Identifying the period of photometric and residual RV
variability of 1.257-d with the stellar rotational period would imply an
equatorial radius of 9.3 ![]() ,
which generally agrees with our estimate of
8
,
which generally agrees with our estimate of
8 ![]() .
Though the range of uncertanties is broad, there is a serious
possibility that the Be primary is close to the break-up speed. Surface
features away from the pole could create the photometric variability,
and the radial velocity variation via line profile variations.
.
Though the range of uncertanties is broad, there is a serious
possibility that the Be primary is close to the break-up speed. Surface
features away from the pole could create the photometric variability,
and the radial velocity variation via line profile variations.
We acknowledge the use of the latest publicly available version of program FOTEL written by Dr. Petr Hadrava. We also gratefully acknowledge the use of several spectra of o Cas made available in the Be Star Spectra (BeSS) database maintained at the Paris-Meudon Observatory and a few additional publicly available spectra secured by Mr. C. Buil at his private observatory. Dr. H. F. Haupt kindly provided PH with two individual UBV observations of o Cas. Our thanks are also due to Drs. P. Hadrava, M. Wolf, P. Skoda, S. Stefl, V. Votruba and Ms. A. Budovicová and Mr. P. Chadima who obtained several spectra andobservations used in this study. The authors would also like to thank Jim Benson and the NPOI observational support staff whose efforts made this project possible. This research was supported by the grants 205/03/0788, 205/06/0304, 205/08/H005 and P209/10/0715 of the Czech Science Foundation, from the research project AV0Z10030501 of the Academy of Sciences of the Czech Republic and from the Research Program MSM0021620860 Physical study of objects and processes in the solar system and in astrophysics of the Ministry of Education of the Czech Republic. The research of P.K. was supported from the ESA PECS grant 98058. C.T. acknowledges, with thanks, grant support from Research Corporation for Science Advancement and the Central Michigan University. The Navy Prototype Optical Interferometer is a joint project of the Naval Research Laboratory and the US Naval Observatory, in cooperation with Lowell Observatory, and is funded by the Office of Naval Research and the Oceanographer of the Navy. We acknowledge the use of the electronic database from CDS Strasbourg and electronic bibliography maintained by the NASA/ADS system. We are very grateful to an anonymous referee for a prompt and encouraging report, with useful comments and suggestions which helped to improve the manuscript.
References
- Abt, H. A., & Levy, S. G. 1978, ApJS, 36, 241
- Andrillat, Y., & Fehrenbach, C. 1982, A&AS, 48, 93
- Armstrong, J. T., Mozurkewich, D., Rickard, L. J., et al. 1998, ApJ, 496, 550
- Banerjee, D. P. K., Rawat, S. D., & Janardhan, P. 2000, A&AS, 147, 229
- Barker, P. K. 1983, PASP, 95, 996
- Belyakina, T. S., & Chugainov, P. F. 1960, Izvestiya Ordena Trudovogo Krasnogo Znameni Krymskoj Astrofizicheskoj Observatorii, 22, 257
- Bouigue, R. 1959, Annales Obs. Astron. Meteo. Toulouse, 27, 47
- Campbell, W., & Moore, J. 1928, Publ. Lick Obs., 16, 1
- Crawford, D. L. 1963, ApJ, 137, 523
- Crawford, D. L., Barnes, J. V., & Golson, J. C. 1971, AJ, 76, 1058
- Elias, J., Lanning, H., & Neugebauer, G. 1978, PASP, 90, 697
- Flower, P. J. 1996, ApJ, 469, 355
- Frost, E. B., Barrett, S. B., & Struve, O. 1926, ApJ, 64, 1
- Hadrava, P. 1990, Contribut. Astron. Obs. Skalnaté Pleso, 20, 23
- Hadrava, P. 2004, Publ. Astron. Inst. Acad. Sci. Czech Rep., 92, 1
- Häggkvist, L., & Oja, T. 1966, Arkiv Astron., 4, 137
- Hall, J. C., Fulton, E. E., Huenemoerder, D. P., Welty, A. D., & Neff, J. E. 1994, PASP, 106, 315
- Harmanec, P. 1983, Hvar Obs. Bull., 7, 55
- Harmanec, P. 1987, Bull. Astron. Inst. Czech., 38, 283
- Harmanec, P. 1988, Bull. Astron. Inst. Czech., 39, 329
- Harmanec, P. 1998, A&A, 335, 173
- Harmanec, P. 2000, in The Be Phenomenon in Early-Type Stars, ed. M. A. Smith, H. F. Henrichs, & J. Fabregat, IAU Colloq. 175, ASP Conf. Ser., 214, 13
- Harmanec, P. 2002, in Exotic Stars as Challenges to Evolution, ASP Conf. Ser., 279, 221
- Harmanec, P., & Horn, J. 1998, J. Astron. Data, 4, 5
- Harmanec, P., Horn, J., & Juza, K. 1994, A&AS, 104, 121
- Harmanec, P., Pavlovski, K., Bozic, H., et al. 1997, J. Astron. Data, 3, 5
- Harmanec, P., Habuda, P., Stefl, S., et al. 2000, A&A, 364, L85
- Haupt, H. F., & Schroll, A. 1974, A&AS, 15, 311
- Henroteau, F. 1921, Publ. Dominion Obs. Ottawa, 5, 45
- Horn, J., Koubský, P., Bozic, H., & Pavlovski, K. 1985, Info. Bull. Variable Stars, 2659, 1
- Horn, J., Kubát, J., Harmanec, P., et al. 1996, A&A, 309, 521
- Hubert, A. M., & Floquet, M. 1998, A&A, 335, 565
- Hubert-Delplace, A.-M., & Hubert, H. 1979, An atlas of Be stars (Paris-Meudon Observatory)
- Hummel, C. A., Armstrong, J. T., Buscher, D. F., et al. 1995, AJ, 110, 376
- Hummel, C. A., Mozurkewich, D., Armstrong, J. T., et al. 1998, AJ, 116, 2536
- Jancart, S., Jorissen, A., Babusiaux, C., & Pourbaix, D. 2005, A&A, 442, 365
- Johnson, H. L., Iriarte, B., Mitchell, R. I., & Wisniewski, W. Z. 1966, Commun. Lun. Planet. Lab., 4, 99
- Kaufer, A. 1988, Rev. Mod. Astrophys., 11, 177
- Koubský, P., Ak, H., Harmanec, P., Yang, S., & Bozic, H. 2004, in Variable Stars in the Local Group, ed. D. W. Kurtz, & K. R. Pollard, IAU Colloq. 193, ASP Conf. Ser., 310, 387
- Mendoza, E. E. 1958, ApJ, 128, 207
- Mitchell, R. I., & Johnson, H. L. 1969, Commun. Lun. Planet. Lab., 8, 1
- Pavlovski, K., Harmanec, P., Bozic, H., et al. 1997, A&AS, 125, 75
- Perryman, M. A. C., & ESA. 1997, The HIPPARCOS and TYCHO catalogues, Astrometric and photometric star catalogues derived from the ESA Hipparcos Space Astrometry Mission (Noordwijk, Netherlands: ESA Publications Division), ESA SP Ser., 1200
- Peton, A. 1972, A&A, 18, 106
- Plaskett, J. S., & Pearce, J. A. 1931, Publ. Dominion Astrophys. Obs. Victoria, 5, 1
- Porter, J. M., & Rivinius, T. 2003, PASP, 115, 1153
- Richardson, E. H. 1968, JRASC, 62, 313
- Schuster, W. J., & Guichard, J. 1984, Rev. Mex. Astron. Astrofis., 9, 141
- Skoda, P. 1996, in Astronomical Data Analysis Software and Systems V, ASP Conf. Ser., 101, 187
- Slettebak, A., & Reynolds, R. C. 1978, ApJS, 38, 205
- Slettebak, A., Collins, II, G. W., & Truax, R. 1992, ApJS, 81, 335
- Tycner, C., Gilbreath, G. C., Zavala, R. T., et al. 2006, AJ, 131, 2710
- Tycner, C., Jones, C. E., Sigut, T. A. A., et al. 2008, ApJ, 689, 461
- van Leeuwen, F. (ed.) 2007a, in Hipparcos, the New Reduction of the Raw Data, Astrophysics and Space Science Library, vol. 350
- van Leeuwen, F. 2007b, A&A, 474, 653
- Vondrák, J. 1969, Bull. Astron. Inst. Czech., 20, 349
- Vondrák, J. 1977, Bull. Astron. Inst. Czech., 28, 84
Online Material
Appendix A: Spectroscopy
Spectroscopic observations at our disposal consist of the following series of electronic spectrograms obtained at Ondrejov and the Dominion Astrophysical Observatory:- 1.
- 23 spectrograms secured in the coude focus of the Ondrejov 2-m telescope and a 702-mm focal length camera with a Reticon 1872RF linear detector. The spectra cover the wavelength region 6300-6730 'A with a resolution of 11-12 km s-1 per pixel.
- 2.
- 239 spectrograms secured with the same spectrograph configuration
but with a SITe-005
 CCD detector covering the region 6260-6760 'A.
Table A.1: Journal of RVs collected from the literature. For columns ``Source'' and ``Spg. No.'' the same notation as in Table 1 is used.
Table A.2: H
 peak intensities of o Cas in the units of the continuum
level collected from the literature.
peak intensities of o Cas in the units of the continuum
level collected from the literature.Table A.3: Individual radial velocities from the H
emission line wings and He I 6678
absorption line and the peak intensity of the H
emission. - 3.
- Two echelle spectrograms secured in the Cassegrain focus of the Ondrejov 2-m telescope with the Heros spectrograph (Kaufer 1988).
- 4.
- 178 DAO spectra obtained with the 1.22-m reflector and a CCD detector by SY and in the robotic mode also by PK. These spectra cover the wavelength region 6150-6750 'A with a resolution of 6 km s-1 per pixel. For further details on the DAO 21181 and 9681 spectrographs, readers are referred to Richardson (1968).
The initial reduction of Reticon spectra was carried out with the program SPEFO (Horn et al. 1996; Skoda 1996). We used the most advanced version JK2.63, which was developed by the late Mr. J. Krpata. The initial reductions of the DAO spectra (bias subtraction, flat fielding and conversion to 1D images) were carried out by SY in IRAF. The initial reduction of the Ondrejov CCD and Heros spectra, which included also the wavelength calibration, was carried out by MS, also in IRAF. The final reduction of all spectra (including wavelength calibration for the DAO spectra, continuum rectification and removal of cosmics and flaws) was carried in SPEFO by PK and PH. SPEFO was also used to reduce RV measurements via a comparison of direct and flipped line profiles on the computer screen. Following Horn et al. (1996) we routinely measured a selection of telluric lines and used them to calibrate the wavelength scale of each spectrum. Thanks to that, the spectra from all instruments are on the same heliocentric wavelength scale for all practical purposes.
Appendix B: Photometry
Table B.1:
Seasonal all-sky ![]() values of the check star HR 289.
values of the check star HR 289.
Photometric observations listed in Table 2 were secured at several ground-based observatories and during the Hipparcos mission. Below we provide some comments on the individual sets:
- Station 1: Hvar Differential
observations
relative to HR 189 = HD 4142 have continued quite regularly
since 1982 (JD 2 445 212.6). The check star HR 289 = HD 6114 was observed
as frequently as the the target. Observations secured before the year 2000
(JD 2 451 512.3) have already been analyzed in Pavlovski et al. (1997) and
the individual observations were published by Harmanec et al. (1997).
Each season of observations was reduced and carefully transformed
into the standard
system with the help of the program HEC22.
More recent observations were reduced with rel. 16 of the program which
allows also modelling of variable extinction during the observing night.
All standard magnitude differences were added to the following
magnitudes of HR 189
V=5
 674, B-V = -0
127, U-B = -0
566,
which were derived from all-sky observations on good nights over many observing seasons.
674, B-V = -0
127, U-B = -0
566,
which were derived from all-sky observations on good nights over many observing seasons.
The secular constancy of the comparison and check stars as well as the quality of our seasonal transformation to the standard system is documented by the seasonal differential and all-sky
magnitudes of the
check star HR 289 collected in Table B.1.
- Station 61: Hipparcos satellite
The photometric broadband
 all-sky observations from the deck of
the Hipparcos satellite were transformed to the
Johnson V magnitude via transformation formulæ derived by
Harmanec (1998). All observations with error flags larger than 1
were excluded.
all-sky observations from the deck of
the Hipparcos satellite were transformed to the
Johnson V magnitude via transformation formulæ derived by
Harmanec (1998). All observations with error flags larger than 1
were excluded.
- Station 30: San Pedro Mártir These all-sky observations were originally secured in the 13-color system. Seven m58 measurements from Mitchell & Johnson (1969) and Schuster & Guichard (1984), derived in the ``red system'', were adopted to represent the V magnitude without transformation.
- Station 26: Chiran-OHP Dates of these 2 all-sky observations were kindly communicated to PH by Dr. H. F. Haupt and are only accurate to about 0.2 d.
- Station 23: Catalina These original all-sky
observations
were published by Johnson et al. (1966) and we only derived HJDs from their JDs.
Table B.2:
All-sky ![]() photometry of o Cas with known times of observations.
Note that for observations by Haupt & Schroll (1974) the Julian dates are only
known to 1 decimal digit and should not be used for the analysis of
rapid variations.
photometry of o Cas with known times of observations.
Note that for observations by Haupt & Schroll (1974) the Julian dates are only
known to 1 decimal digit and should not be used for the analysis of
rapid variations.
Table B.3: Observations in m58 band of 13-C photometry.
Table B.4: Individual all-sky Hipparcos observations of o Cas transformed to Johnson V magnitudes. Observations with flags larger than 1 were omitted. All times of observations are in HJD-2 400 000.
All-sky ![]() observations compiled from the literature are tabulated in
Table B.2, the m58 observations in Table B.3, and
the Hipparcos
observations compiled from the literature are tabulated in
Table B.2, the m58 observations in Table B.3, and
the Hipparcos ![]() observations transformed
to Johnson V magnitude are in Table B.4. We derived HJDs of observations
in all cases when they were not given in the original sources.
All individual
observations transformed
to Johnson V magnitude are in Table B.4. We derived HJDs of observations
in all cases when they were not given in the original sources.
All individual ![]() observations secured since 1982 at Hvar are
presented in detail in Table B.5.
observations secured since 1982 at Hvar are
presented in detail in Table B.5.
Table B.5:
Individual differential ![]() observations of o Cas
secured at Hvar since 1982 relative to HR 189. We re-publish also the
already published part of observations because the all-sky
observations of o Cas
secured at Hvar since 1982 relative to HR 189. We re-publish also the
already published part of observations because the all-sky ![]() values
for the comparison star HR 193 have been improved since then.
All times of observations are in HJD-2 400 000.
values
for the comparison star HR 193 have been improved since then.
All times of observations are in HJD-2 400 000.
Footnotes
- ... stars
- Based on new spectroscopic, photometric and interferometric observations from the following observatories: Dominion Astrophysical Observatory, Herzberg Institute of Astrophysics, National Research Council of Canada, Hvar, Navy Prototype Optical Interferometer, and Astronomical Institute AS CR Ondrejov.
- ...
- Appendices are only available in electronic form at http://www.aanda.org
- ...
Atlas
- All his reduced individual H
observations are made
publicly available via http://www.astrosurf.com/buil
- ...
- The program HEC13 with simple instructions for use is freely available at http://astro.troja.mff.cuni.cz/ftp/hec/HEC13.
All Tables
Table 1: Journal of RV data sets.
Table 2: Journal of the photoelectric measurements with known times of observations.
Table 3:
Published all-sky ![]() observations with unknown epoch.
observations with unknown epoch.
Table 4: NPOI observations and model fit results.
Table 5: The (circular) orbital solutions based on the 1031-d period.
Table 6:
A sinusoidal fit for the 1.2578-d period in the H![]() emission RV O-C residuals.
emission RV O-C residuals.
Table 7: Orbital elements from combined fits.
Table A.1: Journal of RVs collected from the literature. For columns ``Source'' and ``Spg. No.'' the same notation as in Table 1 is used.
Table A.2:
H![]() peak intensities of o Cas in the units of the continuum
level collected from the literature.
peak intensities of o Cas in the units of the continuum
level collected from the literature.
Table A.3:
Individual radial velocities from the H![]() emission line wings and He I 6678
absorption line and the peak intensity of the H
emission line wings and He I 6678
absorption line and the peak intensity of the H![]() emission.
emission.
Table B.1:
Seasonal all-sky ![]() values of the check star HR 289.
values of the check star HR 289.
Table B.2:
All-sky ![]() photometry of o Cas with known times of observations.
Note that for observations by Haupt & Schroll (1974) the Julian dates are only
known to 1 decimal digit and should not be used for the analysis of
rapid variations.
photometry of o Cas with known times of observations.
Note that for observations by Haupt & Schroll (1974) the Julian dates are only
known to 1 decimal digit and should not be used for the analysis of
rapid variations.
Table B.3: Observations in m58 band of 13-C photometry.
Table B.4: Individual all-sky Hipparcos observations of o Cas transformed to Johnson V magnitudes. Observations with flags larger than 1 were omitted. All times of observations are in HJD-2 400 000.
Table B.5:
Individual differential ![]() observations of o Cas
secured at Hvar since 1982 relative to HR 189. We re-publish also the
already published part of observations because the all-sky
observations of o Cas
secured at Hvar since 1982 relative to HR 189. We re-publish also the
already published part of observations because the all-sky ![]() values
for the comparison star HR 193 have been improved since then.
All times of observations are in HJD-2 400 000.
values
for the comparison star HR 193 have been improved since then.
All times of observations are in HJD-2 400 000.
All Figures
|
|
Figure 1: uv-coverage achieved from the combined NPOI observations. |
| Open with DEXTER | |
| In the text | |
|
|
Figure 2: Image of Omicron Cassiopeiae from the NPOI data of 2005 Sep. 15. Equidistant (logarithmically) contours start at 1.02% and end at 65.3%, the dashed contour denotes a level of -1.02%. The restoring beam size is shown in the lower left corner. |
| Open with DEXTER | |
| In the text | |
|
|
Figure 3:
Calibrated (squared) visibility amplitudes plotted versus
wavelength for 2007 Aug. 9, on the AE-AN baseline at 10:18, 10:49, 11:17,
and 11:53 UT. The solid line shows the model prediction for a fit with
component separation |
| Open with DEXTER | |
| In the text | |
|
|
Figure 4:
RVs measured on the steep wings of the H |
| Open with DEXTER | |
| In the text | |
|
|
Figure 5:
Phase diagram for the 1031-d period as defined by ephemeris (1). The RVs in the upper panel were measured on the steep
wings of the H |
| Open with DEXTER | |
| In the text | |
|
|
Figure 6:
Phase diagram for the 1
|
| Open with DEXTER | |
| In the text | |
|
|
Figure 7:
Phase diagram for the old RVs from the literature for
the the orbital solution for the H |
| Open with DEXTER | |
| In the text | |
|
|
Figure 8: Apparent orbit of o Cas from interferometry and spectroscopy. The size of the uncertainty ellipses are set to one-fifth of the synthesized beam widths. |
| Open with DEXTER | |
| In the text | |
|
|
Figure 9:
H |
| Open with DEXTER | |
| In the text | |
|
|
Figure 10:
Observed visibility amplitudes (H |
| Open with DEXTER | |
| In the text | |
|
|
Figure 11:
Long-term variations seen in the peak intensity of the H |
| Open with DEXTER | |
| In the text | |
|
|
Figure 12: Long-term variations of o Cas in the two-color diagram. They are characteristic for the positive correlation between the brightness and emission strength. |
| Open with DEXTER | |
| In the text | |
|
|
Figure 13:
Phase diagram for the residual H |
| Open with DEXTER | |
| In the text | |
Copyright ESO 2010
Current usage metrics show cumulative count of Article Views (full-text article views including HTML views, PDF and ePub downloads, according to the available data) and Abstracts Views on Vision4Press platform.
Data correspond to usage on the plateform after 2015. The current usage metrics is available 48-96 hours after online publication and is updated daily on week days.
Initial download of the metrics may take a while.