| Issue |
A&A
Volume 517, July 2010
|
|
|---|---|---|
| Article Number | A89 | |
| Number of page(s) | 5 | |
| Section | Planets and planetary systems | |
| DOI | https://doi.org/10.1051/0004-6361/201014312 | |
| Published online | 13 August 2010 | |
Estimate of the neutral atoms' contribution to the Mercury exosphere caused by a new flux of micrometeoroids
P. Borin1 - M. Bruno2 - G. Cremonese3 - F. Marzari4
1 - CISAS, University of Padova, via Venezia 15, 35131 Padova, Italy
2 - Department of Mineralogical and Petrological Science, via Valperga
Caluso 35, 10125, Torino, Italy
3 - INAF-Astronomical Observatory of Padova, Vicolo dell'Osservatorio
5, 35131 Padova, Italy
4 - Department of Physics, via Marzolo 8, 35131 Padova, Italy
Received 24 February 2010 / Accepted 7 May 2010
Abstract
Context. The planet Mercury has an extended and
tenuous exosphere made up of atoms that are ejected from the surface by
energetic processes, including hypervelocity micrometeoritic impacts,
photon-stimulated desorption by UV radiation, and ion sputtering. The
well known constituents of the Hermean exosphere are H, He, O, Na, K,
and Ca but, from the new MESSENGER data from flybys, many others
elements are expected, as for instance Mg.
Aims. Meteoroid impacts are an important source of
neutral atoms in the exosphere of Mercury. We estimate the vapor and
neutral atom production rates on Mercury caused by impacts of
micrometeoroids of sizes between 5-100 ![]() m. The micrometeoritic flux is derived from a new
statistical approach based on direct numerical integrations of dust
particle trajectories under the action of the Poynting-Robertson drag
and the gravitational attraction of all planets.
m. The micrometeoritic flux is derived from a new
statistical approach based on direct numerical integrations of dust
particle trajectories under the action of the Poynting-Robertson drag
and the gravitational attraction of all planets.
Methods. We included two different calibration
sources for the meteoroid flux in our calculations of the vapor and
neutral atoms and also considered both asteroidal and cometary sources
for the dust. Three different surface compositions, which might be
found on the planet, have been adopted, each with a different mass
fraction of atoms in the regolith of the planet.
Results. We derive different values of neutral atom
vapor production rates assuming different calibration sources for the
meteoroid flux. The three simple mineralogical surface compositions
show significant differences in the related production rates, and they
are all greater than those reported in the previous papers assuming
other dominant source mechanisms. Our neutral atom production rates are
about one order of magnitude higher than the previous estimates. This
implies that the impact vaporization has a much higher contribution
than previously assumed.
Key words: planets and satellites: atmospheres - methods: statistical
1 Introduction
Mercury has an extended and tenuous exosphere made up of atoms that are released from the surface by energetic processes. These processes are generally considered to be micrometeoritic impacts, photon-stimulated desorption by UV radiation, ion sputtering and thermal vaporization. It is known that Mercury's exosphere contains H, He and O, discovered by Mariner 10, and Na, K and Ca seen by ground-based telescopes (Bida et al. 2000; Killen & Ip 1999; Killen et al. 2005; Potter & Morgan 1985; Potter & Morgan 1986). Moreover, Mg was observed by the MESSENGER MASCS instrument during the second Mercury flyby (McClintock et al. 2009; Killen et al. 2009). The Mg emission appears to be uniformly distributed, but it shows a weak north-south enhancement. Observations made during the first Mercury flyby of MESSENGER instead revealed a distinct north-south asymmetry of the Na tail and a strong dawn-dusk asymmetry in the night-side Ca distribution. In addition, Ca emission is strong near the equatorial regions and decreases toward higher latitudes, while Na emission has an high-latitude enhancement relative to the equatorial regions. Signals from both Mg and Ca are weaker than that of Na (McClintock et al. 2009).
Photon stimulated and thermal desorption are mechanisms that can explain the concentrations and temperature of Na and K in the exosphere. Chemical sputtering and solar wind sputtering are suggested to be responsible for the release of the metal atoms and water vapor (Potter 1995). Together with the ion sputtering, the meteoroid impacts are considered one of the main sources of Ca in the exosphere (Killen et al. 2005).
According to Killen et al. (2001) impact vaporization
is
responsible of only about a quarter of the flux of the Na forming
the exosphere. However, on the night side of the planet meteoroid
bombardment is a much more significant source because ion
sputtering is active only on the day side of Mercury. An estimate
of the production rate of Na caused by micrometeoroid impacts is
given by Hunten et al. (1988) suggesting a value of of 1022 Na s-1.
Morgan et al. (1988) give instead an orbital average
vaporization rate of about ![]() Na s-1.
Leblanc and Johnson (2003) in their model assume a value of about
Na s-1.
Leblanc and Johnson (2003) in their model assume a value of about
![]() Na s-1
at perihelion. Cremonese et al.
(2005) suggest that meteoroids with a radius extending 10-1 m
do not significantly contribute to the daily observations of the
exosphere because of their low impact probability on Mercury's
surface. The total mass of large meteoroids hitting the planet
account at most for 3% of the vapor mass produced also taking
into account that not all mass of the projectiles contributes to
the vapor. Large meteoroids, which have an impact frequency of
approximately two events/year, may produce only a localized and
temporary increase in the exospheric density (Mangano
et al. 2007).
Na s-1
at perihelion. Cremonese et al.
(2005) suggest that meteoroids with a radius extending 10-1 m
do not significantly contribute to the daily observations of the
exosphere because of their low impact probability on Mercury's
surface. The total mass of large meteoroids hitting the planet
account at most for 3% of the vapor mass produced also taking
into account that not all mass of the projectiles contributes to
the vapor. Large meteoroids, which have an impact frequency of
approximately two events/year, may produce only a localized and
temporary increase in the exospheric density (Mangano
et al. 2007).
We calculate the vapor and neutral atoms production rates on
Mercury, caused by the impacts of micrometeoroids. We consider the
size range between 5-100 ![]() m and adopt the impactor flux
estimates given by the new dynamical model of Borin et al.
(2009, hereafter BM). In this size range, dust particles are
significantly perturbed by Poynting-Robertson and solar wind drag
and spiral towards the Sun on timescales that depend on their size
and composition. According to Bruno
et al. (2007) and
Cremonese et al. (2005)
the production of neutral Na atoms is mainly due
to meteoroids larger than 10-5 m. As a
consequence,
approximately 50% of the Na comes from impacting meteoroids in
the size range
m and adopt the impactor flux
estimates given by the new dynamical model of Borin et al.
(2009, hereafter BM). In this size range, dust particles are
significantly perturbed by Poynting-Robertson and solar wind drag
and spiral towards the Sun on timescales that depend on their size
and composition. According to Bruno
et al. (2007) and
Cremonese et al. (2005)
the production of neutral Na atoms is mainly due
to meteoroids larger than 10-5 m. As a
consequence,
approximately 50% of the Na comes from impacting meteoroids in
the size range ![]() m,
43% from
10-4-10-3 m,
6% from 10-3-10-2 m
and the
remaining 1% from meteoroids with a size larger than 1 cm.
Cintala (1992) also states that 76% of all vapor is generated by
meteoroids with masses in between
10-3-10-7 g
(radius
range 10-4-10-5 m),
and that projectiles with a radius
greater than 10-3 m would have a
negligible effect on the
vapor production.
m,
43% from
10-4-10-3 m,
6% from 10-3-10-2 m
and the
remaining 1% from meteoroids with a size larger than 1 cm.
Cintala (1992) also states that 76% of all vapor is generated by
meteoroids with masses in between
10-3-10-7 g
(radius
range 10-4-10-5 m),
and that projectiles with a radius
greater than 10-3 m would have a
negligible effect on the
vapor production.
The calculations presented here were performed with two different calibration sources for the meteoroid flux. The first is based on the data from Love & Brownlee (1993) (as done in BM), while the second is based on data by Grün et al. (1985), hereafter LB and G respectively. Moreover, we give different values of the vapor production rates, taking into account the different balance between asteroidal and cometary sources of dust particles (Wiegert et al. 2009; Dermott et al. 2002). We consider three types of surface composition with different mass fraction of atoms in the regolith of the planet (Cremonese et al. 2005; Goettel 1988; Smith & Marconi 1995).
2 Vapor production
The volume of target material vaporized by a spherical particle of
mass m and impacting velocity v
can be estimated with the relation
given by Cintala (1992)
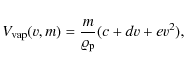
where m and
Assuming that the vapor composition is determined by the
target
composition, the production rate (atoms cm-2 s-1)
of
neutral atoms S is calculated by the following
relation (Morgan & Killen 1997)
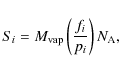
where
where
To compare our results with those reported in Cintala (1992) we
rewrite the equations used by the author to compute the vapor
production rate of neutral atoms. The differential flux can be
written as
where f(v) is the velocity distribution of dust particles (s/km) and h(m) is the mass distribution function of the impacting particles (g-1 cm-2 s-1). The velocity distribution function is given by the equation
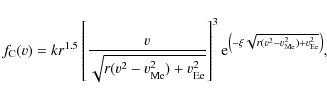
where k=3.81,
![\begin{displaymath}
h_{\rm C}(m)=-\frac{1}{mF_{1}}\exp\left(\sum_{i=0}^{11}c_{i}...
...ht)\cdot
\left[\sum_{i=1}^{11}i\cdot c_{i}\ln(m)^{i-1}\right],
\end{displaymath}](/articles/aa/full_html/2010/09/aa14312-10/img25.png)
where F1=0.364, ci are constants (Cintala 1992; Cremonese et al. 2005).
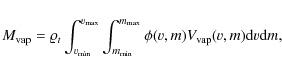
Following BM we can compute the neutral atoms and the vapor
production rates from the previous relations (2
and 3),
while the velocity distribution function
is given by the equation
where a=106.3 and
| (8) |
where
| (9) |
where
3 Mercury surface composition
We note that a deeper knowledge of the Mercury's surface composition is fundamental for obtaining a reliable estimate of the production rate of neutral atoms. Unfortunately, the mineralogical composition of the planet is still poorly constrained by ground based observations (Sprague et al. 2009) and MESSENGERS's data. As a consequence, our estimates of Si, which strongly depends on the surface composition through the coefficients fi, could be substantially revised when a more detailed knowledge of the Mercury's mineralogy will be gained. In any case, our model allows to derive the Si values for any surface composition by simply inserting the different estimates of fi values into Eq. (2) (Fig. 1). As a consequence, the proposed model is a valid tool to estimate the neutral elements production caused by the meteoritic impact on the Mercury's surface.
We consider three simple surface mineralogical compositions of Mercury which allow us to estimate the neutral atoms release and to show how it may change for different fi. The first one is the same as that in Cremonese et al. (2005), where the surface is assumed to be spatially homogeneous and made up of regolith with an anorthositic composition (90% plagioclase and 10% pyroxene in volume). They consider as a first approximation that the surface of Mercury is made up only of anorthosite, which seems to be a rock extensively distributed on the surface (e.g., Blewett et al. 2002; Sprague et al. 2000; Sprague et al. 2002; and Warell 2003). The second one is that given by Goettel (1988), which presents a refractory-rich model, a volatile-rich model, and three moderately refractory-rich models. In this work we use the Goettel second model (adding K) in our computations and we take as mass fraction a mean value of the lower and upper limits reported by the author in his work.
The third model is taken from Smith and Marconi (1988), but only for the Na mass fraction.
Table 1 reports the mass fraction of atoms in the surface of Mercury as adopted in Cremonese et al. (2005) and Bruno et al. (2007), by Goettel (1988) and by Smith and Marconi (1995).
![\begin{figure}
\par\includegraphics[width=7.5cm,clip]{14312fg1.eps}
\end{figure}](/articles/aa/full_html/2010/09/aa14312-10/img32.png)
|
Figure 1:
Production rate Si
(
|
| Open with DEXTER | |
Table 1: Mass fraction of elements in the regolith attended in the surface of Mercury.
4 Calibration of the model
The micrometeoritic flux computed by BM is obtained by a statistical approach based on numerical integrations of the orbits of dust particles under the action of the Poynting-Robertson drag and the gravitational attraction of all the planets. The numerical flux, derived by simulations following the evolution of 1000 particles with initial orbital elements typical of dust coming from the Main Belt, has to be calibrated on real flux data. This calibration is performed with the flux data on the Earth of Love & Brownlee (1993), derived from the satellite Long Duration Exposure Facility (LDEF). We also consider a different calibration based on Grün et al. (1985). They compute the interplanetary flux at 1 AU from measurements of in situ experiments on board of HEOS 2 and Pioneers 8 and 9.
Table 2 shows the computed micrometeoritic flux measured in N/year (where N is the number of impacts) and g/(cm2 s) given by Cintala, and by BM using LB and G calibration. It is possible to see that the LB calibration, is about seven (given in N/year) and three (given in g/cm2 s) times higher than the G calibration.
Table 2:
Micrometeoritic flux obtained by Cintala and BM model
with Love and Brownlee and ![]() calibration in the range
calibration in the range
![]() m.
m.
According to some authors (Dermott et al. 2002), the dust collected from satellite LDEF (Love & Brownlee 1993) comes from typical asteroidal orbits, but a recent model of dust claims that a fraction as high as 90% might come from both short and long period comets (Wiegert et al. 2009). The flux values of BM reported in Table 2 were obtained by considering dust reaching the Earth on orbits initially placed on the inner edge of the asteroid belt with low values of eccentricity and inclination. Actually, the measured flux of dust, like that obtained by LDEF (Love & Brownlee 1993), might consist of two components distinguishable only on the basis of their impact velocity. One component approaches the Earth on low eccentricity and low inclination orbits as those modelled by BM and it is possibly coming from the asteroid belt and some short period comets (Dermott et al. 2002). The second component, characterized by high impact velocities, would originate from comets with high values of eccentricity and inclination (Wiegert et al. 2009). The flux estimate given by BM is relative to the first component and a tuning coefficient is needed to evaluate the flux on Mercury derived by this component once calibrated to the LDEF data.
Table 3: Asteroidal and cometary percentages contributing to the flux given by Dermott et al. (2002) and Wiegert et al. (2009).
Table 4: Comparison of the production rate Si of released elements caused by micrometeoritic impacts.
Table 5: Same as Table 1 but for the mineralogical surface composition given by Goettel (1988). Si is given in N cm-2 s-1.
Table 6: Same as Tables 1 and 2 but for the mineralogical surface composition given by Smith & Marconi (1995).
5 Results
In this section we report the values of vapor and neutral atoms production rates obtained by considering
- LB and G calibrations;
- the percentages of cometary and asteroidal components expected to come from low eccentricity and low inclination orbits (Dermott et al. 2002; Wiegert et al. 2009);
- the surface compositions provided by Cremonese et al. (2005); Goettel (1988) and Smith and Marconi (1995).
The vapor production rates determined with the LB and G
calibrations are ![]() g cm-2 s-1
and
g cm-2 s-1
and
![]() g cm-2 s-1
respectively.
g cm-2 s-1
respectively.
In Tables 4-6 the Si values for the Cremonese et al. (2005), Goettel (1988) and Smith & Marconi (1995) soil compositions are reported. For a comparison, the Si values computed with the Cintala (1992) estimate of vapor are also reported in the Tables.
Cremonese et al. (2005) give an estimate of Na
production rate of
![]() N cm-2 s-1.
The previous tables show
that considering the Cremonese et al. (2005) surface
composition,
the vapor production rate computed assuming most of the dust
coming from low eccentricity and low inclination orbits is 96-171
times higher than that given by Cremonese et al. (2005).
Assuming
a much lower fraction of asteroidal dust, as suggested by Wiegert
et al. (2009), the vapor production rate is only
7-11 times higher
than that of Cremonese et al. (2005).
N cm-2 s-1.
The previous tables show
that considering the Cremonese et al. (2005) surface
composition,
the vapor production rate computed assuming most of the dust
coming from low eccentricity and low inclination orbits is 96-171
times higher than that given by Cremonese et al. (2005).
Assuming
a much lower fraction of asteroidal dust, as suggested by Wiegert
et al. (2009), the vapor production rate is only
7-11 times higher
than that of Cremonese et al. (2005).
If we consider the Goettel surface composition the vapor production rate is 10-20 times higher than that given by Cremonese et al. (2005) or very similar depending from the fraction of asteroidal dust assumed.
It is important to note that in our model all the neutral atoms produced by meteoroid impacts have enough energy to escape Mercury's gravity field. Berezhnoy & Klumov (2008) estimate that the mass fraction of impact-formed vapor captured by Mercury decreases slightly with increasing impact velocity, from 0.1 at 20 km s-1 to 0.07 at 60 km s-1. This effect would reduce our estimate for the neutral element production rates of about 10%.
6 Conclusions
We estimate the vapor production rate of neutral atoms on Mercury's exosphere considering different calibrations of the dust grain flux and different soil compositions. We adopt the model of Borin et al. (2009) to estimate the micrometeoritic flux on the planets and we tune it to account for different sources of dust. The model is based on the numerical integrations of dust particle trajectories started on low eccentricity and low inclination orbits at the inner edge of the Main Belt. The numerical data of the grain impacts on Mercury are then calibrated using the measured flux of dust on the Earth. However, the facilities measuring the dust flux on Earth (Love & Brownlee 1993) cannot distinguish between grains coming from low eccentricity and low inclination orbits (possibly of asteroidal origin) and those coming from comets with higher values of the two orbital parameters. For this reason, the flux of dust particles computed by Borin et al. (2009) is tuned with a coefficient that evaluates the source relevance. We consider two different calibrators, one is Love & Brownlee (1993) and the other is Grün et al. (1985). It is possible to point out that there is a small difference between them in the flux estimate.
We assumed three simple mineralogical surface compositions
for Mercury, finding significant differences in the related
production rates. For instance, the production rate of sodium
atoms ranges from a minimum of ![]() N cm-2 s-1
up to
N cm-2 s-1
up to ![]() N cm-2 s-1.
These values are higher than those derived by McClintock
et al. (2008) assuming the photon-stimulated desorption as
major source. This
implies that the impact vaporization appears to have a much
higher contribution than previously assumed.
N cm-2 s-1.
These values are higher than those derived by McClintock
et al. (2008) assuming the photon-stimulated desorption as
major source. This
implies that the impact vaporization appears to have a much
higher contribution than previously assumed.
The range of production rates reported in this work is quite wide depending on important parameters that future space missions to Mercury may allow to be better determined. However, thanks to its flexibility our method still could be used to provide accurate estimates.
References
- Berezhnoy, A. A., & Klumov, B. A. 2008, Icarus, 195, 511 [NASA ADS] [CrossRef] [Google Scholar]
- Bida, T. A., Killen, R. M., & Morgan, T. H. 2000, Nature, 404, 159 [NASA ADS] [CrossRef] [PubMed] [Google Scholar]
- Blewett, D. T., Hawke, B. R., & Lucey, P. G. 2002, Meteorit. Planet. Sci., 37, 1245 [Google Scholar]
- Borin, P., Cremonese, G., Marzari, F., Bruno, M., & Marchi, S. 2009, A&A, 503, 259 [NASA ADS] [CrossRef] [EDP Sciences] [Google Scholar]
- Bruno, M., Cremonese, G., & Marchi, S. 2007, Planetary and Space Science, 55, 1494 [Google Scholar]
- Cintala, M. J. 1992, in J. Geophys. Res., 97 [Google Scholar]
- Cremonese, G., Bruno, M., Mangano, V., Marchi, S., & Milillo, A. 2005, Icarus, 177, 122 [NASA ADS] [CrossRef] [Google Scholar]
- Dermott, S. F., et al. 2002, Asteroidal dust, in Asteroids III, ed. Bottke, Cellino, Paolicchi, & Binzel (Arizona University Press) [Google Scholar]
- Goettel, K. A. 1988, Mercury (Tucson, AZ: University of Arizona Press), 613 [Google Scholar]
- Grün, E., Zook, H. A., Fechtig, H., & Giese, R. H. 1985, Icarus, 62, 244 [NASA ADS] [CrossRef] [Google Scholar]
- Hunten, D. M., et al. 1988, The Mercury atmosphere, ed. F. Vilas, C. R. Chapman, & M. S. Matthews (Tucson, AZ: Mercury. Univ. of Arizona Press), 562 [Google Scholar]
- Killen, R. M., & Ip, W. H. 1999, Rev. Geophys., 37, 361 [NASA ADS] [CrossRef] [Google Scholar]
- Killen, R. M., Potter, A. E., Reiff, P., et al. 2001, J. Geophys. Res., 106, 20509 [Google Scholar]
- Killen, R. M., Bida, T. A., & Morgan, T. H. 2005, Icarus, 173, 300 [NASA ADS] [CrossRef] [Google Scholar]
- Killen, R. M., Bida, T. A., Potter, A. E., et al. 2009, Metallic Species in Mercury's Exosphere Observed by MESSENGER, the Keck I and McMath-Pierce Telescopes, American Astronomical Society, DPS meeting 2009 [Google Scholar]
- Leblanc, F., & Johnson, R. E. 2003, Icarus, 164, 261 [NASA ADS] [CrossRef] [Google Scholar]
- Love, S. G., & Brownlee, D. E. 1993, Science, 262 [PubMed] [Google Scholar]
- Mangano, V., Milillo, A., Mura, A., et al. 2007, Planetary and Space Science, 55, 1541 [NASA ADS] [CrossRef] [Google Scholar]
- Mann, I. 2004, Space Sci. Rev., 110, 269 [NASA ADS] [CrossRef] [Google Scholar]
- Marchi, S., Morbidelli, A., & Cremonese, G. 2005, A&A, 431, 1123 [NASA ADS] [CrossRef] [EDP Sciences] [Google Scholar]
- Marzari, F., & Vanzani, V. 1994, A&A, 283, 275 [NASA ADS] [Google Scholar]
- McClintock, W. E., Izenberg, N. R., Holsclaw, G. M., et al. 2008, Science, 321, 62 [NASA ADS] [CrossRef] [PubMed] [Google Scholar]
- McClintock, W. E., Vervack, R. J., Bradley, E. T., et al. 2009, Science, 324, 610 [NASA ADS] [PubMed] [Google Scholar]
- Morgan, T. H., & Killen, R. M. 1997, Planet. Space Sci., 45, 81 [NASA ADS] [CrossRef] [Google Scholar]
- Morgan, T. H., Zook, H. A., & Potter, A. E. 1988, Icarus, 75, 156 [NASA ADS] [CrossRef] [Google Scholar]
- Potter, A. E. 1995, Geophys. Res. Lett., 22, 3289 [NASA ADS] [CrossRef] [Google Scholar]
- Potter, A. E., & Morgan, T. H. 1985, Science, 229, 651 [NASA ADS] [CrossRef] [PubMed] [Google Scholar]
- Potter, A. E., & Morgan, T. H. 1986, Icarus, 67, 336 [NASA ADS] [CrossRef] [Google Scholar]
- Smith, W. H., & Marconi, M. L. 1995, ApJ, 443, 371 [NASA ADS] [CrossRef] [Google Scholar]
- Sprague, A. L., Deutsch, L. K., Hora, J., et al. 2000, Icarus, 147, 421 [NASA ADS] [CrossRef] [Google Scholar]
- Sprague, A. L., Emery, J. P., Donaldson, K. L., et al. 2002, Meteorit. Planet. Sci., 37, 1255 [Google Scholar]
- Sprague, A. L., Donaldson Hanna, K. L., Kozlowski, R. W. H., et al. 2009, Planetary Space Sci., 57, 364 [NASA ADS] [CrossRef] [Google Scholar]
- Warell, J. 2003, Icarus, 161, 199 [NASA ADS] [CrossRef] [Google Scholar]
- Wiegert, P. 2009, Icarus, 201, 295 [NASA ADS] [CrossRef] [Google Scholar]
All Tables
Table 1: Mass fraction of elements in the regolith attended in the surface of Mercury.
Table 2:
Micrometeoritic flux obtained by Cintala and BM model
with Love and Brownlee and ![]() calibration in the range
calibration in the range
![]() m.
m.
Table 3: Asteroidal and cometary percentages contributing to the flux given by Dermott et al. (2002) and Wiegert et al. (2009).
Table 4: Comparison of the production rate Si of released elements caused by micrometeoritic impacts.
Table 5: Same as Table 1 but for the mineralogical surface composition given by Goettel (1988). Si is given in N cm-2 s-1.
Table 6: Same as Tables 1 and 2 but for the mineralogical surface composition given by Smith & Marconi (1995).
All Figures
|
|
Figure 1:
Production rate Si
(
|
| Open with DEXTER | |
| In the text | |
Copyright ESO 2010
Current usage metrics show cumulative count of Article Views (full-text article views including HTML views, PDF and ePub downloads, according to the available data) and Abstracts Views on Vision4Press platform.
Data correspond to usage on the plateform after 2015. The current usage metrics is available 48-96 hours after online publication and is updated daily on week days.
Initial download of the metrics may take a while.