| Issue |
A&A
Volume 517, July 2010
|
|
|---|---|---|
| Article Number | A5 | |
| Number of page(s) | 6 | |
| Section | Astrophysical processes | |
| DOI | https://doi.org/10.1051/0004-6361/200913461 | |
| Published online | 23 July 2010 | |
MAGIC observation of the GRB 080430 afterglow
J. Aleksic1 - H. Anderhub2 - L. A. Antonelli3 - P. Antoranz4 - M. Backes5 - C. Baixeras6 - S. Balestra4 - J. A. Barrio4 - D. Bastieri7 - J. Becerra González8 - J. K. Becker5 - W. Bednarek9 - A. Berdyugin10 - K. Berger9 - E. Bernardini11 - A. Biland2 - R. K. Bock12,7 - G. Bonnoli13 - P. Bordas14 - D. Borla Tridon12 - V. Bosch-Ramon14 - D. Bose4 - I. Braun2 - T. Bretz15 - D. Britzger12 - M. Camara4 - E. Carmona12 - A. Carosi3 - P. Colin12 - S. Commichau2 - J. L. Contreras4 - J. Cortina1 - M. T. Costado8,16 - S. Covino3 - F. Dazzi17,26 - A. De Angelis17 - E. de Cea del Pozo18 - R. De los Reyes4,28 - B. De Lotto17 - M. De Maria17 - F. De Sabata17 - C. Delgado Mendez8,27 - M. Doert5 - A. Domínguez19 - D. Dominis Prester20 - D. Dorner2 - M. Doro7 - D. Elsaesser15 - M. Errando1 - D. Ferenc21 - E. Fernández1 - R. Firpo1 - M. V. Fonseca4 - L. Font6 - N. Galante12 - R. J. García López8,16 - M. Garczarczyk1 - M. Gaug8 - N. Godinovic20 - F. Goebel12,29 - D. Hadasch18 - A. Herrero8,16 - D. Hildebrand2 - D. Höhne-Mönch15 - J. Hose12 - D. Hrupec20 - C. C. Hsu12 - T. Jogler12 - S. Klepser1 - T. Krähenbühl2 - D. Kranich2 - A. La Barbera3 - A. Laille21 - E. Leonardo13 - E. Lindfors10 - S. Lombardi7 - F. Longo17 - M. López7 - E. Lorenz2,12 - P. Majumdar11 - G. Maneva22 - N. Mankuzhiyil17 - K. Mannheim15 - L. Maraschi3 - M. Mariotti7 - M. Martínez1 - D. Mazin1 - M. Meucci13 - J. M. Miranda4 - R. Mirzoyan12 - H. Miyamoto12 - J. Moldón14 - M. Moles19 - A. Moralejo1 - D. Nieto4 - K. Nilsson10 - J. Ninkovic12 - R. Orito12 - I. Oya4 - R. Paoletti13 - J. M. Paredes14 - M. Pasanen10 - D. Pascoli7 - F. Pauss2 - R. G. Pegna13 - M. A. Perez-Torres19 - M. Persic17,23 - L. Peruzzo7 - F. Prada19 - E. Prandini7 - N. Puchades1 - I. Puljak20 - I. Reichardt1 - W. Rhode5 - M. Ribó14 - J. Rico24,1 - M. Rissi2 - S. Rügamer15 - A. Saggion7 - T. Y. Saito12 - M. Salvati3 - M. Sánchez-Conde19 - K. Satalecka11 - V. Scalzotto7 - V. Scapin17 - T. Schweizer12 - M. Shayduk12 - S. N. Shore25 - A. Sierpowska-Bartosik9 - A. Sillanpää10 - J. Sitarek12,9 - D. Sobczynska9 - F. Spanier15 - S. Spiro3 - A. Stamerra13 - B. Steinke12 - N. Strah5 - J. C. Struebig15 - T. Suric20 - L. Takalo10 - F. Tavecchio3 - P. Temnikov22 - D. Tescaro1 - M. Teshima12 - D. F. Torres24,18 - N. Turini13 - H. Vankov22 - R. M. Wagner12 - V. Zabalza14 - F. Zandanel19 - R. Zanin1 - J. Zapatero6 - A. de Ugarte-Postigo3
1 - IFAE, Edifici Cn., Campus UAB, 08193, Bellaterra, Spain
2 - ETH Zurich, 8093, Switzerland
3 - INAF National Institute for Astrophysics, 00136 Rome, Italy
4 - Universidad Complutense, 28040 Madrid, Spain
5 - Technische Universität Dortmund, 44221 Dortmund, Germany
6 - Universitat Autònoma de Barcelona, 08193 Bellaterra, Spain
7 - Università di Padova and INFN, 35131 Padova, Italy
8 - Inst. de Astrofísica de Canarias, 38200 La Laguna, Tenerife, Spain
9 - University of ![]() ódz, 90236 Lodz, Poland
ódz, 90236 Lodz, Poland
10 - Tuorla Observatory, University of Turku, 21500 Piikkiö, Finland
11 - Deutsches Elektronen-Synchrotron (DESY), 15738 Zeuthen, Germany
12 - Max-Planck-Institut für Physik, 80805 München, Germany
13 - Università di Siena, and INFN Pisa, 53100 Siena, Italy
14 - Universitat de Barcelona (ICC/IEEC), 08028 Barcelona, Spain
15 - Universität Würzburg, 97074 Würzburg, Germany
16 - Depto. de Astrofisica, Universidad, 38206 La Laguna, Tenerife, Spain
17 - Università di Udine, and INFN Trieste, 33100 Udine, Italy
18 - Institut de Ciències de l'Espai (IEEC-CSIC), 08193 Bellaterra, Spain
19 - Inst. de Astrofísica de Andalucía (CSIC), 18080 Granada, Spain
20 - Croatian MAGIC Consortium, Institute R. Boskovic, University of Rijeka and University of Split, 10000 Zagreb, Croatia
21 - University of California, Davis, CA-95616-8677, USA
22 - Inst. for Nucl. Research and Nucl. Energy, 1784 Sofia, Bulgaria
23 - INAF/Osservatorio Astronomico and INFN, 34143 Trieste, Italy
24 - ICREA, 08010 Barcelona, Spain
25 - Università di Pisa, and INFN Pisa, 56126 Pisa, Italy
26 - Supported by INFN Padova
27 - Now at: Centro de Investigaciones Energéticas, Medioambientales y Tecnológicas (CIEMAT), Madrid, Spain
28 - Now at: Max-Planck-Institut für Kernphysik, 69029 Heidelberg, Germany
29 - Deceased
Received 13 October 2009 / Accepted 17 April 2010
Abstract
Context. Gamma-ray bursts are cosmological sources emitting
radiation from the gamma-rays to the radio band. Substantial
observational efforts have been devoted to the study of gamma-ray
bursts during the prompt phase, i.e. the initial burst of high-energy
radiation, and during the long-lasting afterglows. In spite of many
successes in interpreting these phenomena, there are still several open
key questions about the fundamental emission processes, their
energetics and the environment.
Aims. Independently of specific gamma-ray burst theoretical
recipes, spectra in the GeV/TeV range are predicted to be remarkably
simple, being satisfactorily modeled with power-laws, and therefore
offer a very valuable tool to probe the extragalactic background light
distribution. Furthermore, the simple detection of a component at
very-high energies, i.e. at ![]() 100 GeV,
would solve the ambiguity about the importance of various possible
emission processes, which provide barely distinguishable scenarios at
lower energies.
100 GeV,
would solve the ambiguity about the importance of various possible
emission processes, which provide barely distinguishable scenarios at
lower energies.
Methods. We used the results of the MAGIC telescope observation of the moderate resdhift (![]() )
GRB 080430 at energies above about 80 GeV, to
evaluate the perspective for late-afterglow observations with ground
based GeV/TeV telescopes.
)
GRB 080430 at energies above about 80 GeV, to
evaluate the perspective for late-afterglow observations with ground
based GeV/TeV telescopes.
Results. We obtained an upper limit of
![]() erg cm-2 s-1
for the very-high energy emission of GRB 080430, which
cannot set further constraints on the theoretical scenarios proposed
for this object also due to the difficulties in modeling the low-energy
afterglow. Nonetheless, our observations show that Cherenkov telescopes
have already reached the required sensitivity to detect the GeV/TeV
emission of GRBs at moderate redshift (
erg cm-2 s-1
for the very-high energy emission of GRB 080430, which
cannot set further constraints on the theoretical scenarios proposed
for this object also due to the difficulties in modeling the low-energy
afterglow. Nonetheless, our observations show that Cherenkov telescopes
have already reached the required sensitivity to detect the GeV/TeV
emission of GRBs at moderate redshift (
![]() ), provided the observations are carried out at early times, close to the onset of their afterglow phase.
), provided the observations are carried out at early times, close to the onset of their afterglow phase.
Key words: radiation mechanisms: non-thermal - gamma-ray burst: individual: GRB 080430
1 Introduction
GRB 080430 was detected by the Swift satellite (Gehrels et al. 2004) on April 30, 2008 at 19:53:02 UT (Guidorzi et al. 2008a). The prompt emission lasted ![]() 16 s (Stamatikos et al. 2008) allowing to assign this event to the long duration class (Kouveliotou et al. 1993).
X-ray and optical counterparts were discovered and followed-up by many
groups. Optical spectroscopy was rapidly carried out allowing to derive
a redshift of z = 0.758. The redshift estimate has been revised recently with a more accurate wavelength calibration (de Ugarte Postigo et al. 2008; Cucchiara & Fox 2008,
and de Ugarte Postigo et al., in preparation, hereinafter DEUG10).
The relatively modest redshift made it an interesting target for the
major atmospheric gamma-ray imaging Cherenkov (MAGIC) telescope
16 s (Stamatikos et al. 2008) allowing to assign this event to the long duration class (Kouveliotou et al. 1993).
X-ray and optical counterparts were discovered and followed-up by many
groups. Optical spectroscopy was rapidly carried out allowing to derive
a redshift of z = 0.758. The redshift estimate has been revised recently with a more accurate wavelength calibration (de Ugarte Postigo et al. 2008; Cucchiara & Fox 2008,
and de Ugarte Postigo et al., in preparation, hereinafter DEUG10).
The relatively modest redshift made it an interesting target for the
major atmospheric gamma-ray imaging Cherenkov (MAGIC) telescope![]() observations. In the past, upper limits for several gamma-ray bursts
(GRBs) at energies greater than about 100 GeV were reported both
for single event observations and for a sample of events (e.g. Albert et al. 2006; Aharonian et al. 2009; Albert et al. 2007; Tam et al. 2006).
In this paper we try to predict the very-high energy (VHE) flux for
GRB 080430 by modeling the detected X-ray and optical
afterglow and adopting as a reference the cosmological fireball model (Zhang 2007; Piran 1999). In Sect. 2 we report the results of the MAGIC observation, in Sect. 3 we discuss the lower energy afterglow, in Sect. 4 we introduce the adopted modeling scenario for the VHE flux, in Sect. 5 we discuss the effect of extragalactic background light (EBL) attenuation and finally, in Sect. 6, conclusions and considerations about future perspectives are drawn. Throughout the paper we assume a
observations. In the past, upper limits for several gamma-ray bursts
(GRBs) at energies greater than about 100 GeV were reported both
for single event observations and for a sample of events (e.g. Albert et al. 2006; Aharonian et al. 2009; Albert et al. 2007; Tam et al. 2006).
In this paper we try to predict the very-high energy (VHE) flux for
GRB 080430 by modeling the detected X-ray and optical
afterglow and adopting as a reference the cosmological fireball model (Zhang 2007; Piran 1999). In Sect. 2 we report the results of the MAGIC observation, in Sect. 3 we discuss the lower energy afterglow, in Sect. 4 we introduce the adopted modeling scenario for the VHE flux, in Sect. 5 we discuss the effect of extragalactic background light (EBL) attenuation and finally, in Sect. 6, conclusions and considerations about future perspectives are drawn. Throughout the paper we assume a
![]() cosmology with
cosmology with
![]() ,
,
![]() and
h0 = 0.71. At the redshift of the GRB the luminosity distance is
and
h0 = 0.71. At the redshift of the GRB the luminosity distance is ![]() 4.8 Gpc (
4.8 Gpc (![]()
![]() cm, corresponding to a distance modulus
cm, corresponding to a distance modulus
![]() mag). All errors are
mag). All errors are ![]() unless stated otherwise. Throughout this paper the convention
Qx = Q/10x has been adopted in CGS units. Results presented in this paper supersede those reported in Covino et al. (2009b).
unless stated otherwise. Throughout this paper the convention
Qx = Q/10x has been adopted in CGS units. Results presented in this paper supersede those reported in Covino et al. (2009b).
2 MAGIC observations
GRB 080430 occurred while the Sun was still above the horizon at the MAGIC site (Roque de los Muchachos,
![]() N,
N,
![]() W). The MAGIC observation started immediately after sunset, at 21:12:14 UTC and ended at 23:52:30 UTC. The observation
was disturbed by clouds. The beginning of the observation was at
T0 + 4753 s, well after the end of the prompt emission phase. The observation with MAGIC started at a zenith angle of
W). The MAGIC observation started immediately after sunset, at 21:12:14 UTC and ended at 23:52:30 UTC. The observation
was disturbed by clouds. The beginning of the observation was at
T0 + 4753 s, well after the end of the prompt emission phase. The observation with MAGIC started at a zenith angle of
![]() ,
reaching
,
reaching
![]() at the end. The data set was divided into two time intervals. Results
from the first time interval, giving the lower energy upper limit, are
used in this context. Analysis of the dataset, in the energy bin from
80 up to 125 GeV with the spectral parameters derived in
Sect. 4, gave a 95% CL upper limit of
at the end. The data set was divided into two time intervals. Results
from the first time interval, giving the lower energy upper limit, are
used in this context. Analysis of the dataset, in the energy bin from
80 up to 125 GeV with the spectral parameters derived in
Sect. 4, gave a 95% CL upper limit of
![]() erg cm-2 s-1 (under the assumption of steady emission) or a fluence limit of
erg cm-2 s-1 (under the assumption of steady emission) or a fluence limit of
![]() erg cm-2
for a time interval of 6258 s from 21:12:14 to 22:56:32 UTC.
These limits contain a 30% systematic uncertainty on the absolute
detector efficiency. Limits at higher energies are less important for
the present analysis due to intense EBL absorption above
erg cm-2
for a time interval of 6258 s from 21:12:14 to 22:56:32 UTC.
These limits contain a 30% systematic uncertainty on the absolute
detector efficiency. Limits at higher energies are less important for
the present analysis due to intense EBL absorption above ![]() 100 GeV (see Sect. 5). It is important to note that at that time, the sum trigger hardware upgrade (Garczarczyk et al. 2009; Albert et al. 2008)
which allows the MAGIC telescope to carry out reliable observations
with lower energy threshold was not yet available for GRB observations.
Therefore the lowest obtained upper limit is a factor two higher than
in later cases (e.g. Gaug et al. 2009).
100 GeV (see Sect. 5). It is important to note that at that time, the sum trigger hardware upgrade (Garczarczyk et al. 2009; Albert et al. 2008)
which allows the MAGIC telescope to carry out reliable observations
with lower energy threshold was not yet available for GRB observations.
Therefore the lowest obtained upper limit is a factor two higher than
in later cases (e.g. Gaug et al. 2009).
3 Afterglow light-curve and spectral energy distribution
It is not our purpose to discuss here the physics of the afterglow of
this event, which will be discussed in detail in DEUG10. Nevertheless,
preliminary results shows that this afterglow can not be satisfactory
described within any common referred scenario. In particular the early
afterglow is puzzling, likely requiring two distinct components with
separated time evolution. However, at the epoch of the MAGIC
observations (about 8 ks from the high-energy event), the
afterglow seems to have entered a more stable phase although other
components, as late prompt emission, can still be contributing (Ghisellini et al. 2007).
Analysis of the spectral (from optical to X-rays) information shows
that the afterglow can be described as due to the interaction of a
relativistic outflow with the circumburst medium surrounding the
progenitor (Zhang 2007; Piran 1999).
The outflow is relativistic and shocks form with consequent particle
acceleration. Details of the acceleration process are not known and it
is usually assumed that electrons follow a power-law distribution in
energy with a slope p. Numerical simulations suggest it should be
![]() (Achterberg et al. 2001; Vietri 2003) although other scenarios predict a wider range which is indeed supported by the analysis of several afterglows (Ellison & Double 2004; Shen et al. 2006).
The late-afterglow of GRB 080430 can be characterized by a
constant circumburst density environment with typical number density
(Achterberg et al. 2001; Vietri 2003) although other scenarios predict a wider range which is indeed supported by the analysis of several afterglows (Ellison & Double 2004; Shen et al. 2006).
The late-afterglow of GRB 080430 can be characterized by a
constant circumburst density environment with typical number density ![]() cm-3. The electron distribution index turns out to be
cm-3. The electron distribution index turns out to be
![]() .
Given the afterglow spectral properties, it is possible to predict the
time decay, which in the optical, is well consistent with the
predictions. On the contrary, X-ray data (Guidorzi et al. 2008b)
show a much milder decay than expected. It is difficult to attribute
this behaviour to a specific physical ingredients. Common additions to
the reference model (Zhang 2007), which may or
may not modify the spectrum involve late energy injection, structured
jets, flares, circumburst density variations, etc. (see e.g. Zhang et al. 2006; Panaitescu 2006,
for comprehensive discussions about these factors). It is clearly well
beyond the scope of this paper to discuss these issues in detail, which
are indeed still not well settled. We therefore model the VHE emission
assuming the afterglow could be described in the context of the
standard afterglow model (Zhang 2007; Piran 1999).
Finally, we comment possible modifications induced by additional
phenomena which in general can even increase the expected VHE flux.
.
Given the afterglow spectral properties, it is possible to predict the
time decay, which in the optical, is well consistent with the
predictions. On the contrary, X-ray data (Guidorzi et al. 2008b)
show a much milder decay than expected. It is difficult to attribute
this behaviour to a specific physical ingredients. Common additions to
the reference model (Zhang 2007), which may or
may not modify the spectrum involve late energy injection, structured
jets, flares, circumburst density variations, etc. (see e.g. Zhang et al. 2006; Panaitescu 2006,
for comprehensive discussions about these factors). It is clearly well
beyond the scope of this paper to discuss these issues in detail, which
are indeed still not well settled. We therefore model the VHE emission
assuming the afterglow could be described in the context of the
standard afterglow model (Zhang 2007; Piran 1999).
Finally, we comment possible modifications induced by additional
phenomena which in general can even increase the expected VHE flux.
In order to characterize the afterglow spectrum we must compute the synchrotron injection,
![]() ,
and cooling,
,
and cooling,
![]() ,
frequency values. The injection frequency is where most of the
synchrotron emission occurs and the cooling frequency identifies where
electrons cool effectively. In case of constant circumburst medium (Fan & Piran 2006; Yost et al. 2003) we have:
,
frequency values. The injection frequency is where most of the
synchrotron emission occurs and the cooling frequency identifies where
electrons cool effectively. In case of constant circumburst medium (Fan & Piran 2006; Yost et al. 2003) we have:
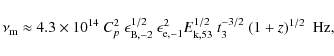
and
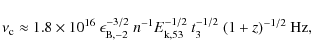
where z is the redshift of the source, n the medium particle density,
The total energy can be derived from the burst isotropic energy
![]() with some assumptions about the spectrum and by correcting it for the fireball radiative efficiency
with some assumptions about the spectrum and by correcting it for the fireball radiative efficiency ![]() .
We estimate
.
We estimate
![]() as the integral of the burst spectral model (Stamatikos et al. 2008) in the
1 - 104 keV band (Amati et al. 2002),
the energy range covering most of the prompt emission of GRBs. In this
energy band the spectrum of a burst is typically described by a Band
function (Band et al. 1993):
as the integral of the burst spectral model (Stamatikos et al. 2008) in the
1 - 104 keV band (Amati et al. 2002),
the energy range covering most of the prompt emission of GRBs. In this
energy band the spectrum of a burst is typically described by a Band
function (Band et al. 1993):
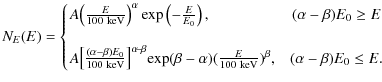
In order to calculate the integral we need to know the two power-law photon indices
Summing up, for modeling the high energy emission of the
GRB 080430 afterglow, we have applied these parameters:
energy
![]() erg,
erg,
![]() ,
,
![]() ,
,
![]() ,
the circumburst medium density profile
,
the circumburst medium density profile ![]() cm-3 and the redshift
cm-3 and the redshift
![]() .
Our observation was at
.
Our observation was at ![]() ksec after the burst onset. At this epoch we have
ksec after the burst onset. At this epoch we have
![]() Hz and
Hz and
![]() Hz.
The afterglow synchrotron emission is in the so called ``slow-cooling''
regime (i.e. the synchrotron cooling frequency is above the synchrotron
injection frequency) as confirmed by the modeling of the spectral
energy distribution (SED) from optical to X-rays (DEUG10) and usually
expected at the epoch of the observations for typical afterglows (Zhang & Mészáros 2004).
Hz.
The afterglow synchrotron emission is in the so called ``slow-cooling''
regime (i.e. the synchrotron cooling frequency is above the synchrotron
injection frequency) as confirmed by the modeling of the spectral
energy distribution (SED) from optical to X-rays (DEUG10) and usually
expected at the epoch of the observations for typical afterglows (Zhang & Mészáros 2004).
4 Synchrotron-Self Compton during the afterglow
The analysis of the high-energy emission from the various phases of a GRB has been considered by many authors as a powerful diagnostic tool of GRB physics (Aharonian et al. 2008; Fan & Piran 2008; Falcone et al. 2008; Fan 2009; Murase et al. 2009; Covino et al. 2009a; Dermer & Fryer 2008; Panaitescu 2008; Xue et al. 2009; Galli & Piro 2008; Kumar & Barniol Duran 2009; Gilmore et al. 2010; Le & Dermer 2009). In the present case, the most important emission process to consider is essentially the Synchrotron-Self Compton (SSC). Due to the long delay between the MAGIC observations and the GRB onset (about two hours) any residual prompt emission can be ruled out. Superposed to the SSC component, external inverse Compton (EIC) processes could also play a role and will be briefly mentioned later. We do not consider here hadronic models (Pe'er & Waxman 2004; Böttcher & Dermer 1998) in our discussion. They could, however, be of special interest if GRBs are important sources of cosmic-rays.
Once the parameters of the lower-energy synchrotron emission are known, it is possible to predict the SSC component with good reliability. Among the many possible choices, we followed the recipe described by Fan & Piran (2008).
The SSC process essentially generates a new spectral component
superposed to the underlying synchrotron spectrum, with the same global
shape up to a cut-off frequency:
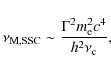
|
(4) |
where
Assuming we are in a constant density circumburst environment, the
predicted SSC spectrum is characterized by two typical frequencies (Fan & Piran 2008) as the synchrotron afterglow spectrum (Sect. 3):
where
Defining
![]() ,
it can be shown (Sari & Esin 2001) that
,
it can be shown (Sari & Esin 2001) that![]() :
:
|
(7) |
The synchrotron injection to cooling synchrotron frequency ratio for the slow-cooling case is:
The numerical factor in front of Eq. (8) is not exactly the one derived from Eqs. (1) and (2) since, as already mentioned in Sect. 3, IC cooling also affects the location of the synchrotron cooling frequency making the problem numerically difficult to solve. We now apply an approximate solution fully adequate for our goals (see Fan & Piran 2008, for a full discussion). With our parameters Eq. (8) becomes
In order to derive the expected flux density at the MAGIC energy we
have to compute the flux density at the typical SSC frequency (Fan & Piran 2008) at the epoch of the MAGIC observation:
| |
|
||
| (9) |
where
Then, finally, from the peak energy to the MAGIC band we have to extrapolate the SSC spectrum as:
and, again with our parameters,
Any uncertainty in the underlying afterglow parameters affects of
course the VHE predictions. Some of these
uncertainties have, however, a rather limited (considering the present
observational limits) impact because one of the relevant factors, the
ratio between the injection and cooling synchrotron frequency, is
constrained by the afterglow SED and uncertainties for micro-physical
parameters should still keep the ratio close to the observed value. The
![]() ratio drives the importance of the IC component and the position of the
cooling SSC frequency, i.e. where the VHE flux begins to decrease
steeply moving toward higher energies. The total energy on the contrary
is estimated assuming an efficiency for the GRB prompt emission
process. This is a weakly known factor given that at present no
satisfactory description of the GRB prompt emission process exists (Lyutikov 2009). It is therefore possible (Zhang 2007)
that the efficiency is substantially higher, modifying the total energy
and therefore the expected flux. Circumburst matter density has an
important effect on the expected SSC flux. With the present afterglow
data it can essentially only be estimated coupled to the micro-physical
parameters. A higher density would make the SSC component more
important and possibly detectable at lower energies (see e.g. Harrison et al. 2001).
However, the value of the circumburst density derived for afterglows
with data allowing a detailed modeling is consistent with the value we
report for GRB 080430 (Panaitescu 2005).
ratio drives the importance of the IC component and the position of the
cooling SSC frequency, i.e. where the VHE flux begins to decrease
steeply moving toward higher energies. The total energy on the contrary
is estimated assuming an efficiency for the GRB prompt emission
process. This is a weakly known factor given that at present no
satisfactory description of the GRB prompt emission process exists (Lyutikov 2009). It is therefore possible (Zhang 2007)
that the efficiency is substantially higher, modifying the total energy
and therefore the expected flux. Circumburst matter density has an
important effect on the expected SSC flux. With the present afterglow
data it can essentially only be estimated coupled to the micro-physical
parameters. A higher density would make the SSC component more
important and possibly detectable at lower energies (see e.g. Harrison et al. 2001).
However, the value of the circumburst density derived for afterglows
with data allowing a detailed modeling is consistent with the value we
report for GRB 080430 (Panaitescu 2005).
A milder than expected temporal decay in the X-rays band together with the consistency of the observed SED with the reference afterglow model prediction, raises some concern about the reliability of the adopted theoretical scenario. A shallower afterglow decay showing a synchrotron spectrum can be explained with late-time energy injection in the outflow (Zhang et al. 2006; Panaitescu 2006). In this case the VHE SSC flux temporal decay could be slowed in a way related to the time evolution of the energy injection (Fan & Piran 2008; Galli & Piro 2007; Gou & Mészáros 2007; Wei & Fan 2007). However, the lack of a similar behaviour at optical wavelengths do not fully support this possibility since energy injection should affect the afterglow evolution in any band. It could be possible that the X-ray afterglow is affected by the occurrence of a late-time slow flares which could be barely detectable at lower energies. Such a flare can produce a detectable VHE emission although likely with a longer and smoother time evolution due to the interaction of the flare photons with the outflow accelerated electrons (see Fan & Piran 2008), i.e. probably at later time than the MAGIC observations. Finally, we mention that micro-physical parameters can evolve in time. Their evolution could affect the position and time-evolution of the SSC injection and cooling frequencies and as consequence the expected VHE flux. However, a satisfactory theoretical framework for these possible modifications of the reference afterglow model is still lacking, leaving the introduction of these ingredients purely phenomenological and likely beyond the scope of this paper.
![\begin{figure}
\par\includegraphics[width=9cm,clip]{13461fg1.eps}
\end{figure}](/articles/aa/full_html/2010/09/aa13461-09/img79.png)
|
Figure 1: Predictions at different time delays from the high-energy event for the SSC emission during the afterglow of GRB 080430. Black triangles are 95% CL upper limits derived by MAGIC at various energies. Lines of a same color show the same SSC model, but a different absorption model of the gamma-rays by the EBL. The blue lines correspond to the MAGIC observation window. |
| Open with DEXTER | |
5 Extragalactic background light attenuation
Gamma-rays in the GeV energy regime are absorbed through
pair-production processes with the EBL. The precise light content of
the EBL is strongly debated. We have to rely on many different models,
the predictions of which at ![]() span a wide range of optical depths, from less than 1 up to 6 (Fan & Piran 2008). Moreover, the MAGIC collaboration recently published a striking observational result (Albert et al. 2008) suggesting that the EBL attenuation could be much lower than previously assumed. Thus at the redshift of GRB 080430 (
span a wide range of optical depths, from less than 1 up to 6 (Fan & Piran 2008). Moreover, the MAGIC collaboration recently published a striking observational result (Albert et al. 2008) suggesting that the EBL attenuation could be much lower than previously assumed. Thus at the redshift of GRB 080430 (
![]() )
and at the MAGIC energy (
)
and at the MAGIC energy (![]() GeV) an optical depth
GeV) an optical depth ![]() not far from unity is possible. We included four representative models from Kneiske et al. (2004), Franceschini et al. (2008) and Gilmore et al. (2009) and show the range of possible absorbed spectra in Fig. 1.
The blue lines correspond to the MAGIC observation delay, the other
lines show the spectrum at earlier observation times, in principle
easily accessible to IACTs. On average, we can assume an attenuation of
the received flux from the afterglow of GRB 080430 of the order a
factor 3 or even less, allowing us to estimate
not far from unity is possible. We included four representative models from Kneiske et al. (2004), Franceschini et al. (2008) and Gilmore et al. (2009) and show the range of possible absorbed spectra in Fig. 1.
The blue lines correspond to the MAGIC observation delay, the other
lines show the spectrum at earlier observation times, in principle
easily accessible to IACTs. On average, we can assume an attenuation of
the received flux from the afterglow of GRB 080430 of the order a
factor 3 or even less, allowing us to estimate
![]() erg cm-2 s-1 as the predicted flux in the MAGIC band. As a matter of fact, our choice is possibly very conservative as Gilmore et al. (2009) described models, in agreement with the observations reported in Albert et al. (2008), with an optical depth as low as
erg cm-2 s-1 as the predicted flux in the MAGIC band. As a matter of fact, our choice is possibly very conservative as Gilmore et al. (2009) described models, in agreement with the observations reported in Albert et al. (2008), with an optical depth as low as
![]() at the same conditions of these MAGIC observations.
at the same conditions of these MAGIC observations.
6 Discussions
The prediction of the expected SSC flux for an afterglow is not straightforward since it is required to know, or at least to reliably estimate, the parameters of the underlying afterglow (see Fig. 1). In the case of GRB 080430 the sampling of the X-ray and optical afterglow allowed us to estimate the various afterglow parameters to derive meaningful predictions for the expected SSC flux. However, a satisfactory modeling of the GRB 080430 can not be obtained within the standard fireball scenario. At least two different components are required for the early-time afterglow, as discussed in detail in DEUG10. Our present discussion is based on the assumption that one of these components is the regular afterglow (i.e. the forward-shock Zhang 2007; Piran 1999) which is the main responsible for the late-afterglow emission although other components are likely playing a role.
The results appear to be well below the reported upper limits. Furthermore, our assumed low opacity for the EBL is in agreement with current observations (see also Gilmore et al. 2009). At any rate, this pilot case shows fairly interesting perspectives for a late-afterglow detection at high energies.
In general, to increase the flux expected from a GRB afterglow (for
SSC) it is mandatory to try to decrease the observation energy (due to
the
![]() dependence above the cooling SSC frequency), which is also very
important for the minimization of the EBL attenuation. If the telescope
sum trigger hardware upgrade had already been implemented before the
observations, a limit above an energy of 45 GeV would have been
obtained (see also Gaug et al. 2009).
At these energies, the strong effect of the EBL could probably be
neglected and the low energy threshold together with the expected
performances of MAGIC II would undoubtedly increase the chances of
positive detections.
dependence above the cooling SSC frequency), which is also very
important for the minimization of the EBL attenuation. If the telescope
sum trigger hardware upgrade had already been implemented before the
observations, a limit above an energy of 45 GeV would have been
obtained (see also Gaug et al. 2009).
At these energies, the strong effect of the EBL could probably be
neglected and the low energy threshold together with the expected
performances of MAGIC II would undoubtedly increase the chances of
positive detections.
As a matter of fact, GRB 080430 was an average event in terms of energetics. More energetic GRBs are indeed relatively common, and due to the positive dependence on the isotropic energy of a GRB, much higher fluxes than in the present case can be foreseen. This is also true if we consider the uncertainty in the present total energy determination, which is based on an average value for the prompt emission efficiency.
The time delay of the observation from the GRB has a clear impact, essentially because the observed SSC component is strictly related to the underlying synchrotron component which rapidly decays in intensity with time, depending on the specific environment and micro-physical parameters. Equation (10) goes roughly with t-1.1 which means that had MAGIC been able to start observations right at the start of the late afterglow phase (e.g. at T0 + 1 ks), the flux predictions would have increased by more than an order of magnitude. The time delay of about two hours, coupled with the poor observing conditions, were more than enough to depress the observed flux and raise the reported upper limits.
Given the uncertainties in the modeling of the afterglow, many possible modifications to the standard afterglow model (Zhang 2007; Piran 1999) can be applied. In some scenarios, substantially higher VHE flux can be predicted (e.g. Panaitescu 2008; Murase et al. 2010), which makes observations at VHE energies powerful potential diagnostic tools.
The case of GRB 080430 in this pilot study demonstrates
that if three conditions are met: 1) a moderate redshift (
![]() ),
2) start of observations right at the beginning of the afterglow phase
or even during the prompt emission and 3) the use of the MAGIC sum
trigger enabling reaching energy thresholds below 50 GeV,
detection is within reach. The recent detection of
),
2) start of observations right at the beginning of the afterglow phase
or even during the prompt emission and 3) the use of the MAGIC sum
trigger enabling reaching energy thresholds below 50 GeV,
detection is within reach. The recent detection of ![]() 30 GeV photons during the prompt or afterglow phases of GRB 090510 (Abdo et al. 2009) and GRB 090902B (de Palma et al. 2009b,a) by the Fermi satellite (Band et al. 2009)
indeed shows that, with a threshold energy of a few tens of GeV and
with the collecting area of a ground-based Cherenkov telescope, GRB VHE
astrophysics is becoming a promising observational field.
30 GeV photons during the prompt or afterglow phases of GRB 090510 (Abdo et al. 2009) and GRB 090902B (de Palma et al. 2009b,a) by the Fermi satellite (Band et al. 2009)
indeed shows that, with a threshold energy of a few tens of GeV and
with the collecting area of a ground-based Cherenkov telescope, GRB VHE
astrophysics is becoming a promising observational field.
We would like to thank the Instituto de Astrofisica de Canarias for the excellent working conditions at the Observatorio del Roque de los Muchachos in La Palma. The support of the German BMBF and MPG, the Italian INFN and Spanish MICINN is gratefully acknowledged. This work was also supported by ETH Research Grant TH 34/043, by the Polish MNiSzW Grant N N203 390834, and by the YIP of the Helmholtz Gemeinschaft. We also thank Yizhong Fan for continuous theoretical support. Lorenzo Amati, Cristiano Guidorzi, Alessandra Galli, Daniele Malesani and Ruben Salvaterra for useful discussions. We finally remark the very constructive report from the referee which helped to substantially improve the paper.
References
- Abdo, A. A., Ackermann, M., Ajello, M., et al. 2009, Nature, 462, 331 [NASA ADS] [CrossRef] [PubMed] [Google Scholar]
- Achterberg, A., Gallant, Y. A., Kirk, J. G., & Gauthmann, A. W. 2001, MNRAS, 328, 393 [NASA ADS] [CrossRef] [Google Scholar]
- Aharonian, F., Akhperjianian, A. G., Barres DeAlmeida, U., et al. 2009, ApJ, 690, 1068 [NASA ADS] [CrossRef] [Google Scholar]
- Aharonian, F., Buckley, J., Kifune, T., et al. 2008, Rep. Prog. Phys., 71 [Google Scholar]
- Albert, J., Aliu, E., Anderhub, H., et al. 2006, ApJ, 641, 9 [NASA ADS] [CrossRef] [Google Scholar]
- Albert, J., Aliu, E., Anderhub, H., et al. 2007, ApJ, 667, 358 [NASA ADS] [CrossRef] [Google Scholar]
- Albert, J., Aliu, E., Anderhub, H., et al. 2008, Science, 320, 1752 [NASA ADS] [CrossRef] [PubMed] [Google Scholar]
- Amati, L., Frontera, F., Tavani, M., et al. 2002, A&A, 390, 81 [NASA ADS] [CrossRef] [EDP Sciences] [Google Scholar]
- Band, D., Matteson, J., Ford, L., et al. 1993, ApJ, 413, 281 [NASA ADS] [CrossRef] [Google Scholar]
- Band, D. L., Axelsson, M., Baldini, L., et al. 2009, ApJ, 701, 1673 [NASA ADS] [CrossRef] [Google Scholar]
- Böttcher, M., & Dermer, C. D. 1998, ApJ, 499, 131 [Google Scholar]
- Covino, S., Garczarczyk, G., Galante, N., et al. 2009a, AIP Conf. Proc., 1112, 172 [NASA ADS] [CrossRef] [Google Scholar]
- Covino, S., Garczarczyk, G., Gaug, M., et al. 2009b, [arXiv:0907.0993] [Google Scholar]
- Cucchiara, A., & Fox, D. B. 2008, GCN, 7654 [Google Scholar]
- de Palma, F., Bregeon, J., Tajima, H., et al. 2009a, GCN, 9867 [Google Scholar]
- de Palma, F., Bissaldi, E., Tajima, H., et al. 2009b, GCN, 9872 [Google Scholar]
- Dermer, C. D., & Fryer, C. L. 2008, [arXiv:0809.3959] [Google Scholar]
- de Ugarte Postigo, A., Christensen, L., Gorosabel, J., et al. 2008, GCN, 7650 [Google Scholar]
- Ellison, D. C., & Double, G. P. 2004, APh, 22, 323 [Google Scholar]
- Falcone, A. D., Wialliams, D. A., Baring, M. G., et al. 2008, [arXiv:0810.0520] [Google Scholar]
- Fan, Y.-Z. 2009, MNRAS, 397, 1539 [NASA ADS] [CrossRef] [Google Scholar]
- Fan, Y.-Z., & Piran, T. 2006, MNRAS, 369, 197 [NASA ADS] [CrossRef] [Google Scholar]
- Fan, Y.-Z., & Piran, T. 2008, Frontiers of Physics in China, 3, 306 [NASA ADS] [CrossRef] [Google Scholar]
- Franceschini, A., Rodighiero, G., & Vaccari, M. 2008, A&A, 487, 837 [NASA ADS] [CrossRef] [EDP Sciences] [Google Scholar]
- Galli, A., & Piro, L. 2007, A&A, 475, 421 [NASA ADS] [CrossRef] [EDP Sciences] [Google Scholar]
- Galli, A., & Piro, L. 2008, A&A, 489, 1073 [NASA ADS] [CrossRef] [EDP Sciences] [Google Scholar]
- Garczarczyk, M., Gaug, Ma., Antonelli, A., et al. 2009, [arXiv:0907.1001] [Google Scholar]
- Gaug, M., Covino, S., Garczarczyk, M., et al. 2009, [arXiv:0907.0996] [Google Scholar]
- Gehrels, N., Chincarini G., Giommi, P., et al. 2004, ApJ, 611, 1005 [NASA ADS] [CrossRef] [Google Scholar]
- Ghisellini, G., Ghirlanda, G., Nava, L., & Firmani, C. 2007, ApJ, 658, 75 [Google Scholar]
- Gilmore, R. C., Madau, P., Primack, J. R., Somerville, R. S., & Haardt, F. 2009, MNRAS, 399, 1694 [Google Scholar]
- Gilmore, R. C., Prada, F., Primack, J. R., et al. 2010, MNRAS, 402, 565 [NASA ADS] [CrossRef] [Google Scholar]
- Gou, L.-J., & Mészáros, P. 2007, ApJ, 668, 1045 [Google Scholar]
- Guidorzi, C., Barthelmy, S. D., Beardmore, A. P., et al. 2008a, GCN, 7647 [Google Scholar]
- Guidorzi, C., Stamatikos, M., Landsman, W., et al. 2008b, GCNR, 139 [Google Scholar]
- Harrison, F. A., Yost, S. A., Sari, R., et al. 2001, ApJ, 559, 123 [NASA ADS] [CrossRef] [Google Scholar]
- Kneiske, T. M., Bretz, T., Manheim, K., & Hartmann, D. H. 2004, A&A, 413, 807 [NASA ADS] [CrossRef] [EDP Sciences] [Google Scholar]
- Koeveliotou, C., Meegan, C. A., Fishman, G. J., et al. 1993, ApJ, 413, 101 [Google Scholar]
- Kumar, P., & Barniol Duran, R. 2009, MNRAS, 400, L75 [NASA ADS] [CrossRef] [Google Scholar]
- Le, T., & Dermer, C. D. 2009, ApJ, 700, 1026 [NASA ADS] [CrossRef] [Google Scholar]
- Lyutikov, M. 2009, [arXiv:0911.0349] [Google Scholar]
- Molinari, E., Vergani, S. D., Malesani, D., et al. 2007, A&A, 469, 13 [Google Scholar]
- Murase, K., Zhang, B., Takahashi, K., & Nagataki, S. 2009, MNRAS, 396, 1825 [NASA ADS] [CrossRef] [Google Scholar]
- Murase, K., Toma, K., Yamazaki, R., Nagataki, S., & Ioka, K. 2010, MNRAS, 402, 54 [NASA ADS] [Google Scholar]
- Nousek, J. A., Kouveliotou, C., Grupe, D., et al. 2006, ApJ, 642, 389 [NASA ADS] [CrossRef] [Google Scholar]
- Panaitescu, A. 2005, MNRAS, 363, 1409 [NASA ADS] [CrossRef] [Google Scholar]
- Panaitescu, A. 2006, NCimB, 121, 1099 [Google Scholar]
- Panaitescu, A. 2008, MNRAS, 385, 1628 [NASA ADS] [CrossRef] [Google Scholar]
- Panaitescu, A., & Kumar, P. 2002, ApJ, 571, 779 [NASA ADS] [CrossRef] [Google Scholar]
- Pe'er, A., & Waxman, E. 2004, ApJ, 633, 1018 [Google Scholar]
- Piran, T. 1999, Phys. Rep., 314, 575 [Google Scholar]
- Sari, R., & Esin, A. A. 2001, ApJ, 548, 787 [NASA ADS] [CrossRef] [Google Scholar]
- Sakamoto, T., Hullinger, D., Sato, G., et al. 2008, ApJ, 679, 570 [NASA ADS] [CrossRef] [Google Scholar]
- Sakamoto, T., Sato, G., Barbier, L., et al. 2009, ApJ, 693, 922 [NASA ADS] [CrossRef] [Google Scholar]
- Shen, R., Kumar, P., & Robinson, E. L. 2006, MNRAS, 371, 1441 [NASA ADS] [CrossRef] [Google Scholar]
- Stamatikos, M., Barthelmy, S. D., Baumgartner, W., et al. 2008, GCN, 7656 [Google Scholar]
- Tam, P. H., Wagner, S. J., Pühlhofer, G., et al. 2006, NCimB, 121, 1595 [NASA ADS] [Google Scholar]
- Vietri, M. 2003, ApJ, 591, 954 [Google Scholar]
- Xue, R. R., Tam, P. H., Wagner, S. J., et al. 2009, ApJ, 703, 60 [NASA ADS] [CrossRef] [Google Scholar]
- Yost, S. A., Harrison, F. A., Sari, R., & Frail, D. A. 2003, ApJ, 597, 459 [NASA ADS] [CrossRef] [Google Scholar]
- Wei, D.-M., & Fan, Y.-Z. 2007, ChJAA, 7, 509 [Google Scholar]
- Zhang, B. 2007, Chin. J. Astron. Astrophys., 7, 1 [Google Scholar]
- Zhang, B., & Mészáros, P. 2004, IJMPA, 19, 2385 [Google Scholar]
- Zhang, B., Fan, Y. Z., Dyks, J., et al. 2006, ApJ, 642, 354 [NASA ADS] [CrossRef] [Google Scholar]
- Zhang, B., Liang, E., Page, K., et al. 2007, ApJ, 655, 989 [NASA ADS] [CrossRef] [Google Scholar]
Footnotes
- ... telescope
![[*]](/icons/foot_motif.png)
- http://wwwmagic.mpp.mpg.de/
- ... that
- Here we deliberately ignore the possibility to have higher order IC components which could be effective in cooling the electron population.
All Figures
|
|
Figure 1: Predictions at different time delays from the high-energy event for the SSC emission during the afterglow of GRB 080430. Black triangles are 95% CL upper limits derived by MAGIC at various energies. Lines of a same color show the same SSC model, but a different absorption model of the gamma-rays by the EBL. The blue lines correspond to the MAGIC observation window. |
| Open with DEXTER | |
| In the text | |
Copyright ESO 2010
Current usage metrics show cumulative count of Article Views (full-text article views including HTML views, PDF and ePub downloads, according to the available data) and Abstracts Views on Vision4Press platform.
Data correspond to usage on the plateform after 2015. The current usage metrics is available 48-96 hours after online publication and is updated daily on week days.
Initial download of the metrics may take a while.