| Issue |
A&A
Volume 516, June-July 2010
|
|
|---|---|---|
| Article Number | A80 | |
| Number of page(s) | 10 | |
| Section | Stellar structure and evolution | |
| DOI | https://doi.org/10.1051/0004-6361/200913885 | |
| Published online | 19 July 2010 | |
Properties and nature of Be stars![[*]](/icons/foot_motif.png)
27. Orbital and recent long-term variations of the Pleiades Be star Pleione = BU Tauri
J. Nemravová1 - P. Harmanec1 - J. Kubát2 - P. Koubský2 - L. Iliev3 - S. Yang4 - J. Ribeiro5 - M. Slechta2 - L. Kotková2 - M. Wolf1 - P. Skoda2
1 - Astronomical Institute of the Charles University,
Faculty of Mathematics and Physics, V Holesovickách 2, 180 00 Praha 8, Czech Republic
2 - Astronomical Institute of the Academy of Sciences, 251 65 Ondrejov, Czech Republic
3 - Institute of Astronomy, Bulgarian Academy of Sciences, 1784, 72 Tsarigradsko Chaussee Blvd., Sofia, Bulgaria
4 - Physics & Astronomy Department, University of Victoria,
PO Box 3055 STN CSC, Victoria, BC, V8W 3P6, Canada
5 - Observatório do Instituto Geográfico do Exército,
R. Venezuela 29, 3 Esq. 1500-618, Lisboa, Portugal
Received 16 December 2009 / Accepted 19 February 2010
Abstract
Radial-velocity variations of the H![]() emission measured
on the steep wings of the H
emission measured
on the steep wings of the H![]() line, prewhitened for the long-time
changes, vary periodically with a period of 218
line, prewhitened for the long-time
changes, vary periodically with a period of 218
![]() 025
025 ![]() 0
0
![]() 022, confirming
the suspected binary nature of the bright Be star BU Tau,
a member of the Pleiades cluster. The orbit seems to have
a high eccentricity over 0.7, but we also briefly discuss the possibility
that the true orbit is circular and that the eccentricity is spurious owing
to the phase-dependent effects of the circumstellar matter. The projected
angular separation of the spectroscopic orbit is large enough to allow
the detection of the binary with large optical interferometers, provided
the magnitude difference primary - secondary is not too large.
Since our data cover the onset of a new shell phase up to development
of a metallic shell spectrum, we also briefly discuss the recent long-term
changes. We confirm the formation of a new envelope, coexisting with
the previous one, at the onset of the new shell phase. We find that
the full width at half maximum of the H
022, confirming
the suspected binary nature of the bright Be star BU Tau,
a member of the Pleiades cluster. The orbit seems to have
a high eccentricity over 0.7, but we also briefly discuss the possibility
that the true orbit is circular and that the eccentricity is spurious owing
to the phase-dependent effects of the circumstellar matter. The projected
angular separation of the spectroscopic orbit is large enough to allow
the detection of the binary with large optical interferometers, provided
the magnitude difference primary - secondary is not too large.
Since our data cover the onset of a new shell phase up to development
of a metallic shell spectrum, we also briefly discuss the recent long-term
changes. We confirm the formation of a new envelope, coexisting with
the previous one, at the onset of the new shell phase. We find that
the full width at half maximum of the H![]() profile has been decreasing
with time for both envelopes. In this connection, we briefly discuss
Hirata's hypothesis of precessing gaseous disk
and possible alternative scenarios of the observed long-term changes.
profile has been decreasing
with time for both envelopes. In this connection, we briefly discuss
Hirata's hypothesis of precessing gaseous disk
and possible alternative scenarios of the observed long-term changes.
Key words: stars: early-type - binaries: close - stars: emission-line, Be - stars: individual: BU Tau
1 Introduction
Pleione (BU Tau, 28 Tau, HD 23862) is a well-known Be star and a member of the Pleiades cluster. It underwent several phase transitions between B, Be, and Be shell phases, accompanied by pronounced light variations; see, e.g. Gulliver (1977), Sharov & Lyuty (1976), Iliev et al. (1988), Sharov & Lyutyj (1992), Hirata & Kogure (1976), Hirata & Kogure (1977), Hirata (1995), Doazan et al. (1988), Iliev et al. (2007), and Tanaka et al. (2007).
There is a rather complicated history of attempts to study
the radial-velocity (RV hereafter) variations of this star. Struve & Swings (1943)
measured RVs on the photographic spectra taken in the years 1938-1943 and
tentatively concluded that the RV of BU Tau varies with a possible period
of 142 days or - less likely - 106 days. Merrill (1952) studied RVs
from 1941 to 1951 and found clear long-term variations with some
overlapping changes on a shorter time scale. Gulliver (1977) analyzed
a large collection of digitized photographic spectra from 1938-1954
and from 1969-1975 and concluded that there are no significant RV changes. Ballereau et al. (1988) carried out an analysis of a homogeneous series
of Haute Provence high-dispersion photographic spectra from 1978-1987
and once more concluded that the shell RVs vary with periods of 136.0
and 106.7 days. Katahira et al. (1996b,a) analyzed shell RVs from the two
consecutive shell phases separated some 34 years, using published as well
as new RVs and concluded that BU Tau is a spectroscopic binary with
an orbital period of 218
![]() 0, semi-amplitude of 5.9 km s-1, and a large
orbital eccentricity of 0.60. However, Rivinius et al. (2006) - analyzing
a series of electronic spectra - were unable to confirm the 218-d
period and concluded that BU Tau is not a spectroscopic binary.
Hirata (2007) analyzed a long series of polarimetric observations
and presented a model of a slowly precessing disk to explain the long-term
B - Be - Be shell phase transition. He argued that the disk
precession is caused by the attractive force of the secondary in the 218-d
binary.
Harmanec (1982) compiled the majority of at that time available RVs
of BU Tau and averaged them over about 100 days. This resulted in
a smooth RV curve with a period of about 13 000 days (35.6 years),
in phase with the recorded shell episodes. Harmanec (1982) speculated
that BU Tau could be a long-periodic binary with shell phases occurring
always at the same orbital phases. A more distant companion with
an angular distance of 0
0, semi-amplitude of 5.9 km s-1, and a large
orbital eccentricity of 0.60. However, Rivinius et al. (2006) - analyzing
a series of electronic spectra - were unable to confirm the 218-d
period and concluded that BU Tau is not a spectroscopic binary.
Hirata (2007) analyzed a long series of polarimetric observations
and presented a model of a slowly precessing disk to explain the long-term
B - Be - Be shell phase transition. He argued that the disk
precession is caused by the attractive force of the secondary in the 218-d
binary.
Harmanec (1982) compiled the majority of at that time available RVs
of BU Tau and averaged them over about 100 days. This resulted in
a smooth RV curve with a period of about 13 000 days (35.6 years),
in phase with the recorded shell episodes. Harmanec (1982) speculated
that BU Tau could be a long-periodic binary with shell phases occurring
always at the same orbital phases. A more distant companion with
an angular distance of 0
![]() 22 was indeed discovered from speckle
interferometry by McAlister et al. (1989). Gies et al. (1990)
studied a sequence of low-dispersion H
22 was indeed discovered from speckle
interferometry by McAlister et al. (1989). Gies et al. (1990)
studied a sequence of low-dispersion H![]() spectra of BU Tau taken with
a sampling rate of 7 ms during a lunar occultation on 1987 March 6.
They detected an asymmetry of the envelope in agreement with the observed
long-term V/R changes. They speculated that the speckle-interferometric
component could have an eccentric orbit and that the recurrent shell phases
could be caused by its periastron passages. Luthardt & Menchenkova (1994)
compiled RVs from the years 1938-1990 and confirmed a period of
12 450-12 860 days. They advocated an eccentric orbit and mass transfer
resulting in a release of a new shell during periastron passages, but
the gaps in their RV curve do not allow one to conclude that the orbit has
a high eccentricity. Finally, using the technique of adaptive optics
photometry and astrometry, Roberts et al. (2007) report discovery of a new
companion to BU Tau at a separation of 4
spectra of BU Tau taken with
a sampling rate of 7 ms during a lunar occultation on 1987 March 6.
They detected an asymmetry of the envelope in agreement with the observed
long-term V/R changes. They speculated that the speckle-interferometric
component could have an eccentric orbit and that the recurrent shell phases
could be caused by its periastron passages. Luthardt & Menchenkova (1994)
compiled RVs from the years 1938-1990 and confirmed a period of
12 450-12 860 days. They advocated an eccentric orbit and mass transfer
resulting in a release of a new shell during periastron passages, but
the gaps in their RV curve do not allow one to conclude that the orbit has
a high eccentricity. Finally, using the technique of adaptive optics
photometry and astrometry, Roberts et al. (2007) report discovery of a new
companion to BU Tau at a separation of 4
![]() 66 with a spectral type M5.
They also confirm a companion at 0
66 with a spectral type M5.
They also confirm a companion at 0
![]() 24 and discuss other suggested
companions.
24 and discuss other suggested
companions.
Table 1: Journal of new spectroscopic observations for BU Tau.
We succeeded in collecting a rich series of electronic spectra
at several observatories, covering many cycles of the suspected 218-d
period. The main goal of this study is, therefore, to resolve the issue
of whether BU Tau is a spectroscopic binary. Katahira et al. (1996b,a)
based their orbit on the RV measurements
of shell lines that may be affected by possible asymmetries in
the circumstellar matter. Moreover, their RV curve has a rather small amplitude
and is based on a collection of heterogeneous data. It naturally shows
a rather large scatter around the mean curve.
The spectra at our disposal all cover the red spectral
region near H![]() .
They were taken over the time interval when
the star had fairly strong H
.
They were taken over the time interval when
the star had fairly strong H![]() emission. Therefore, our study is based
on the RV measurements of the steep wings of the emission, which
is a procedure that turned out to be successful for detecting the
duplicity of several other Be stars
(Harmanec et al. 2000; Koubský et al. 2000; Bozic et al. 1995; Miroshnichenko et al. 2002,2001).
emission. Therefore, our study is based
on the RV measurements of the steep wings of the emission, which
is a procedure that turned out to be successful for detecting the
duplicity of several other Be stars
(Harmanec et al. 2000; Koubský et al. 2000; Bozic et al. 1995; Miroshnichenko et al. 2002,2001).
Since very pronounced long-term spectral variations occurred over the time interval covered by our spectra, we also briefly describe these changes and discuss them, especially in relation to the model put forward by Hirata (2007).
2 Spectroscopic observations and their reductions
The red spectra at our disposal were obtained at five observatories and their overview is in Table 1. Details about the instruments and data reduction can be found in Appendix A where also Table A.1 with our RV measurements of the steep wings of the HOver the interval of the more than 5000 days covered by our observations,
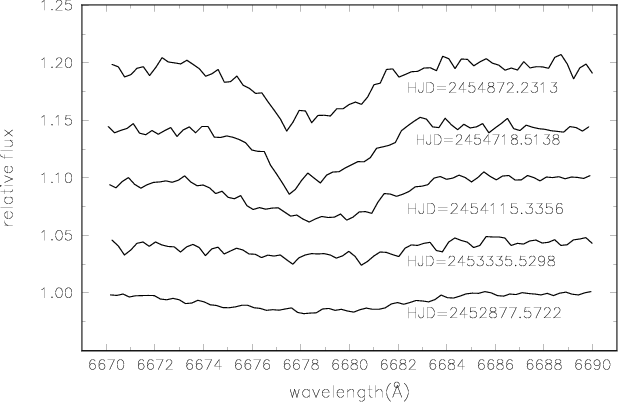
the strength of the H![]() emission gradually declined and the shape
of the H
emission gradually declined and the shape
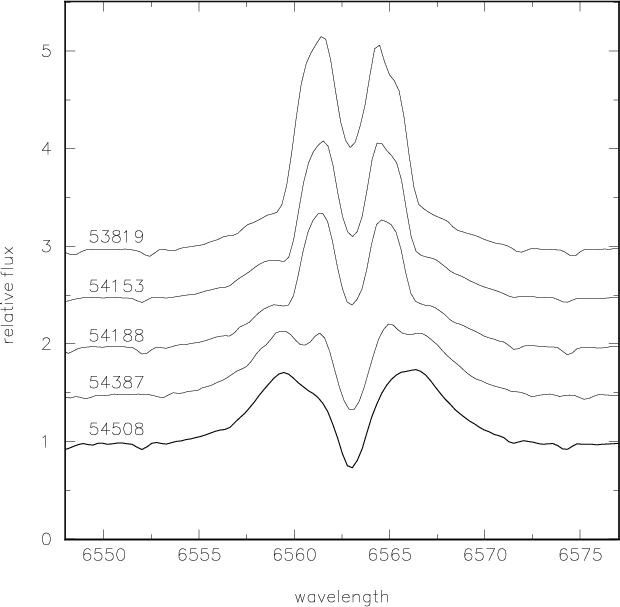
of the H![]() profile underwent notable changes. Typical examples
for several distinct stages are shown in Fig. 1, and the whole
development of a new shell and metallic-shell phase is shown as a
gray-scale representation of all usable H
profile underwent notable changes. Typical examples
for several distinct stages are shown in Fig. 1, and the whole
development of a new shell and metallic-shell phase is shown as a
gray-scale representation of all usable H![]() profiles in Fig. 2.
profiles in Fig. 2.
![\begin{figure}
\par\includegraphics[width=8cm,clip]{13885fg1.EPS}
\end{figure}](/articles/aa/full_html/2010/08/aa13885-09/img25.png)
|
Figure 1:
Comparison of H |
| Open with DEXTER | |
![\begin{figure}
\par\includegraphics[width=9cm]{13885fg2.EPS}
\vspace*{-2mm}
\end{figure}](/articles/aa/full_html/2010/08/aa13885-09/img26.png)
|
Figure 2:
A complete series of our H |
| Open with DEXTER | |
The fading of the H![]() emission was accompanied by a light decrease
in the J, H, K, and L IR photometric bands that started
around JD 2451500 (Taranova et al. 2008). This clearly corresponds to
the gradual development of the hydrogen shell spectrum according to our
spectra - see also Tanaka et al. (2007).
Emission has been slowly fading from JD 2453000 until now, when its peak intensity
represents only about 30% of the intensity seen in our earliest
spectra. During the transition from a single-peaked to double-peaked emission,
there is some time interval when the H
emission was accompanied by a light decrease
in the J, H, K, and L IR photometric bands that started
around JD 2451500 (Taranova et al. 2008). This clearly corresponds to
the gradual development of the hydrogen shell spectrum according to our
spectra - see also Tanaka et al. (2007).
Emission has been slowly fading from JD 2453000 until now, when its peak intensity
represents only about 30% of the intensity seen in our earliest
spectra. During the transition from a single-peaked to double-peaked emission,
there is some time interval when the H![]() profile has
a characteristic wine-bottle shape.
The occasional presence of additional absorption components has been already noted by
Iliev et al. (2007) or Tanaka et al. (2007) and is typical of all recorded
shell phases of BU Tau. Besides the occasional presence of one or more additional
absorptions, extended red emission wings are seen on some H
profile has
a characteristic wine-bottle shape.
The occasional presence of additional absorption components has been already noted by
Iliev et al. (2007) or Tanaka et al. (2007) and is typical of all recorded
shell phases of BU Tau. Besides the occasional presence of one or more additional
absorptions, extended red emission wings are seen on some H![]() profiles.
This makes the emission wings asymmetric and hard to measure for RV.
We also note that all double-peaked profiles recorded prior to
about JD 24540000 always have a red peak stronger than the violet one.
Figure 2 shows that the width of the H
profiles.
This makes the emission wings asymmetric and hard to measure for RV.
We also note that all double-peaked profiles recorded prior to
about JD 24540000 always have a red peak stronger than the violet one.
Figure 2 shows that the width of the H![]() emission has remained
more or less constant over the whole time interval covered by our observations.
The same figure also shows that the metallic shell phase appeared rather abruptly.
emission has remained
more or less constant over the whole time interval covered by our observations.
The same figure also shows that the metallic shell phase appeared rather abruptly.
Figure 3 shows the gradual development of the He I 6678 Å line profile. It illustrates well how shallow the line is at the beginning of a new shell phase. A very interesting finding is that, even for the B8 star, a presumably photospheric He I line can develop a shell component. The profile clearly gets stronger and narrower as the hydrogen shell line gets deeper. The additional absorption at the blue wing of the line seen on more recent spectra is the Fe II 6677.305 Å shell line.
3 Radial-velocity changes
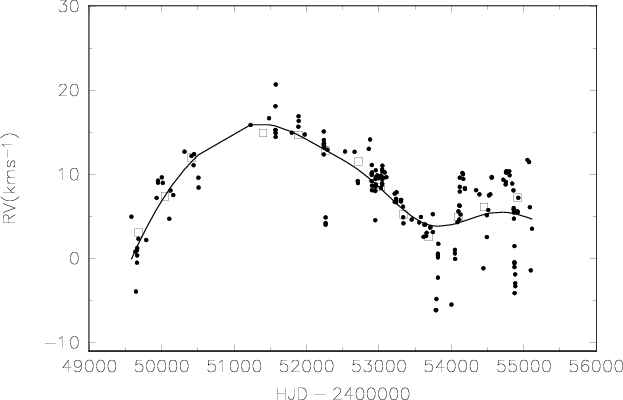
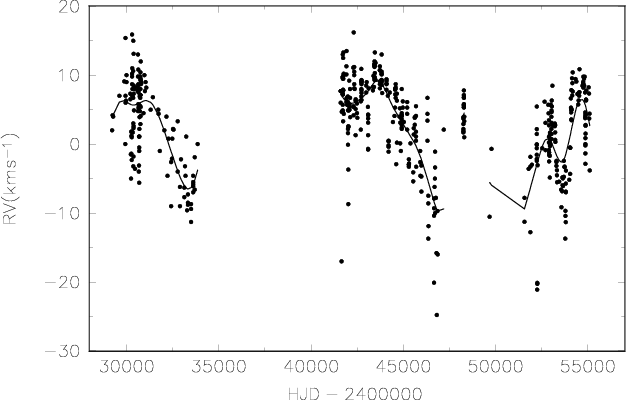
Figures 4 and 5 are the time plots of the measured RVs
vs. time for the H![]() emission wings and the absorption core. In the later,
we also included all shell RVs used and published by
Katahira et al. (1996b) and Rivinius et al. (2006).
One can see systematic RV changes on at least two distinct time scales:
a smooth change on a longer time scale and overlapping more rapid changes,
especially the occasional steep decreases in RV.
emission wings and the absorption core. In the later,
we also included all shell RVs used and published by
Katahira et al. (1996b) and Rivinius et al. (2006).
One can see systematic RV changes on at least two distinct time scales:
a smooth change on a longer time scale and overlapping more rapid changes,
especially the occasional steep decreases in RV.
|
Figure 3: Selected He I 6678 Å line profiles, ordered in time, with corresponding HJDs. |
| Open with DEXTER | |
|
Figure 4:
Measured RVs of the H |
| Open with DEXTER | |
|
Figure 5:
Measured H |
| Open with DEXTER | |
![\begin{figure}
\par\resizebox{9cm}{!}{\includegraphics{13885fg6.EPS}}\\ [5mm]
\resizebox{9cm}{!}{\includegraphics{13885fg7.EPS}}
\vspace*{-2mm}\end{figure}](/articles/aa/full_html/2010/08/aa13885-09/img30.png)
|
Figure 6:
A comparison of two pairs of the H |
| Open with DEXTER | |
Considering the uncertainties in accurate RV measurements
combined with the fact that the full amplitude of the changes
is low, it was deemed useful
to convince readers that the RV changes are not only a result of
changing asymmetry of the profiles, but they also represent a real shift of
the whole line. To this end, we compare in Fig. 6
two pairs of the H![]() line profiles obtained near the local RV extrema.
The upper pair comes from the beginning of a new shell phase and the bottom
one from a more recent time when a weaker emission and deeper shell cores
are present in the profiles (note a large difference in the
flux scale of the two plots).
The RV shift of the whole emission and absorption core is seen beyond any doubt.
We, therefore, conclude that our RV measurements reflect
real RV variations of BU Tau.
line profiles obtained near the local RV extrema.
The upper pair comes from the beginning of a new shell phase and the bottom
one from a more recent time when a weaker emission and deeper shell cores
are present in the profiles (note a large difference in the
flux scale of the two plots).
The RV shift of the whole emission and absorption core is seen beyond any doubt.
We, therefore, conclude that our RV measurements reflect
real RV variations of BU Tau.
In accordance with Katahira et al. (1996b), we find that the evolution of the emission episode is accompanied by long-term RV changes that need to be removed prior to a search for possible periodic RV changes. To also make this step as objective as possible, we used two different procedures.
One is that we smoothed the long-term changes using the program HEC13,
written by PH and based on a smoothing technique developed
by Vondrák (1977,1969)![]() .
For both emission and absorption RVs, optimal smoothings were obtained
for the smoothing parameter
.
For both emission and absorption RVs, optimal smoothings were obtained
for the smoothing parameter
![]() fitted through 200-d
normals. (Inspecting the time plots of RVs, we identified
fitted through 200-d
normals. (Inspecting the time plots of RVs, we identified ![]() 200 days as a time scale on which more rapid changes were observed, and this
was the reason for the choice of 200-d normals. We have verified,
however, that the result of smoothing is not sensitive to the
particular choice of the averaging interval for the smoothing within
reasonable limits).
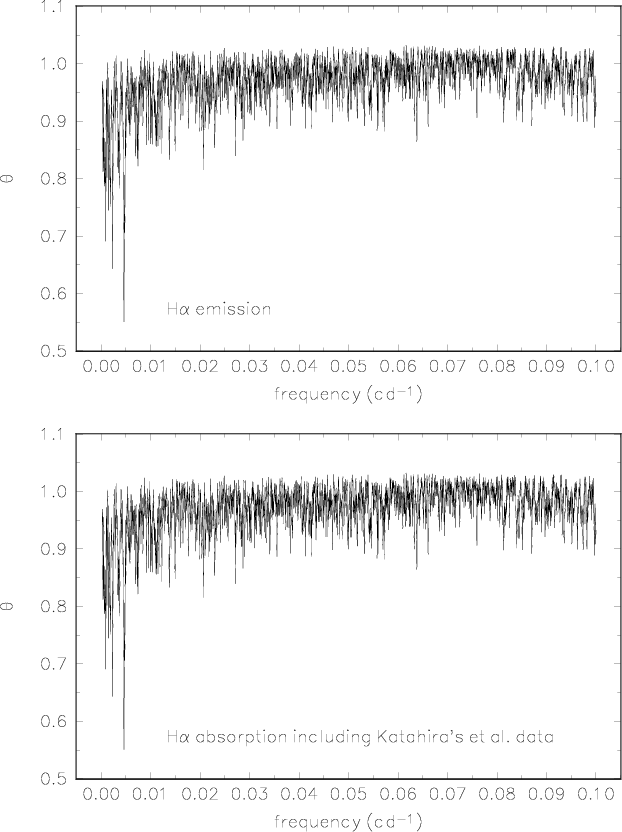
The RV residuals from the smoothing were subjected to a period search
based on the Stellingwerf (1978) PDM technique over a period range
from 5000 down to 0.05 d. The dominant frequency found in both searches
was 0.004587 c d-1 and its integer submultiples. The one-day aliases
were largely supressed thanks to having data from observatories, that have
a large difference in their local time,
producing much shallower minima in the
200 days as a time scale on which more rapid changes were observed, and this
was the reason for the choice of 200-d normals. We have verified,
however, that the result of smoothing is not sensitive to the
particular choice of the averaging interval for the smoothing within
reasonable limits).
The RV residuals from the smoothing were subjected to a period search
based on the Stellingwerf (1978) PDM technique over a period range
from 5000 down to 0.05 d. The dominant frequency found in both searches
was 0.004587 c d-1 and its integer submultiples. The one-day aliases
were largely supressed thanks to having data from observatories, that have
a large difference in their local time,
producing much shallower minima in the ![]() statistics (
statistics (![]() 0.75-0.82) and scattered phase diagrams.
To make the diagrams readable, we show the corresponding
0.75-0.82) and scattered phase diagrams.
To make the diagrams readable, we show the corresponding
![]() statistics in Fig. 7 for the emission (top) and
absorption (bottom) RVs only for a limited frequency interval down to
0.1 c d-1. The result seems to confirm the 218-d periodicity
discovered by Katahira et al. (1996b).
statistics in Fig. 7 for the emission (top) and
absorption (bottom) RVs only for a limited frequency interval down to
0.1 c d-1. The result seems to confirm the 218-d periodicity
discovered by Katahira et al. (1996b).
|
Figure 7:
Stellingwerf (1978) PDM |
| Open with DEXTER | |
|
Figure 8:
Orbital RV curves of the H |
| Open with DEXTER | |
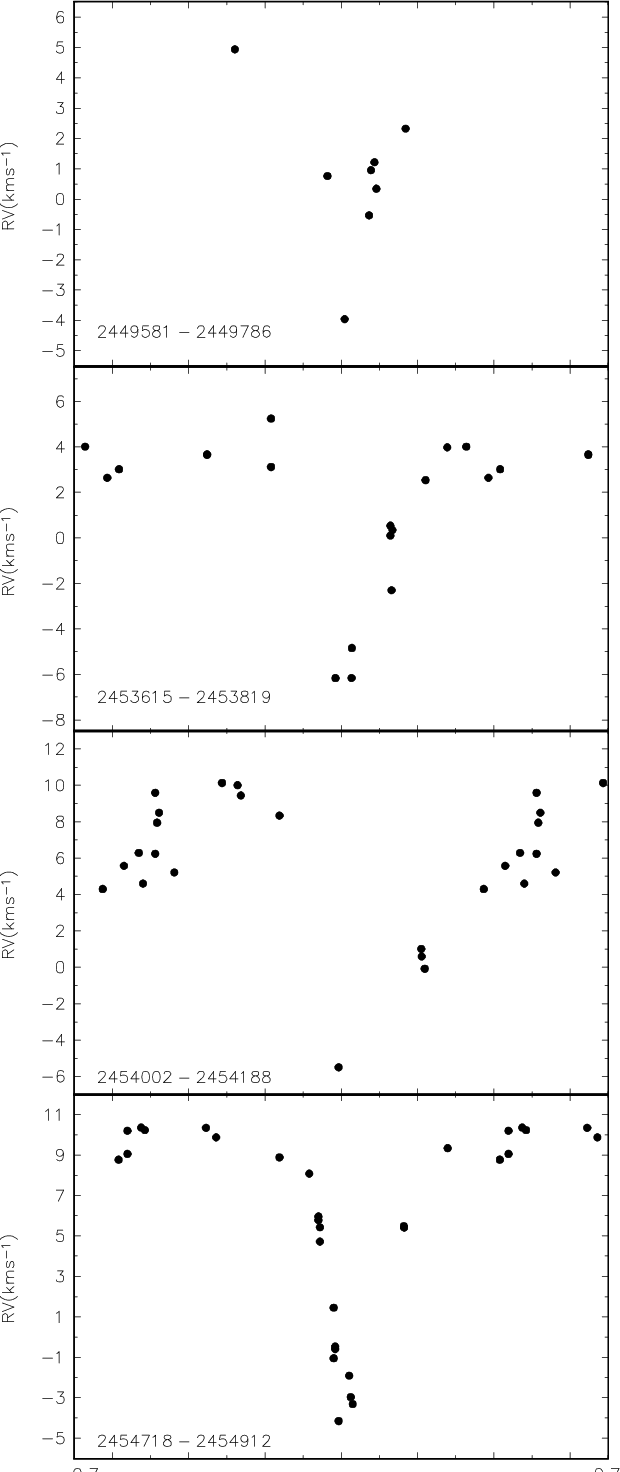
As another demonstration that the 218-d period is real, we show phase plots in Fig. 8 for the original RVs (without prewhitening for the long-term changes) for several subsets of data covering time intervals no longer than one year. Clearly similar RV curves, with sharp minima, rather flat maxima, and a mutual phase coherence, are seen in all cases. The first subset is based solely on the RVs from the Ondrejov spectra secured with Reticon detector, which were already investigated by Rivinius et al. (2006).
4 BU Tau as a spectroscopic binary
Our findings, and especially the fact that the H![]() Balmer
emission line moves in RV as a whole in spite of very large secular
changes of its strength, indicate that BU Tau is indeed a single-line
spectroscopic binary that moves in a highly eccentric orbit.
We therefore used the program SPEL (written by the late Dr. Jirí Horn
and never published) to derive the orbital elements.
For comparison with Katahira et al. (1996b), we first derived orbital elements
for Balmer absorption RVs, using the data from their study,
RVs published by Rivinius et al. (2006), and our own H
Balmer
emission line moves in RV as a whole in spite of very large secular
changes of its strength, indicate that BU Tau is indeed a single-line
spectroscopic binary that moves in a highly eccentric orbit.
We therefore used the program SPEL (written by the late Dr. Jirí Horn
and never published) to derive the orbital elements.
For comparison with Katahira et al. (1996b), we first derived orbital elements
for Balmer absorption RVs, using the data from their study,
RVs published by Rivinius et al. (2006), and our own H![]() absorption RVs, prewhitened
with HEC13 as shown in Fig. 5. The resulting orbital
elements are given as solution 1 in Table 2 and the corresponding
phase plots are shown in Fig. 9. For more clarity, we plot there
the photographic RVs, Heros RVs from Rivinius et al. (2006), and our H
absorption RVs, prewhitened
with HEC13 as shown in Fig. 5. The resulting orbital
elements are given as solution 1 in Table 2 and the corresponding
phase plots are shown in Fig. 9. For more clarity, we plot there
the photographic RVs, Heros RVs from Rivinius et al. (2006), and our H![]() absorption
RVs in three separate panels. Although Rivinius et al. (2006) write
that the suspected binary nature of BU Tau could not be confirmed on the basis
of their data, their RVs also nicely follow the 218-d period. This constitutes
yet another support for the reality of this period. Our solution 1 agrees well
with the result of Katahira et al. (1996b).
absorption
RVs in three separate panels. Although Rivinius et al. (2006) write
that the suspected binary nature of BU Tau could not be confirmed on the basis
of their data, their RVs also nicely follow the 218-d period. This constitutes
yet another support for the reality of this period. Our solution 1 agrees well
with the result of Katahira et al. (1996b).
Next, we analyzed the emission RVs that we consider as most realistically
describing the true orbital motion. To see how sensitive
the result is to the manner of prewhitening the data we derived the elements
not only for the RVs prewhitened with the help of HEC13 (see above) but
also from the original data. To this end, we divided the data into
subsets spanning no more than one year and allowed SPEL to derive separate
![]() velocities for individual data subsets.
The results are summarized in Table 2, and
the corresponding RV curves compared in Fig. 10.
velocities for individual data subsets.
The results are summarized in Table 2, and
the corresponding RV curves compared in Fig. 10.
![\begin{figure}
\par\rotatebox{-180}{\includegraphics[width=9cm]{13885fg11.EPS}}
\vspace*{-2mm}\end{figure}](/articles/aa/full_html/2010/08/aa13885-09/img35.png)
|
Figure 9: Top: the phase plots of all available Balmer absorption RVs, prewhitened for the long-term RV variations with HEC13 (as shown in Fig. 5). Elements from solution 1 of Table 2 were used, with phase zero at minimum RV. For clarity, we show three different data subsets separately: Top panel: photographic RVs from Katahira et al. (1996b); Central panel: RVs from electronic Heros spectra published by Rivinius et al. (2006); Bottom panel: RVs from electronic spectra used in this paper. |
| Open with DEXTER | |
Table 2: Several sets of orbital elements.
![\begin{figure}
\par\includegraphics[width=8cm,clip]{13885fg12.eps}\\ [5mm]
\includegraphics[width=8cm,clip]{13885fg13.eps}
\vspace*{-2mm}
\end{figure}](/articles/aa/full_html/2010/08/aa13885-09/img40.png)
|
Figure 10:
The orbital RV curves of BU Tau based on the H |
| Open with DEXTER | |
The inspection of Fig. 10 shows that even the H![]() emission-wing RVs
are indeed indicative of an orbit with high eccentricity but that there is
also an alternative possibility that the observed deep RV minimum could
be a consequence of some unspecified effect of circumstellar matter,
reminiscent of ``an inverse rotational or Rossiter effect''. In this case,
the true orbit could essentially be circular. To this end, we derived
yet another, a circular-orbit solution for the H
emission-wing RVs
are indeed indicative of an orbit with high eccentricity but that there is
also an alternative possibility that the observed deep RV minimum could
be a consequence of some unspecified effect of circumstellar matter,
reminiscent of ``an inverse rotational or Rossiter effect''. In this case,
the true orbit could essentially be circular. To this end, we derived
yet another, a circular-orbit solution for the H![]() emission RVs prewhitened
for long-term changes via HEC13, omitting all RVs from the phase interval
around phase zero with the most negative RVs. This resulted in
the following elements:
emission RVs prewhitened
for long-term changes via HEC13, omitting all RVs from the phase interval
around phase zero with the most negative RVs. This resulted in
the following elements:
![]() ,
,
![]() ,
,
![]() km s-1.
km s-1.
Using the eliptical-orbit elements for the H![]() emission RVs
from Table 2, we estimated the basic properties of the binary
from the mass function
f(m)=0.00165
emission RVs
from Table 2, we estimated the basic properties of the binary
from the mass function
f(m)=0.00165 ![]() for several plausible orbital
inclinations, assuming a normal mass of the primary corresponding to
its spectral type after Harmanec (1988) to be M1=2.9
for several plausible orbital
inclinations, assuming a normal mass of the primary corresponding to
its spectral type after Harmanec (1988) to be M1=2.9 ![]() .
.
The results of Table 3 show that the binary properties, especially the low mass ratio, are quite similar to other binaries discovered so far with Be primaries. For the estimates, we only considered higher orbital inclinations since BU Tau is one of the cases of an inverse correlation between the brightness and emission-line strength, which indicates that we see the system roughly equator-on - cf, e.g., Harmanec (1983).
If we adopt the distance to Pleiades d=138 pc after Groenewegen et al. (2007),
we estimate that the projected angular distance of the binary components
should be
![]() ,
dropping down to
,
dropping down to
![]() at
periastron. This angular separation is certainly within reach
of existing large optical interferometers. The only
problem is the luminosity ratio primary/secondary.
If the secondary would be a normal late M dwarf corresponding to its mass,
it would be fainter in the visual region by more than 10 mag
and the only chance to search for it would be in the far IR region, where,
however, the IR excess from the Be envelope can complicate the
detection. However - if it were a hot subdwarf, similar to the one found for another Be binary
at
periastron. This angular separation is certainly within reach
of existing large optical interferometers. The only
problem is the luminosity ratio primary/secondary.
If the secondary would be a normal late M dwarf corresponding to its mass,
it would be fainter in the visual region by more than 10 mag
and the only chance to search for it would be in the far IR region, where,
however, the IR excess from the Be envelope can complicate the
detection. However - if it were a hot subdwarf, similar to the one found for another Be binary ![]() Per by Gies et al. (1998)
- it might be observable in the optical region since the absolute
visual magnitude of BU Tau is fainter for some 2 mag
than for the
Per by Gies et al. (1998)
- it might be observable in the optical region since the absolute
visual magnitude of BU Tau is fainter for some 2 mag
than for the ![]() Per B0.5e primary. Finally, a cool
Roche-lobe filling secondary seems improbable since it would probably
produce binary eclipses.
Per B0.5e primary. Finally, a cool
Roche-lobe filling secondary seems improbable since it would probably
produce binary eclipses.
In any case, attempts to resolve the 218-d binary system with some large interferometer are very desirable since a visual orbit would help not only to estimate the true orbital inclination but also to clarify whether the orbit has a high eccentricity or is nearly circular.
5 Comments on Hirata's model
Table 3:
Basic physical properties of BU Tau as a single-line binary based on elliptical-orbit solution for the H![]() emission RVs - (cf.
Table 2).
emission RVs - (cf.
Table 2).
![\begin{figure}
\par\includegraphics[width=9cm,clip]{13885fg14.EPS}
\vspace*{8mm}
\end{figure}](/articles/aa/full_html/2010/08/aa13885-09/img48.png)
|
Figure 11:
A time development of the FWHM (in Å) of the H |
| Open with DEXTER | |
|
Figure 12:
A series of the H |
| Open with DEXTER | |
We have postponed a detailed study of the long-term changes for a
later work (Iliev et al. in prep.), but we wish to comment briefly on
the hypothesis put forward recently by Hirata (2007).
He obtained systematic spectroscopy and polarimetry
of BU Tau from 1974 to 2003 and finds a change in the polarization
angle from about 60![]() to 130
to 130![]() over that time interval.
He interprets this change as evidence of the precession of
the circumstellar disk that is responsible for the observed H
over that time interval.
He interprets this change as evidence of the precession of
the circumstellar disk that is responsible for the observed H![]() emission.
He further argues that also the change in the H
emission.
He further argues that also the change in the H![]() profiles from a weak
double emission with a strong central absorption core to a strong
emission with a wine-bottle shape indicates that the disk was first
seen more or less edge-on and later more face-on. Tanaka et al. (2007)
studied the spectra of BU Tau from Nov. 2005 until April 2007, which cover
the period of a formation of the new shell phase. They argue that
a new disk was formed in the equatorial plane of the B star while
the old disk was decaying but still present. According to their
interpretation, the old disk was precessing in space as suggested
by Hirata (2007). Our spectra cover a much longer time interval,
including the one studied by Tanaka et al. (2007), and as Fig. 2
shows, the change of the H
profiles from a weak
double emission with a strong central absorption core to a strong
emission with a wine-bottle shape indicates that the disk was first
seen more or less edge-on and later more face-on. Tanaka et al. (2007)
studied the spectra of BU Tau from Nov. 2005 until April 2007, which cover
the period of a formation of the new shell phase. They argue that
a new disk was formed in the equatorial plane of the B star while
the old disk was decaying but still present. According to their
interpretation, the old disk was precessing in space as suggested
by Hirata (2007). Our spectra cover a much longer time interval,
including the one studied by Tanaka et al. (2007), and as Fig. 2
shows, the change of the H![]() profile was smooth. We thus measured
the full width at half maximum (FWHM) of a representative selection
of our H
profile was smooth. We thus measured
the full width at half maximum (FWHM) of a representative selection
of our H![]() emission-line profiles and the variation in FWHM with time is shown
in Fig. 11. It was already demonstrated by Struve (1931) in his
first model of Be stars as rapidly rotating objects that there is a clear
correlation between the width of presumably photospheric He I
lines and the width of the Balmer emission lines, which is preserved
during the long-term changes. This correlation has been confirmed by a number
of later studies - see, e.g., Fig. 5 of Slettebak (1979). One would
therefore expect that, if the appearance of a new shell phase
of BU Tau is primarily a consequence of a geometrical effect,
namely a gradual precession of a flat disk that becomes
to be seen equator-on, the FWHM should gradually grow as
the new shell phase is approaching.
In contrast, Fig. 11 shows that the FWHM of H
emission-line profiles and the variation in FWHM with time is shown
in Fig. 11. It was already demonstrated by Struve (1931) in his
first model of Be stars as rapidly rotating objects that there is a clear
correlation between the width of presumably photospheric He I
lines and the width of the Balmer emission lines, which is preserved
during the long-term changes. This correlation has been confirmed by a number
of later studies - see, e.g., Fig. 5 of Slettebak (1979). One would
therefore expect that, if the appearance of a new shell phase
of BU Tau is primarily a consequence of a geometrical effect,
namely a gradual precession of a flat disk that becomes
to be seen equator-on, the FWHM should gradually grow as
the new shell phase is approaching.
In contrast, Fig. 11 shows that the FWHM of H![]() was
slowly decreasing during the last 15 years. Its dramatic increase
is related to the formation of a new envelope, which our spectra
clearly confirm - see Fig. 12. The apparent discontinous
increase in the FWHM occurs at the moment when the strength of the
broader emission from the new envelope rises to a half of the
peak intensity of the original emission. All this indicates that
the observed variations are primarily due to physical changes
in the circumstellar matter and cannot be reduced to a simple
geometrical cause - a precession of the original gaseous disk.
There has been a rather widespread tendency in recent years to intepret
the presence of shell absorption lines as evidence of an equator-on view,
since many investigators are picturing the Be star disk as a flat structure
located at the stellar equator with a (rather small) opening angle
(Bjorkman & Cassinelli 1993; Waters 1986; Hanuschik 1996,1995). It is true that this model
can lead to theoretical Balmer profiles similar to the observed ones,
see, e.g., the 3D radiative line transfer models by Hummel (1994).
One should be aware, however, that there is no unique proof of a
specific geometry on the level of various simplifications of current models.
For instance, Höflich (1987, 1988) succeeded in modeling several
Balmer emission-line profiles of particular Be stars with his
model consisting of an NLTE atmosphere and a spherical envelope.
It is then conceivable that strong shell lines could also develop in
the spectrum of a Be star seen more or less pole-on in situations where
a very extended spheroidal envelope forms around it.
Similarly, it might be worth considering whether the asymmetry detected
by the gradual change in the polarimetric angle is indeed caused by
the precession of a flat disk or by some other effect,
e.g. by a slowly revolving elongated (non-axisymmetric) disk.
was
slowly decreasing during the last 15 years. Its dramatic increase
is related to the formation of a new envelope, which our spectra
clearly confirm - see Fig. 12. The apparent discontinous
increase in the FWHM occurs at the moment when the strength of the
broader emission from the new envelope rises to a half of the
peak intensity of the original emission. All this indicates that
the observed variations are primarily due to physical changes
in the circumstellar matter and cannot be reduced to a simple
geometrical cause - a precession of the original gaseous disk.
There has been a rather widespread tendency in recent years to intepret
the presence of shell absorption lines as evidence of an equator-on view,
since many investigators are picturing the Be star disk as a flat structure
located at the stellar equator with a (rather small) opening angle
(Bjorkman & Cassinelli 1993; Waters 1986; Hanuschik 1996,1995). It is true that this model
can lead to theoretical Balmer profiles similar to the observed ones,
see, e.g., the 3D radiative line transfer models by Hummel (1994).
One should be aware, however, that there is no unique proof of a
specific geometry on the level of various simplifications of current models.
For instance, Höflich (1987, 1988) succeeded in modeling several
Balmer emission-line profiles of particular Be stars with his
model consisting of an NLTE atmosphere and a spherical envelope.
It is then conceivable that strong shell lines could also develop in
the spectrum of a Be star seen more or less pole-on in situations where
a very extended spheroidal envelope forms around it.
Similarly, it might be worth considering whether the asymmetry detected
by the gradual change in the polarimetric angle is indeed caused by
the precession of a flat disk or by some other effect,
e.g. by a slowly revolving elongated (non-axisymmetric) disk.
We profited from the use of the program SPEL, written by our late colleague Dr. Jirí Horn. We acknowledge the use of the publicly available Elodie spectra from the electronic archive of the Haute Provence Observatory. Our thanks go to Drs. M. Ceniga, P. Hadrava, A. Kawka, D. Korcáková, J. Krticka, M. Netolický, S. Stefl, and V. Votruba, who secured some of the Ondrejov spectrograms used in this study. We also thank the referee, Dr. A.F. Gulliver, for his comments on the first version of the paper. The research of the Czech authors was supported by the grant 205/06/0304 and 205/08/H005 of the Czech Science Foundation and also from the Research Programs MSM0021620860 Physical study of objects and processes in the solar system and in astrophysics of the Ministry of Education of the Czech Republic, and AV0Z10030501 of the Academy of Sciences of the Czech Republic. The research of PK was supported by the ESA PECS grant 98058. In its final stages, the research of J.N., P.H., and M.W. was also supported by the grant P209/10/0715 of the Czech Science Foundation. We acknowledge the use of the electronic database from the CDS, Strasbourg and electronic bibliography maintained by the NASA/ADS system.
Appendix A: Overview of available spectroscopic observations
Here, we provide some details on the spectra used in this study and listed in Table 1 and on their reduction:
- 1.
- Ondrejov spectra: All 101 electronic spectrograms were
obtained in the coudé focus of the 2.0-m reflector and have a linear
dispersion of 17.2 Å mm-1 and a 2-pixel resolution 12600 (11-12 km s-1
per pixel). The first 35 spectra were taken with a Reticon 1872RF linear
detector and cover a spectral region from 6300 to 6730 Å.
Complete reductions of these spectrograms were carried out by JN with
the program SPEFO, written by the late Dr. J. Horn and further developed by
Dr. P. Skoda and more recently by Mr. J. Krpata - see Horn et al. (1996) and
Skoda (1996). The remaining spectra were secured with an SITe-5
 CCD detector
and cover a slightly longer wavelength interval 6260-6760 Å.
Their initial reductions (bias subtraction, flatfielding, creation of 1-D
images, and wavelength calibration) were carried out by MS in IRAF.
CCD detector
and cover a slightly longer wavelength interval 6260-6760 Å.
Their initial reductions (bias subtraction, flatfielding, creation of 1-D
images, and wavelength calibration) were carried out by MS in IRAF.
- 2.
- DAO spectra: These spectrograms were obtained in the coudé
focus of the 1.22-m reflector of the Dominion Astrophysical Observatory
by SY, who also carried out their initial reductions (bias subtraction,
flatfielding, and creation of 1-D images). Their wavelength calibration was
carried out by JN in SPEFO. The spectra were obtained
with the 32121H spectrograph with the IS32R image slicer. The
detectors were UBC-1
 CCD for data before May 2005 and
SITe-4
CCD for data before May 2005 and
SITe-4
 CCD for data after May 2005. They
cover a wavelength region from 6150 to 6750 Å, have a linear dispersion of 10 Å mm-1 and 2-pixel resolution of 21700 (
CCD for data after May 2005. They
cover a wavelength region from 6150 to 6750 Å, have a linear dispersion of 10 Å mm-1 and 2-pixel resolution of 21700 ( 7 km s-1 per pixel).
- 3.
- OHP spectra: The public ELODIE archive of the Haute Provence
Observatory (Moultaka et al. 2004) contains 30 spectra listed as BU Tau, but some
of them are actually spectra of 27 Tau. We were able to recover 21 usable
spectra. For the purpose of this study, we extracted, rectified, and measured
only the red parts of these spectrograms.
![\begin{figure}
\par\includegraphics[width=7.3cm,clip]{13885fg16.EPS}\\
\includegraphics[width=7.3cm,clip]{13885fg17.EPS}
\end{figure}](/articles/aa/full_html/2010/08/aa13885-09/Timg53.png)
Figure A.1: A comparison of independent RV measurements of the steep H
 emission wings ( upper panel) and shell core absorption ( bottom panel).
Open with DEXTER - 4.
- Rozhen spectra: All 23 spectra from Rozhen observatory were
obtained in the coudé spectrograph of the 2-m RCC telescope. A CCD camera
Photometrics AT200 with SITe SI003AB
 chip was used. The spectrograph
was used in a configuration providing high-resolution spectra suitable
for revealing fine details and the structure of the spectral lines.
A Bausch & Lomb 632/22.3 grating was used in its 2nd order, giving
a linear dispersion of 4.2 A/mm with 2-pixel resolution of 33 000
(4.5 km s-1 per pixel). Wavelength coverage is about 100 Å around H.
The initial reduction (bias subtraction, flatfielding, creation of 1-D
images and wavelength calibration) was carried out by LI in MIDAS.
chip was used. The spectrograph
was used in a configuration providing high-resolution spectra suitable
for revealing fine details and the structure of the spectral lines.
A Bausch & Lomb 632/22.3 grating was used in its 2nd order, giving
a linear dispersion of 4.2 A/mm with 2-pixel resolution of 33 000
(4.5 km s-1 per pixel). Wavelength coverage is about 100 Å around H.
The initial reduction (bias subtraction, flatfielding, creation of 1-D
images and wavelength calibration) was carried out by LI in MIDAS.
Table A.1: Radial velocities of the H
emission wings and shell absorption
core obtained via averaging the independent measurements by
J. Nemravová and P. Harmanec; DAO = Dominion Astrophysical Observatory,
Victoria; ROZ = Rozhen National Observatory; OND = Ondrejov Observatory;
LIS = IGeoE-Lisbon; OHP = Haute Provence Observatory. - 5.
- Lisboa spectra: these 4 CCD spectra were obtained with the IGeoE 0.356-m SC telescope working at F/11. The spectrograph is a Littrow LHIRESIII with a 2400 grooves per mm grating and a spectral resolution of about 14.000. The initial reduction (bias subtraction, flatfielding, creation of 1-D images, and wavelength calibration) of the spectra was made by JR.
A comparison of the two sets of independent RV measurements is shown in
Fig. A.1. In general, the agreement is good.
A formal regression between the measurements of PH and JN
was derived. Its slope is
![]() for the emission and
for the emission and
![]() for the absorption. For the absorption
line, it is conceivable that in specific cases one or the other measurer
was confused by a telluric line blended with the stellar
absorption core. For analysis, we used the mean RVs of the two independent
measurements. All our RVs with the corresponding HJDs of their
mid-exposures are provided in Table A.1.
for the absorption. For the absorption
line, it is conceivable that in specific cases one or the other measurer
was confused by a telluric line blended with the stellar
absorption core. For analysis, we used the mean RVs of the two independent
measurements. All our RVs with the corresponding HJDs of their
mid-exposures are provided in Table A.1.
References
- Ballereau, D., Chauville, J., & Mekkas, A. 1988, A&AS, 75, 139 [NASA ADS] [Google Scholar]
- Bjorkman, J. E., & Cassinelli, J. P. 1993, ApJ, 409, 429 [NASA ADS] [CrossRef] [Google Scholar]
- Bozic, H., Harmanec, P., Horn, J., et al. 1995, A&A, 304, 235 [NASA ADS] [Google Scholar]
- Doazan, V., Bourdonneau, B., & Thomas, R. N. 1988, A&A, 205, L11 [NASA ADS] [Google Scholar]
- Gies, D. R., McKibben, W. P., Kelton, P. W., Opal, C. B., & Sawyer, S. 1990, AJ, 100, 1601 [NASA ADS] [CrossRef] [Google Scholar]
- Gies, D. R., Bagnuolo, Jr., W. G., Ferrara, E. C., et al. 1998, ApJ, 493, 440 [NASA ADS] [CrossRef] [Google Scholar]
- Groenewegen, M. A. T., Decin, L., Salaris, M., et al. 2007, A&A, 463, 579 [NASA ADS] [CrossRef] [EDP Sciences] [Google Scholar]
- Gulliver, A. F. 1977, ApJS, 35, 441 [NASA ADS] [CrossRef] [Google Scholar]
- Hanuschik, R. W. 1995, Be Star Newsletter, 30, 17 [NASA ADS] [Google Scholar]
- Hanuschik, R. W. 1996, A&A, 308, 170 [NASA ADS] [Google Scholar]
- Harmanec, P. 1982, in Be Stars, IAU Symp., 98, 279 [Google Scholar]
- Harmanec, P. 1983, Hvar Observatory Bulletin, 7, 55 [Google Scholar]
- Harmanec, P. 1988, Bull. astr. Inst. Czechosl, 39, 329 [Google Scholar]
- Harmanec, P., Habuda, P., Stefl, S., et al. 2000, A&A, 364, L85 [NASA ADS] [Google Scholar]
- Hirata, R. 1995, PASJ, 47, 195 [NASA ADS] [Google Scholar]
- Hirata, R. 2007, in Active OB-Stars: Laboratories for Stellare and Circumstellar Physics, ed. A. T. Okazaki, S. P. Owocki, & S. Stefl, ASP Conf. Ser., 361, 267 [Google Scholar]
- Hirata, R., & Kogure, T. 1976, PASJ, 28, 509 [NASA ADS] [Google Scholar]
- Hirata, R., & Kogure, T. 1977, PASJ, 29, 477 [NASA ADS] [Google Scholar]
- Horn, J., Kubát, J., Harmanec, P., et al. 1996, A&A, 309, 521 [NASA ADS] [Google Scholar]
- Hummel, W. 1994, A&A, 289, 458 [NASA ADS] [Google Scholar]
- Iliev, L., Kovachev, B., & Ruusalepp, M. 1988, Information Bulletin on Variable Stars, 3204, 1 [NASA ADS] [Google Scholar]
- Iliev, L., Koubský, P., Kubát, J., et al. 2007, in Active OB-Stars: Laboratories for Stellare and Circumstellar Physics, ed. A. T. Okazaki, S. P. Owocki, & S. Stefl, ASP Conf. Ser., 361, 440 [Google Scholar]
- Katahira, J.-I., Hirata, R., Ito, M., et al. 1996a, in Rev. Mex. Astron. Astrofis., ed. V. Niemela, N. Morrell, P. Pismis, & S. Torres-Peimbert, Rev. Mex. Astron. Astrofis. Conf. Ser. 27, 5, 114 [Google Scholar]
- Katahira, J.-I., Hirata, R., Ito, M., et al. 1996b, PASJ, 48, 317 [NASA ADS] [CrossRef] [Google Scholar]
- Koubský, P., Harmanec, P., Hubert, A. M., et al. 2000, A&A, 356, 913 [NASA ADS] [Google Scholar]
- Luthardt, R., & Menchenkova, E. V. 1994, A&A, 284, 118 [NASA ADS] [Google Scholar]
- McAlister, H. A., Hartkopf, W. I., Sowell, J. R., Dombrowski, E. G., & Franz, O. G. 1989, AJ, 97, 510 [NASA ADS] [CrossRef] [Google Scholar]
- Merrill, P. W. 1952, ApJ, 115, 145 [NASA ADS] [CrossRef] [Google Scholar]
- Miroshnichenko, A. S., Fabregat, J., Bjorkman, K. S., et al. 2001, A&A, 377, 485 [NASA ADS] [CrossRef] [EDP Sciences] [Google Scholar]
- Miroshnichenko, A. S., Bjorkman, K. S., & Krugov, V. D. 2002, PASP, 114, 1226 [NASA ADS] [CrossRef] [Google Scholar]
- Moultaka, J., Ilovaisky, S. A., Prugniel, P., et al. 2004, PASP, 116, 693 [NASA ADS] [CrossRef] [Google Scholar]
- Rivinius, T., Stefl, S., & Baade, D. 2006, A&A, 459, 137 [NASA ADS] [CrossRef] [EDP Sciences] [Google Scholar]
- Roberts, Jr., L. C., Turner, N. H., & ten Brummelaar, T. A. 2007, AJ, 133, 545 [NASA ADS] [CrossRef] [Google Scholar]
- Sharov, A. S., & Lyuty, V. M. 1976, in Be and Shell Stars, ed. A. Slettebak, IAU Symp., 70, 105 [Google Scholar]
- Sharov, A. S., & Lyutyj, V. M. 1992, AZh, 69, 544 [NASA ADS] [Google Scholar]
- Skoda, P. 1996, in Astronomical Data Analysis Software and Systems V, ASP Conf. Ser. 101, 187 [Google Scholar]
- Slettebak, A. 1979, Space Sci. Rev., 23, 541 [NASA ADS] [CrossRef] [Google Scholar]
- Stellingwerf, R. F. 1978, ApJ, 224, 953 [NASA ADS] [CrossRef] [Google Scholar]
- Struve, O. 1931, ApJ, 73, 94 [NASA ADS] [CrossRef] [Google Scholar]
- Struve, O., & Swings, P. 1943, ApJ, 97, 426 [NASA ADS] [CrossRef] [Google Scholar]
- Tanaka, K., Sadakane, K., Narusawa, S.-Y., et al. 2007, PASJ, 59, L35 [NASA ADS] [Google Scholar]
- Taranova, O., Shenavrin, V., & Nadjip, A. D. 2008, Peremennye Zvezdy Prilozhenie, 8, 6 [NASA ADS] [Google Scholar]
- Vondrák, J. 1969, Bull. Astron. Inst. Czechosl., 20, 349 [NASA ADS] [Google Scholar]
- Vondrák, J. 1977, Bull. Astron. Inst. Czechosl., 28, 84 [NASA ADS] [Google Scholar]
- Waters, L. B. F. M. 1986, A&A, 162, 121 [NASA ADS] [Google Scholar]
Footnotes
- ... stars
- Based on new spectral and photometric observations from the following observatories: Dominion Astrophysical Observatory, Herzberg Institute of Astrophysics, National Research Council of Canada, Haute Provence, IGeoE-Lisbon, Astronomical Institute AS CR Ondrejov, and Rozhen.
- ...
- The program HEC13 with brief instructions how to use it is available to interested users at http://astro.troja.mff.cuni.cz/ftp/hec/HEC13
All Tables
Table 1: Journal of new spectroscopic observations for BU Tau.
Table 2: Several sets of orbital elements.
Table 3:
Basic physical properties of BU Tau as a single-line binary based on elliptical-orbit solution for the H![]() emission RVs - (cf.
Table 2).
emission RVs - (cf.
Table 2).
Table A.1:
Radial velocities of the H![]() emission wings and shell absorption
core obtained via averaging the independent measurements by
J. Nemravová and P. Harmanec; DAO = Dominion Astrophysical Observatory,
Victoria; ROZ = Rozhen National Observatory; OND = Ondrejov Observatory;
LIS = IGeoE-Lisbon; OHP = Haute Provence Observatory.
emission wings and shell absorption
core obtained via averaging the independent measurements by
J. Nemravová and P. Harmanec; DAO = Dominion Astrophysical Observatory,
Victoria; ROZ = Rozhen National Observatory; OND = Ondrejov Observatory;
LIS = IGeoE-Lisbon; OHP = Haute Provence Observatory.
All Figures
|
|
Figure 1:
Comparison of H |
| Open with DEXTER | |
| In the text | |
|
|
Figure 2:
A complete series of our H |
| Open with DEXTER | |
| In the text | |
|
|
Figure 3: Selected He I 6678 Å line profiles, ordered in time, with corresponding HJDs. |
| Open with DEXTER | |
| In the text | |
|
|
Figure 4:
Measured RVs of the H |
| Open with DEXTER | |
| In the text | |
|
|
Figure 5:
Measured H |
| Open with DEXTER | |
| In the text | |
|
|
Figure 6:
A comparison of two pairs of the H |
| Open with DEXTER | |
| In the text | |
|
|
Figure 7:
Stellingwerf (1978) PDM |
| Open with DEXTER | |
| In the text | |
|
|
Figure 8:
Orbital RV curves of the H |
| Open with DEXTER | |
| In the text | |
|
|
Figure 9: Top: the phase plots of all available Balmer absorption RVs, prewhitened for the long-term RV variations with HEC13 (as shown in Fig. 5). Elements from solution 1 of Table 2 were used, with phase zero at minimum RV. For clarity, we show three different data subsets separately: Top panel: photographic RVs from Katahira et al. (1996b); Central panel: RVs from electronic Heros spectra published by Rivinius et al. (2006); Bottom panel: RVs from electronic spectra used in this paper. |
| Open with DEXTER | |
| In the text | |
|
|
Figure 10:
The orbital RV curves of BU Tau based on the H |
| Open with DEXTER | |
| In the text | |
|
|
Figure 11:
A time development of the FWHM (in Å) of the H |
| Open with DEXTER | |
| In the text | |
|
|
Figure 12:
A series of the H |
| Open with DEXTER | |
| In the text | |
![\begin{figure}
\par\includegraphics[width=7.3cm,clip]{13885fg16.EPS}\\
\includegraphics[width=7.3cm,clip]{13885fg17.EPS}
\end{figure}](/articles/aa/full_html/2010/08/aa13885-09/img53.png)
|
Figure A.1:
A comparison of independent RV measurements of the steep H |
| Open with DEXTER | |
| In the text | |
Copyright ESO 2010
Current usage metrics show cumulative count of Article Views (full-text article views including HTML views, PDF and ePub downloads, according to the available data) and Abstracts Views on Vision4Press platform.
Data correspond to usage on the plateform after 2015. The current usage metrics is available 48-96 hours after online publication and is updated daily on week days.
Initial download of the metrics may take a while.