| Issue |
A&A
Volume 516, June-July 2010
|
|
|---|---|---|
| Article Number | A36 | |
| Number of page(s) | 13 | |
| Section | Stellar structure and evolution | |
| DOI | https://doi.org/10.1051/0004-6361/200913758 | |
| Published online | 23 June 2010 | |
A self-consistent approach to the hard
and soft states of 4U 1705-44![[*]](/icons/foot_motif.png)
A. D'Aì1 - T. Di Salvo1 - D. Ballantyne2 - R. Iaria1 - N. R. Robba1 - A. Papitto3,4 - A. Riggio3,4 - L. Burderi3 - S. Piraino5,6 - A. Santangelo5 - G. Matt7 - M. Dovciak8 - V. Karas8
1 - Dipartimento di Scienze Fisiche ed Astronomiche, Università di
Palermo, Italy
2 - Center for Relativistic Astrophysics, School of Physics, Georgia
Institute of Technology, Atlanta, GA 30332, USA
3 - Università degli Studi di Cagliari, Dipartimento di Fisica, SP
Monserrato-Sestu, KM 0.7, 09042 Monserrato, Italy
4 - INAF - Osservatorio Astronomico di Cagliari, Poggio dei Pini,
Strada 54, 09012 Capoterra (CA), Italy
5 - IAAT, University of Tubingen, Sand 1, 72076 Tubingen, Germany
6 - INAF IASF di Palermo, via Ugo La Malfa 153, 90146 Palermo, Italy
7 - Dipartimento di Fisica, Università degli Studi Roma Tre, via della
Vasca Navale 84, 00146 Roma, Italy
8 - Astronomical Institute, Academy of Sciences of the Czech Republic,
Bocni II 1401a, 14131 Prague, Czech Republic
Received 27 November 2009 / Accepted 25 February 2010
Abstract
Context. High-resolution spectroscopy has recently
revealed in many low-mass X-ray binaries hosting a neutron star that
the shape of the broad iron line observed in the 6.4-6.97 keV
range is consistently well-fitted by a relativistically smeared line
profile.
Aims. The presence of other broad features, besides
the iron line, together with a high S/N of the spectra offer the
possibility of testing a self-consistent approach to the overall
broadband reflection spectrum and evaluating the impact of the
reflection component in the formation of the broadband X-ray spectra.
Methods. We analyzed two XMM-Newton observations of
the bright atoll source 4U 1705-44, which can be considered a
prototype of the class of the persistent NS LMXBs showing both hard and
soft states. The first observation was performed when the source was in
a hard low flux state, the second during a soft, high-flux state. Both
the spectra show broad iron emission lines. We fit the spectra using a
two-component model, together with a reflection model specifically
suited to the case of a neutron star, where the incident spectrum has a
blackbody shape.
Results. In the soft state, the reflection model,
convolved with a relativistic smearing component, consistently
describes the broad features present in the spectrum, and we find a
clear relation between the temperature of the incident flux and the
temperature of the harder X-ray component that we interpret as the
boundary layer emission. In this state we find converging evidence that
the boundary layer outer radius is ![]() 2 times the neutron
star radius. In the low flux state, we observe a change in the
continuum shape of the spectrum with respect to the soft state. Still,
the broad local emission features can be associated with a disk
reflecting matter, but in a lower ionization state, and possibly
produced in an accretion disk truncated at greater distance.
2 times the neutron
star radius. In the low flux state, we observe a change in the
continuum shape of the spectrum with respect to the soft state. Still,
the broad local emission features can be associated with a disk
reflecting matter, but in a lower ionization state, and possibly
produced in an accretion disk truncated at greater distance.
Conclusions. Our analysis provides strong evidence
that the reflection component in soft states of LMXBs comes from to
hard X-ray thermal irradiation, which we identify with the boundary
layer emission, also present in the continuum model. In the hard state,
the broad iron line if also produced by reflection, and the continuum
disk emission can be self-consistently accounted if the disk is
truncated at a greater distance than the soft state.
Key words: line: formation - X-rays: binaries - radiation mechanisms: general - X-rays: bursts
1 Introduction
In last few years, the Epic-pn instrument onboard the XMM-Newton
satellite has allowed deep investigation of the nature of the broad
emission lines observed in the iron K![]() region of bright
accreting neutron star (NS) low-mass X-ray binaries (LMXBs)
(Bhattacharyya
& Strohmayer 2007; Cackett et al. 2008; Pandel
et al. 2008; Papitto et al. 2009; Iaria
et al. 2009; Di Salvo et al. 2009; D'Aì et al.
2009). The authors of these works have focused their
attention on the shape and origin of the broad iron line, and they
agreed on the interpretation of the line broadness being the result of
to special and general relativistic effects arising in the disk
reflecting matter at a few gravitational radii from the compact
object. This interpretation is supported by theoretical expectations
and by general agreement between the fitting model and X-ray
(1-10 keV) data.
region of bright
accreting neutron star (NS) low-mass X-ray binaries (LMXBs)
(Bhattacharyya
& Strohmayer 2007; Cackett et al. 2008; Pandel
et al. 2008; Papitto et al. 2009; Iaria
et al. 2009; Di Salvo et al. 2009; D'Aì et al.
2009). The authors of these works have focused their
attention on the shape and origin of the broad iron line, and they
agreed on the interpretation of the line broadness being the result of
to special and general relativistic effects arising in the disk
reflecting matter at a few gravitational radii from the compact
object. This interpretation is supported by theoretical expectations
and by general agreement between the fitting model and X-ray
(1-10 keV) data.
However, if this interpretation is correct, the reflected spectrum should encompass a variety of other disk reflection features, because there are other low-Z, but abundant, emitting ion metals in the low-energy band. The good spectral resolution and the high S/N of the spectra has effectively shown in many cases a more complex pattern of features, besides the broad iron line. D'Aì et al. (2009) found in the spectrum of the bright Z-source GX 340+0 a broad emission line of Ca XIX and an absorbing edge of highly ionized iron; Iaria et al. (2009) found in the spectrum of the Z-source GX 349+2 three broad lines, besides the iron line, identified as Ca XIX, Ar XVIII and a blending of L-shell transitions of moderately ionized iron. Di Salvo et al. (2009) identified in the bright atoll 4U 1705-44 resonant emission lines of Ca XIX, Ar XVIII and S XVI, and an Fe XXV iron edge, which appears broad and redshifted with respect to the expected rest-frame energy. It has been therefore suggested that all these features, and not only the broad iron line, originate in the reflection component. To support this interpretation, it has been shown that the smearing components of the broad iron line (i.e., the smearing parameters of the reflection component, the inner and outer radii, inclination angle of the system, and the emissivity index, which measures the dependence of the emissivity power-law profile from the distance to the source of the irradiating photons) consistently describe the shape and the broadness of all the observed emission lines (Iaria et al. 2009; Di Salvo et al. 2009; D'Aì et al. 2009).
In this work, we perform a detailed analysis of two XMM-Newton observations of the bright atoll source 4U 1705-44. In the first observation, the source was in a low flux state, while in the second the source was in a bright soft state. First results, using a phenomenological approach to model the reflection component of the latter observation have been presented in Di Salvo et al. (2009). Here, we focus on the spectral changes that occurred between these two observations using a self-consistent reflection model.
The angular dependence of the reflected component formed by a constant-density partially-ionized medium was originally studied by Zycki et al. (1994), Zycki & Czerny (1994), and Matt et al. (2003). Reprocessing in a medium in hydrostatic equilibrium was then modeled by Raymond (1993), Nayakshin et al. (2000), Ballantyne et al. (2001), Ballantyne & Ross (2002), and Rózanska et al. (2002). Furthermore, Nayakshin & Kazanas (2002) examined the photoionized accretion discs via a novel time-dependent approach. A hot layer forms at the top of the disk atmosphere, roughly at the inverse Compton temperature, followed by a steep transition to colder, less ionized layers.
We use the reflection table model described in
Ballantyne (2004). First
application of this table model to
consistently fit the X-ray spectrum of an NS LMXB can be found in
Ballantyne & Strohmayer
(2004). This reflection model (hereafter
refbb) is calculated for an optically thick
atmosphere,
irradiated by a blackbody incident spectrum of ![]() temperature.
The model gives the reflected spectrum according to the
ionization parameter
temperature.
The model gives the reflected spectrum according to the
ionization parameter ![]() ,
and the relative abundance of iron with
respect to the other metals. In addition to fully-ionized species, the
following ions are included in the calculations:
C III-C VI, N III-N
VII,
O III-O VIII,
Ne III-Ne X,
Mg III-Mg XII,
Si IV-Si XIV,
S IV-S XVI, and
Fe VI-Fe XXVI.
The
ionization parameter, log
,
and the relative abundance of iron with
respect to the other metals. In addition to fully-ionized species, the
following ions are included in the calculations:
C III-C VI, N III-N
VII,
O III-O VIII,
Ne III-Ne X,
Mg III-Mg XII,
Si IV-Si XIV,
S IV-S XVI, and
Fe VI-Fe XXVI.
The
ionization parameter, log ![]() ,
can vary between 1 and 4, with the
density nH of the illuminated
slab constant at 1018 cm-3.
The constant density prescription can be considered a good diluted
approximation of the actual hydrostatic structure in the disk for the
1.0-10.0 keV energy range (Ballantyne
et al. 2001).
,
can vary between 1 and 4, with the
density nH of the illuminated
slab constant at 1018 cm-3.
The constant density prescription can be considered a good diluted
approximation of the actual hydrostatic structure in the disk for the
1.0-10.0 keV energy range (Ballantyne
et al. 2001).
The ![]() temperature can vary between 1 keV and 5 keV. All the
metals abundances are fixed at the solar value, except for iron for
which models were calculated for 0.1, 0.3, 1.0, 3, and 10 times the
solar value. The space parameters of this model covers, therefore, a
wide range of possible spectral solutions. In particular, this is one
of the few available reflection models in which the primary incident
spectrum is a soft thermal spectrum, and, also on the basis of the
results already shown in Di Salvo
et al. (2009), it is the most suitable
for fitting the soft states of NS LMXBs.
temperature can vary between 1 keV and 5 keV. All the
metals abundances are fixed at the solar value, except for iron for
which models were calculated for 0.1, 0.3, 1.0, 3, and 10 times the
solar value. The space parameters of this model covers, therefore, a
wide range of possible spectral solutions. In particular, this is one
of the few available reflection models in which the primary incident
spectrum is a soft thermal spectrum, and, also on the basis of the
results already shown in Di Salvo
et al. (2009), it is the most suitable
for fitting the soft states of NS LMXBs.
We show that, within the available energy range, the continuum emission can be simply accounted for a three-component model composed of thermal disk emission, a saturated/unsaturated Comptonized harder emission, and a reflection component. The last one arises from the disk reflecting matter, where the impinging radiation field is the hard X-ray emission. We study the chemical abundances of the reflecting disk matter, the accretion flow in the two states, and possible scenarios for explaining the spectral differences in the two states.
![\begin{figure}
\par\includegraphics[angle=-90,width=9cm,clip]{13758f1.eps}
\end{figure}](/articles/aa/full_html/2010/08/aa13758-09/img7.png)
|
Figure 1: Long term X-ray light curve of 4U 1705-44. Data from the All Sky Monitor (2-10 keV range) onboard the Rossi XTE, from 1 January 2006 (MJD 53736) to 1 January 2009 (MJD 54832). The two arrows in the figure mark the day when the SoftObs (right arrow) and the HardObs (left arrow) took place. |
| Open with DEXTER | |
1.1 4U 1705-44
The source is a persistently bright, accreting LMXB located in the direction of the Galactic bulge (Forman et al. 1978), hosting an NS. It shows type-I X-ray bursts, with recurrence times dependent on the accretion state (Gottwald et al. 1989; Galloway et al. 2008; Langmeier et al. 1987). From the peak luminosity of bursts that exhibited episodes of photospheric radius expansions, which are thought to happen at the Eddington luminosity and are, therefore, used as standard candles, Haberl & Titarchuk (1995) derived a distance of 7.4 -1.1+0.8 kpc, later confirmed by Galloway et al. (2008). The companion source has still not been identified, although a near-infrared counterpart, most probably originated by X-ray reprocessing by the outer accretion disk and/or the companion star, has recently been found by Homan et al. (2009).
4U 1705-44 shows a secular trend toward alternating high- and low-flux periods (see e.g., Fig. 1) on a variable timescale of months. The spectral variability, on the contrary, can be much faster, of days (Barret & Olive 2002). Classified by Hasinger & van der Klis (1989) as an Atoll source, it was later shown that its spectral and temporal states are intermediate between the classic Atoll and the Z-sources division (Barret & Olive 2002). In particular, broadband X-ray data have shown that the switch between hard and soft states can be explained using a two-component model of a Comptonized inner emission and a soft thermal emission. Barret & Olive (2002) and Olive et al. (2003) interpreted the alternate hard and soft state transitions as caused by different truncation radii of the accretion disk. During hard states the disk is truncated at a large distance from the compact object and a hot corona with high electron temperatures and low optical depth forms around the NS. During the hard to soft state transitions, the inner disk approaches the NS; this causes an increase in its flux, thus providing a more efficient Compton cooling for the hot electrons and softer spectra. This scenario is supported by spectral modeling and by the timing analysis of the power-density spectra where the characteristic frequencies of the band-limited noise and of the low-frequency noise components are strongly correlated with the position of the source in the hardness-intensity diagram. High frequency quasi-periodic oscillations (QPOs) are also observed, usually in pairs (so-called kiloHerzt QPOs, kHzQPOs), with the highest reported peak at 1160 Hz (Ford et al. 1998; Wijnands et al. 1998).
Spectral analysis with the Chandra high-resolution gratings
revealed,
superimposed to the continuum, a set of local features, the most
prominent of which was an unambigous, intrinsically broad (
![]() keV) fluorescent
iron line (Di Salvo et al.
2005). However, it was not
possible to distinguish among different broadening mechanisms on the
basis of the goodness of the spectral fit. This motivated the need for
new observations with the XMM-Newton satellite, given the much larger
collecting area in the iron region of the Epic-pn CCDs. A first
XMM-Newton observation caught the source in a low state, and the S/N
was rather poor in the iron range. A second observation, performed as
a target of opportunity when the source returned to a high-intensity
soft period was successful in disclosing the asymmetry in the iron
line shape, which Di Salvo
et al. (2009) interpreted as the result of
reflection on a disk surface, very close to the NS, of hard coronal
photons. A similar scenario has also been proposed for BeppoSAX broad
band data in Piraino et al.
(2007), and a claim was also made, using
INTEGRAL high energy data, of a signature of a Compton bump in
Fiocchi et al. (2007).
Recently, Reis et al. (2009)
using broad band SUZAKU
data also shows that the asymmetry of the iron profile are naturally
described by a disk reflection scenario.
keV) fluorescent
iron line (Di Salvo et al.
2005). However, it was not
possible to distinguish among different broadening mechanisms on the
basis of the goodness of the spectral fit. This motivated the need for
new observations with the XMM-Newton satellite, given the much larger
collecting area in the iron region of the Epic-pn CCDs. A first
XMM-Newton observation caught the source in a low state, and the S/N
was rather poor in the iron range. A second observation, performed as
a target of opportunity when the source returned to a high-intensity
soft period was successful in disclosing the asymmetry in the iron
line shape, which Di Salvo
et al. (2009) interpreted as the result of
reflection on a disk surface, very close to the NS, of hard coronal
photons. A similar scenario has also been proposed for BeppoSAX broad
band data in Piraino et al.
(2007), and a claim was also made, using
INTEGRAL high energy data, of a signature of a Compton bump in
Fiocchi et al. (2007).
Recently, Reis et al. (2009)
using broad band SUZAKU
data also shows that the asymmetry of the iron profile are naturally
described by a disk reflection scenario.
2 Observation and data reduction
The XMM-Newton Observatory (Jansen et al. 2001) includes three 1500 cm2X-ray telescopes each with an European Photon Imaging Camera (Epic, 0.1-15 keV) at the focus. Two of the Epic imaging spectrometers use MOS CCDs (Turner et al. 2001), and one uses pn CCDs (Strüder et al. 2001). Reflection grating spectrometers (RGS, 0.35-2.5 keV, den Herder et al. 2001) are located behind two of the telescopes.
XMM-Newton observed 4U 1705-44 on two occasions. The most recent observation was performed on 24 August 2008 from 02:57:04 to 17:13:35 UTC (Obs. ID 0551270201, hereafter SoftObs) for a duration of 51.390 ks and an effective exposure of 45.170 ks (owing to telemetry overflow during some part of the observation), the second observation took place on 26 August 2006 from 05:04:54 to 14:55:38 UTC (Obs. ID 0402300201, hereafter HardObs), with an exposure total time of 36.733 ks.
On both occasions, the Epic-pn operated in timing mode with medium filter. In this mode only one central CCD is read out with a time resolution of 0.03 ms. This provides a one-dimensional image of the source with the second spatial dimension being replaced by timing information. RGSs operated in spectroscopy mode.
Figure 1
shows the long-term X-ray variability of
the source as seen from the All Sky Monitor (ASM) of the Rossi XTE,
from 1 January 2006 to 1 January 2009, the period when SoftObs and
HardObs were performed is marked in the light curve. HardObs took
place when the source activity was in a relatively low state (ASM
count rate ![]() 5 count/s),
while SoftObs was performed almost at
the peak of one of the months lasting active state (ASM count rate
5 count/s),
while SoftObs was performed almost at
the peak of one of the months lasting active state (ASM count rate
![]() 35 count/s).
During the HardObs the source showed a type-I
X-ray burst, while no bursts were present in the SoftObs. In
Fig. 2,
we show the Epic-pn light curves of the two
observations. In HardObs the countrate variability, excluding the
burst interval (see Sect. 4), is around
a 10% level
from the average of 33.4 counts/s, while SoftObs has an
average of 870
counts/s and a similar variability spread.
35 count/s).
During the HardObs the source showed a type-I
X-ray burst, while no bursts were present in the SoftObs. In
Fig. 2,
we show the Epic-pn light curves of the two
observations. In HardObs the countrate variability, excluding the
burst interval (see Sect. 4), is around
a 10% level
from the average of 33.4 counts/s, while SoftObs has an
average of 870
counts/s and a similar variability spread.
![\begin{figure}
\par\includegraphics[angle=-90,width=8cm,clip]{13758f2a.eps} \includegraphics[angle=-90,width=8cm,clip]{13758f2b.eps}
\end{figure}](/articles/aa/full_html/2010/08/aa13758-09/img9.png)
|
Figure 2:
Light curves for SoftObs ( upper panel) and for
HardObs ( lower panel). In HardObs, a type I X-ray
burst is present at |
| Open with DEXTER | |
In Fig. 3, we show the color-color diagram for the two observations. The soft color is defined as the ratio of the counts in the 1-3/3-6 keV band and the hard color as the ratio in the 3-6/6-10 keV band. The source shows very little variability during HardObs, while SoftObs is more variable, but always softer than HardObs.
![\begin{figure}
\par\includegraphics[angle=-90,width=9cm,clip]{13758f3.eps}
\end{figure}](/articles/aa/full_html/2010/08/aa13758-09/img10.png)
|
Figure 3: Color-color diagram that shows the relative positions of the two observations. Each point represents a time segment of 500 s. SoftObs data in red, HardObs data in green. |
| Open with DEXTER | |
For spectral analysis we used Xspec version 12.5.0 (Arnaud 1996). The interstellar absorption (phabs component in Xspec) is calculated using the cross-section table of Verner et al. (1996) and the metal abundances table of Wilms et al. (2000). We used the Science Analysis System (SAS) version 9.0 for the reprocessing of XMM-Newton data, with the epproc pipeline for generating the Epic-pn scientific products and the rgsproc pipeline for the RGS ones.
We used standard SAS tools for data
selection, masks generation, ancillary and response matrices. Spectra
were filtered according to the ![]() and FLAG=0 criteria. Background spectra above
12 keV were inspected to check for periods of high solar
background. Background spectra were extracted using the same filtering
criteria of source spectra in the RAWX 3-10 columns. Source
spectra were extracted in the RAWX 28-46 columns. We used the
Epic-pn spectra grouped to have 5 energy channels per
resolution element and at least 25 counts per energy channel.
This choice avoids an excessive oversampling of the data, without loss
of important spectral information. RGS data were also grouped by
adopting the 25 counts per energy channel criterion.
and FLAG=0 criteria. Background spectra above
12 keV were inspected to check for periods of high solar
background. Background spectra were extracted using the same filtering
criteria of source spectra in the RAWX 3-10 columns. Source
spectra were extracted in the RAWX 28-46 columns. We used the
Epic-pn spectra grouped to have 5 energy channels per
resolution element and at least 25 counts per energy channel.
This choice avoids an excessive oversampling of the data, without loss
of important spectral information. RGS data were also grouped by
adopting the 25 counts per energy channel criterion.
By testing different choices of channels binning, we observed
a change in the value of the reduced ![]() of the best-fitting models, but still the best-fitting parameters are
not significantly dependent on this choice.
of the best-fitting models, but still the best-fitting parameters are
not significantly dependent on this choice.
3 Spectral analysis
3.1 SoftObs the soft state
SoftObs was analyzed in Di Salvo et al. (2009); here we present a self-consistent approach to the spectrum modeling using a broadband reflection model. In Di Salvo et al. (2009), the main focus was on the determination and the nature of the broad emission lines seen in the energy spectrum from 2.5 keV to 11 keV. It was shown that the reflection scenario, including the relativistic effects, is the most physically and statistically favored solution for interpreting the broad emission features.
We analyzed these data again, using a slightly different extraction mask for the Epic-pn, namely excluding the brightest CCD column (RAWX = 37), in order to obtain a complete pile-up free spectrum. We used the epatplot tool of the SAS package to check the distribution of single vs. double event pattern distribution. This tool shows the theoretical normalized fractional distribution of these events and the real data distribution. A mismatch between the data and the theoretical predicted curves indicates possible pile-up. The XMM-Newton data of 4U 1705-44, including the brightest CCD row, deviate from the theoretical curves for energies less than 2.5 keV (which indeed were excluded from the analysis published by Di Salvo et al. 2009) and above 9 keV. The exclusion of the brightest row of the Epic-pn CCD significantly reduces this problem (e.g. the gap between data and theoretical curve passes from 0.02 to 0, from 0.03 to <0.01, from 0.04 to <0.02 at 3 keV, 6 keV, 9 keV, respectively).
We also used RGS1 data in the 1.0-2.0 keV energy
range, while RGS2
data have been discarded since they are severely pile-up
affected![]() . Epic-pn data were first
used in the broad energy range
between 0.6-12.0 keV. This range, however, revealed (as in
HardObs)
some very large systematic features around the Au and Si instrumental
edges that are difficult to reconcile with any plausible physical
scenario (see also Papitto
et al. 2009; Boirin & Parmar 2003).
Also, a mismatch
between the RGS and PN spectrum in the 1.0-2.0 keV range is
indicative
of calibration uncertainties that affect the determination of the soft
band. In Fig. 4,
we show the Epic-pn spectrum for
clarity, when the 2.0-11 keV band is used for deriving the
best-fitting model, and then the 0.6-2.0 keV channels are
noticed. The
broad feature at 1.7 keV is also present in HardObs, and we
found that
this spectral shape can be well-fitted using a simple broad Gaussian
line. These Gaussian parameters are consistent in the two datasets. At
very low energies, the spectrum shows a clear flux excess, which,
however, is ruled out by the simultaneous RGS1 dataset. We therefore
excluded the PN energy range below 2 keV in order to get rid
of any
systematic problem that could affect our analysis, and used only the
RGS1 data to constrain the softest band.
. Epic-pn data were first
used in the broad energy range
between 0.6-12.0 keV. This range, however, revealed (as in
HardObs)
some very large systematic features around the Au and Si instrumental
edges that are difficult to reconcile with any plausible physical
scenario (see also Papitto
et al. 2009; Boirin & Parmar 2003).
Also, a mismatch
between the RGS and PN spectrum in the 1.0-2.0 keV range is
indicative
of calibration uncertainties that affect the determination of the soft
band. In Fig. 4,
we show the Epic-pn spectrum for
clarity, when the 2.0-11 keV band is used for deriving the
best-fitting model, and then the 0.6-2.0 keV channels are
noticed. The
broad feature at 1.7 keV is also present in HardObs, and we
found that
this spectral shape can be well-fitted using a simple broad Gaussian
line. These Gaussian parameters are consistent in the two datasets. At
very low energies, the spectrum shows a clear flux excess, which,
however, is ruled out by the simultaneous RGS1 dataset. We therefore
excluded the PN energy range below 2 keV in order to get rid
of any
systematic problem that could affect our analysis, and used only the
RGS1 data to constrain the softest band.
![\begin{figure}
\par\includegraphics[angle=-90,width=9cm,clip]{13758f4.eps}
\end{figure}](/articles/aa/full_html/2010/08/aa13758-09/img13.png)
|
Figure 4:
Residuals, in units of |
| Open with DEXTER | |
![\begin{figure}
\par\mbox{\includegraphics[angle=-90,width=8cm,clip]{13758f5a.eps} \includegraphics[angle=-90,width=8cm,clip]{13758f5b.eps} }
\end{figure}](/articles/aa/full_html/2010/08/aa13758-09/img14.png)
|
Figure 5: Data and best-fitting model with individual components separately shown (top panels), together with residuals in units of sigma (lower panels). Left panel: the best-fitting model without the Ar XVIII and Ca XIX emission lines. Right panel: data and residuals using the best-fitting model of Table 1. |
| Open with DEXTER | |
In analyzing these data, Di Salvo
et al. (2009) decomposed the continuum emission into
the sum of a soft blackbody component and a harder, optically thick,
Comptonized component. In the present work, we used a slightly
different but physically and statistically similar continuum model. We
replaced the soft blackbody component by a multicolored disk component (diskbb
model in Xspec, Makishima
et al. 1986), while the Comptonized emission could
be approximated well with a simpler hard blackbody component. Having an
additional continuum component at energies above 7 keV from
the reflection continuum gives, in fact, a Comptonization optical depth
over 10, while, at the same time, seed-photon temperature and electron
temperature get very near to each other (
![]() keV), so that the
blackbody approximation is reasonably justified (Iaria et al. 2009; D'Aì et al.
2009). Moreover, instead of a number of local disklines
and a smeared absorption edge, in this work we use a self-consistent
table reflection model (Ballantyne
2004), convolved with the rdblur
component (Fabian et al. 1989)
to consider the relativistic effects in a Schwarzschild space-time
(i.e. relativistic Doppler boosting, light bending, and lensing effect
of the disk irradiated matter). The degree of smearing is set by the
disk's inner and outer radius (in units of gravitational radii
keV), so that the
blackbody approximation is reasonably justified (Iaria et al. 2009; D'Aì et al.
2009). Moreover, instead of a number of local disklines
and a smeared absorption edge, in this work we use a self-consistent
table reflection model (Ballantyne
2004), convolved with the rdblur
component (Fabian et al. 1989)
to consider the relativistic effects in a Schwarzschild space-time
(i.e. relativistic Doppler boosting, light bending, and lensing effect
of the disk irradiated matter). The degree of smearing is set by the
disk's inner and outer radius (in units of gravitational radii ![]() km
for a 1.4 solar mass NS), the inclination angle of the disk,
and the emissivity law profile, assumed to only depend on the distance
of the source of the impinging photons (
km
for a 1.4 solar mass NS), the inclination angle of the disk,
and the emissivity law profile, assumed to only depend on the distance
of the source of the impinging photons (
![]() ).
These parameters are well constrained by the fitting, except for the
disk outer radius, which is poorly constrained (
).
These parameters are well constrained by the fitting, except for the
disk outer radius, which is poorly constrained (
![]()
![]() ), so that
we choose to keep it frozen at 104
), so that
we choose to keep it frozen at 104 ![]() ,
given its much larger uncertainty with respect to the other spectral
parameters.
,
given its much larger uncertainty with respect to the other spectral
parameters.
We tested that the ![]() ,
the temperature of the irradiating flux is perfectly consistent with
the same temperature of the hard blackbody component, and we set the
two spectral parameters tied together during the fitting procedure.
,
the temperature of the irradiating flux is perfectly consistent with
the same temperature of the hard blackbody component, and we set the
two spectral parameters tied together during the fitting procedure.
This model adequately describes the continuum and the shape of
the iron line, and also takes the emission features of Si XIV
and S XVI into account, although some
residuals are still present at ![]() 2.6 keV probably due
to an overabundance of this metal with respect to the other elements.
There are still two broad features at
2.6 keV probably due
to an overabundance of this metal with respect to the other elements.
There are still two broad features at ![]() 3.9 keV and
3.9 keV and ![]() 3.32 keV
that stand out in the residuals (see Fig. 5, left
panel). Following the interpretation of Di
Salvo et al. (2009), which ascribes these features
to resonant emission lines of He-like calcium and H-like argon ions, we
added two Gaussians to account for these residuals profiles, given that
our reflection model lacks, in fact, the relative emission lines for
these elements. These lines are kept with 0 keV frozen width
and are convolved with the rdblur kernel, with
the smearing parameters identical to the refbb
model. The reduced
3.32 keV
that stand out in the residuals (see Fig. 5, left
panel). Following the interpretation of Di
Salvo et al. (2009), which ascribes these features
to resonant emission lines of He-like calcium and H-like argon ions, we
added two Gaussians to account for these residuals profiles, given that
our reflection model lacks, in fact, the relative emission lines for
these elements. These lines are kept with 0 keV frozen width
and are convolved with the rdblur kernel, with
the smearing parameters identical to the refbb
model. The reduced ![]() ,
with the introduction of these two additional smeared lines varies from
1.70 (710 d.o.f.) to 1.30 (706 d.o.f.), and the residuals at the
3.3 keV and 3.9 keV energies are reasonably well
fitted (Fig. 5,
right panel). These two lines have a similar equivalent width (between
8 and 10 eV), and the line positions are well constrained and
in agreement with the expected rest-frame emission line energies (the
Ar XVIII at
,
with the introduction of these two additional smeared lines varies from
1.70 (710 d.o.f.) to 1.30 (706 d.o.f.), and the residuals at the
3.3 keV and 3.9 keV energies are reasonably well
fitted (Fig. 5,
right panel). These two lines have a similar equivalent width (between
8 and 10 eV), and the line positions are well constrained and
in agreement with the expected rest-frame emission line energies (the
Ar XVIII at ![]() keV
and the Ca XIX at
keV
and the Ca XIX at ![]() keV).
keV).
Given the high quality of the spectrum, we also tried to
evaluate the fraction of iron abundance with respect to the other
metals. Setting the iron fraction overabundant with respect to other
metals by a factor of 3 provides a worsening of the fit with respect to
the assumed solar values (
![]() statistic value 9.7 and probability 0.2%), and the same happens when
the iron fraction is assumed to be underabundant for the same factor (
statistic value 9.7 and probability 0.2%), and the same happens when
the iron fraction is assumed to be underabundant for the same factor (
![]() statistic value 11.7 and probability 0.06%). We concluded that the iron
fraction is well constrained by the reflection model, and it is
relatively consistent with the assumed solar abundance values within a
factor of 3.
statistic value 11.7 and probability 0.06%). We concluded that the iron
fraction is well constrained by the reflection model, and it is
relatively consistent with the assumed solar abundance values within a
factor of 3.
Although this model is formally not satisfactory (
![]() with 706 d.o.f.), there is no evidence in the residuals of
other local features, and the residuals are so randomly distributed
around the best-fitting model that no other continuum component is
required. The most probable explanation for this high
with 706 d.o.f.), there is no evidence in the residuals of
other local features, and the residuals are so randomly distributed
around the best-fitting model that no other continuum component is
required. The most probable explanation for this high ![]() is that, at this very high count rate
(>400 cts s-1), the
statistical errors in the channels becomes too small compared with the
relative uncertainty of the response matrix, giving an overall
underestimation of the systematic error to be attributed to the energy
channels. Adding a 0.8% systematic error to the best-fitting model, we
find a value of
is that, at this very high count rate
(>400 cts s-1), the
statistical errors in the channels becomes too small compared with the
relative uncertainty of the response matrix, giving an overall
underestimation of the systematic error to be attributed to the energy
channels. Adding a 0.8% systematic error to the best-fitting model, we
find a value of ![]() .
This error is added in quadrature in order to self-consistently
evaluate the error to be associated to the spectral parameters, which
are reported in Table 1. We also
report the unabsorbed fluxes of each spectral component in the
1-10 keV range, and in the extrapolated 0.1-100.0 keV
range. The blackbody radius and inner disk radius are calculated
assuming a distance to the source of 7.4 kpc and a disk
inclination of 35
.
This error is added in quadrature in order to self-consistently
evaluate the error to be associated to the spectral parameters, which
are reported in Table 1. We also
report the unabsorbed fluxes of each spectral component in the
1-10 keV range, and in the extrapolated 0.1-100.0 keV
range. The blackbody radius and inner disk radius are calculated
assuming a distance to the source of 7.4 kpc and a disk
inclination of 35![]() .
.
The observed 1.0-10.0 keV absorbed flux in this
observation is ![]() erg cm-2 s-1,
while the unabsorbed flux is
erg cm-2 s-1,
while the unabsorbed flux is ![]() erg cm-2 s-1.
Extrapolation of this model from 0.1 keV to 100 keV
results in a bolometric unabsorbed flux of
erg cm-2 s-1.
Extrapolation of this model from 0.1 keV to 100 keV
results in a bolometric unabsorbed flux of ![]() erg cm-2 s-1.
The inferred X-ray luminosity in this state corresponds to
erg cm-2 s-1.
The inferred X-ray luminosity in this state corresponds to ![]()
![]() erg s-1.
Figure 6
shows the contribution of disk thermal emission, hard thermal emission,
and reflection component to the absorbed 0.5-50 keV flux (left
panel) and to the unabsorbed 0.1-50 keV flux (right panel).
The contribution of the reflection component is dominant at very low
energies, below 1 keV, while, because of the very soft nature
of the incident spectrum, it falls off very rapidly beyond the iron
line region.
erg s-1.
Figure 6
shows the contribution of disk thermal emission, hard thermal emission,
and reflection component to the absorbed 0.5-50 keV flux (left
panel) and to the unabsorbed 0.1-50 keV flux (right panel).
The contribution of the reflection component is dominant at very low
energies, below 1 keV, while, because of the very soft nature
of the incident spectrum, it falls off very rapidly beyond the iron
line region.
Table 1: Best-fitting values of the parameters obtained for the soft state of 4U 1705-44.
![\begin{figure}
\par\mbox{\includegraphics[angle=-90,width=8cm,clip]{13758f6a} \includegraphics[angle=-90,width=8cm,clip]{13758f6b} }
\end{figure}](/articles/aa/full_html/2010/08/aa13758-09/img37.png)
|
Figure 6:
Best fitting model in the |
| Open with DEXTER | |
3.2 HardObs the hard state
In this section we describe the spectral analysis of the persistent
emission of HardObs, excluding the data close to the type-I X-ray
burst (from 15 s before the burst peak to 200 s after the
burst peak).
We first used Epic-pn data in the broad energy range from
0.6 keV to
12.0 keV, RGS1, and RGS2 data in the 1.0-2.0 keV
energy range. A
single absorbed power-law model fails to describe the data
(
![]() d.o.f.);
a power law with exponential
cut-off provides a better fit, but still unsatisfactory
(
d.o.f.);
a power law with exponential
cut-off provides a better fit, but still unsatisfactory
(
![]() d.o.f.);
replacing the exponentially
cut-off power law with a physical Comptonization model
(comptt in Xspec, Titarchuk
1994) again improves the
fit significantly (
d.o.f.);
replacing the exponentially
cut-off power law with a physical Comptonization model
(comptt in Xspec, Titarchuk
1994) again improves the
fit significantly (
![]() d.o.f.).
Residuals at
low energies, however, require the addition of an additional soft
component. A blackbody component or multicolored disk emission
(diskbb in Xspec) is able to satisfactorily model
the
continuum emission, although from a statistical point of view, we are
not able to distinguish between a single thermal temperature and the
multicolored model (
d.o.f.).
Residuals at
low energies, however, require the addition of an additional soft
component. A blackbody component or multicolored disk emission
(diskbb in Xspec) is able to satisfactorily model
the
continuum emission, although from a statistical point of view, we are
not able to distinguish between a single thermal temperature and the
multicolored model (
![]() d.o.f.
for both
models), and we discuss different physical scenarios. The still high
d.o.f.
for both
models), and we discuss different physical scenarios. The still high
![]() stems
from the presence of a broad local emission line in the
iron range and to an S-shaped pattern in the residuals at softer
energies, which could be fitted by a broad Gaussian at energies
stems
from the presence of a broad local emission line in the
iron range and to an S-shaped pattern in the residuals at softer
energies, which could be fitted by a broad Gaussian at energies ![]() 1.7 keV.
This broad line is, however, not easily identified with any physically
reasonable bound-bound transition so we discuss a possible instrumental
origin. In fact, the residuals pattern between 1.0 and
2.0 keV is mostly guided by the Epic-pn channels, given the
much
larger collecting area compared to the RGSs. Fitting the RGS datasets
alone, we obtain a relatively good fit (reduced
1.7 keV.
This broad line is, however, not easily identified with any physically
reasonable bound-bound transition so we discuss a possible instrumental
origin. In fact, the residuals pattern between 1.0 and
2.0 keV is mostly guided by the Epic-pn channels, given the
much
larger collecting area compared to the RGSs. Fitting the RGS datasets
alone, we obtain a relatively good fit (reduced ![]() )
using
either an absorbed power-law model or blackbody model as continuum.
RGS data alone indicate a higher
)
using
either an absorbed power-law model or blackbody model as continuum.
RGS data alone indicate a higher ![]() than the Epic-pn data
(
than the Epic-pn data
(![]()
![]() cm-2
for power-law
continuum,
cm-2
for power-law
continuum, ![]() cm-2
for blackbody emission).
cm-2
for blackbody emission).
![\begin{figure}
\par\mbox{\includegraphics[angle=-90,width=8.2cm,clip]{13758f7a.e...
...raphics[angle=-90,width=8.2cm,clip]{13758f7b.eps} }
\vspace*{2mm}
\end{figure}](/articles/aa/full_html/2010/08/aa13758-09/img45.png)
|
Figure 7: Left panel: data and residuals at the soft energies (0.6-3.0 keV), using an absorbed blackbody component. Residuals clearly display an S-shaped pattern in the Epic-pn data (black data) between 1.5 keV and 2.0 keV and a general mismatch between RGS data (green and red data) and Epic-pn data at softer energies. Data have been rebinned for clarity. Right panel: residuals in the iron range, when data 4.0-9.0 keV are fitted with Model 1 and the iron line is subtracted from the data. |
| Open with DEXTER | |
Table 2: Best-fitting values and associated errors for different modelization used to fit the hard state data of 4U 1705-44.
On the contrary, in the restricted 0.6-2.0 keV
Epic-pn band, we
clearly observe large residuals that cannot be ascribed to the shape
of the continuum emission (see Fig. 7, left panel).
Inclusion of a broad line at 1.7 keV makes the model
acceptable;
however, this line is not required in the RGSs spectrum, for which we
get only an upper limit on the line normalization of ![]() photons cm-2 s-1
(90% confidence level), which
not compatible with the lower limit of the Epic-pn spectrum (
photons cm-2 s-1
(90% confidence level), which
not compatible with the lower limit of the Epic-pn spectrum (
![]() photons cm-2 s-1
, 90% confidence
level). This led us to conclude that the line is probably an artifact
due to incorrect modelization of the instrumental K Si and M Au edges
of the Epic-pn. Moreover, as mentioned above, the Epic-pn data require
a much lower value of the
photons cm-2 s-1
, 90% confidence
level). This led us to conclude that the line is probably an artifact
due to incorrect modelization of the instrumental K Si and M Au edges
of the Epic-pn. Moreover, as mentioned above, the Epic-pn data require
a much lower value of the ![]() (
(
![]() cm-2),
which does not match by far the high value as
derived from the RGSs and the Epic-pn data above 2 keV or the
cm-2),
which does not match by far the high value as
derived from the RGSs and the Epic-pn data above 2 keV or the
![]() value of
SoftObs, nor the
value of
SoftObs, nor the ![]() value as
derived from the burst analysis. This implies either an usual
underabundance of light Z metals (e.g., oxygen, neon, magnesium) with
respect to high Z metals or the presence of additional soft X-ray
emission, or a soft flux miscalibration of the instruments. The first
hypothesis appears the least probable. The second hypothesis can be,
in principle, correct and it is not difficult to image other physical
mechanisms that can play an important role at these very soft X-ray
energies (X-ray reprocessing in the outer disk or at the surface of
the companion star), but our experience has shown that other
XMM-Newton observations in timing mode of moderately absorbed bright
sources are affected by such soft excesses (Iaria et al. 2009; D'Aì et al.
2009),
often in the form of strong and very broad emission lines at 1.0 keV.
Although possibly hiding a physical origin, such excesses can
introduce strong biases in the determination of the correct physical
model and physical conclusions. In view of the above-mentioned
considerations, we chose not to consider Epic-pn data below 2 keV, in
analogy with data reduction of SoftObs, and to rely on the RGS data
for the rest of our analysis.
value as
derived from the burst analysis. This implies either an usual
underabundance of light Z metals (e.g., oxygen, neon, magnesium) with
respect to high Z metals or the presence of additional soft X-ray
emission, or a soft flux miscalibration of the instruments. The first
hypothesis appears the least probable. The second hypothesis can be,
in principle, correct and it is not difficult to image other physical
mechanisms that can play an important role at these very soft X-ray
energies (X-ray reprocessing in the outer disk or at the surface of
the companion star), but our experience has shown that other
XMM-Newton observations in timing mode of moderately absorbed bright
sources are affected by such soft excesses (Iaria et al. 2009; D'Aì et al.
2009),
often in the form of strong and very broad emission lines at 1.0 keV.
Although possibly hiding a physical origin, such excesses can
introduce strong biases in the determination of the correct physical
model and physical conclusions. In view of the above-mentioned
considerations, we chose not to consider Epic-pn data below 2 keV, in
analogy with data reduction of SoftObs, and to rely on the RGS data
for the rest of our analysis.
RGS data, however, have fewer statistics than the Epic-pn
data, and we
noted that the determination of the soft component is strongly
correlated with the ![]() value. We chose to use results of
the soft state analysis to derive better constraints for this
observation, and we froze the
value. We chose to use results of
the soft state analysis to derive better constraints for this
observation, and we froze the ![]() value to the best-fitting
value of Table 1.
Adopting the value of
value to the best-fitting
value of Table 1.
Adopting the value of
![]() cm-2
derived from the burst
analysis (see Sect. 4)
does not significantly change
the determination of the spectral components, or our conclusions.
cm-2
derived from the burst
analysis (see Sect. 4)
does not significantly change
the determination of the spectral components, or our conclusions.
The broad ![]() 6.4 keV
line can be identified as a fluorescence emission line of iron in a low
ionization state (see Model 1 in Table 2). The line
is intrinsically broad, given that its width is much greater than the
energy resolution of the Epic-pn in this energy band.
6.4 keV
line can be identified as a fluorescence emission line of iron in a low
ionization state (see Model 1 in Table 2). The line
is intrinsically broad, given that its width is much greater than the
energy resolution of the Epic-pn in this energy band.
We present in Table 2 the results of three different spectral decompositions. The models mostly differ in the choice of the soft component and of the reflection model, but share the use of a Comptonized component for the hard-energy part of the spectrum. However, because the spectrum is only covered up to 12 keV and the Comptonized emission extends well above this energy, we found a strong correlation, in all the models, in parameter space, between the electron temperature and the optical depth of this component. In this state, the source has been previously observed many times with the Rossi XTE satellite, whose higher energy coverage allows for much better constraints. In Barret & Olive (2002), the optical depth of the Comptonized component, in this hard state, shows a nearly constant value at 5.5. We chose, therefore, to keep this parameter frozen at this value, to reduce the uncertainties in the determination of all the other spectral parameters, after having checked that this value is, however, within the parameter error bar, if this is set free to vary in the fitting procedure.
In Model 1, we use a thermal blackbody for the soft component
and a Comptonization for the hard component (Gierlinski & Done 2002;
Barret
& Olive 2002). The iron line is fitted using a
Gaussian line. In Model 2, we use a multicolored disk
emission, with disk normalization N fixed to 70
(this value corresponds to an inner edge located at ![]() 1.2
1.2
![]() )
and the refbb reflection model convolved with rdblur
smearing kernel. The use of the refbb model can
be considered a good first-order approximation, within the 1-12 keV
available band, of the actual reflection spectrum, although the
impinging radiation spectrum now departs from a saturated
blackbody-like spectrum. The reflection model is mainly used to
reproduce the broad iron fluorescence line as we have no other
prominent feature available to constrain other reflection models. The
temperature of the blackbody incident spectrum, the ionization
parameter, and the component normalization are left free to vary. In
this way, the reflection model provides the same information on the
ionization state of the disk reflecting matter, on the
1-10 keV reflection flux, and on the hardness of the impinging
radiation source, as would be derived with other reflection models. In
Model 3, we force a spectral solution with disk normalization N
fixed to 1200 (corresponding to an inner radius of
)
and the refbb reflection model convolved with rdblur
smearing kernel. The use of the refbb model can
be considered a good first-order approximation, within the 1-12 keV
available band, of the actual reflection spectrum, although the
impinging radiation spectrum now departs from a saturated
blackbody-like spectrum. The reflection model is mainly used to
reproduce the broad iron fluorescence line as we have no other
prominent feature available to constrain other reflection models. The
temperature of the blackbody incident spectrum, the ionization
parameter, and the component normalization are left free to vary. In
this way, the reflection model provides the same information on the
ionization state of the disk reflecting matter, on the
1-10 keV reflection flux, and on the hardness of the impinging
radiation source, as would be derived with other reflection models. In
Model 3, we force a spectral solution with disk normalization N
fixed to 1200 (corresponding to an inner radius of ![]() 5
5
![]() ,
or
,
or ![]() 30
30 ![]() ). For both
Model 2 and Model 3, the smearing of the reflection
component is strongly required by the fit (
). For both
Model 2 and Model 3, the smearing of the reflection
component is strongly required by the fit (
![]() , without any smearing),
although the smearing parameters, when left free to vary, were strongly
correlated and uncertain. We chose to keep the inclination angle and
the emissivity index of the rdblur component
frozen to the best-fitting values of the soft state fit (see
Table 1),
because these parameters are not physically expected to vary between
the two states. In Model 2 we left the inner and outer radii
free to vary. As can be noted, they are not very well constrained. The
inner radius is required to be less than 90
, without any smearing),
although the smearing parameters, when left free to vary, were strongly
correlated and uncertain. We chose to keep the inclination angle and
the emissivity index of the rdblur component
frozen to the best-fitting values of the soft state fit (see
Table 1),
because these parameters are not physically expected to vary between
the two states. In Model 2 we left the inner and outer radii
free to vary. As can be noted, they are not very well constrained. The
inner radius is required to be less than 90 ![]() ,
with a best fitting value of 30
,
with a best fitting value of 30 ![]() .
In Model 3, these two parameters are unconstrained as well,
and we chose to freeze the inner radius at a reference value of
30
.
In Model 3, these two parameters are unconstrained as well,
and we chose to freeze the inner radius at a reference value of
30 ![]() (matching it with the inner disk edge value of the continuum component diskbb),
while the outer radius is frozen at 1000
(matching it with the inner disk edge value of the continuum component diskbb),
while the outer radius is frozen at 1000 ![]() .
.
In Fig. 8 we show the data and the residuals with respect to the best-fitting models, together with the best-fitting unabsorbed model in the extrapolated 0.1-100.0 keV range. Best-fitting values of the spectral components and corresponding fluxes, calculated in the unabsorbed 1.0-10.0 keV range and in the extrapolated 0.1-100.0 keV range, are reported in Table 2. As observed, irrespective of the model we used to fit the data, the bulk of the emission is in the Comptonized component and the fluxes do not differ substantially from one model to the next.
![\begin{figure}
\par\includegraphics[angle=-90,width=8.2cm]{13758f8a.eps}\hspace*...
...cludegraphics[angle=-90,width=8.3cm]{13758f8f.eps} \vspace*{1.5mm}
\end{figure}](/articles/aa/full_html/2010/08/aa13758-09/img58.png)
|
Figure 8:
Right panels: XMM-Newton data and residuals
in units of |
| Open with DEXTER | |
4 Burst analysis
In HardObs, the source showed a type I X-ray burst. The peak of the
burst was observed 10.844 s after the beginning of the
observation and
lasted approximately for 100 s. The light curve profile during
the
decay phase is well-fitted by an exponential curve with a decay time
![]() of
10.4 s. The spectral evolution of the burst is similar to
what is observed in other sources. We used the source spectrum
15 s
before the onset of the burst as background file, and then we
extracted a source spectrum every 5 s, after the burst peak.
The burst
spectrum is well-fitted by an absorbed blackbody spectrum and
does not show any other spectral feature, also because the low
statistics and the short exposure times. In Table 3,
we show the variation in the burst flux and the decreasing temperature
of the continuum component as a function of time. The burst does not
show photospheric radius expansion.
of
10.4 s. The spectral evolution of the burst is similar to
what is observed in other sources. We used the source spectrum
15 s
before the onset of the burst as background file, and then we
extracted a source spectrum every 5 s, after the burst peak.
The burst
spectrum is well-fitted by an absorbed blackbody spectrum and
does not show any other spectral feature, also because the low
statistics and the short exposure times. In Table 3,
we show the variation in the burst flux and the decreasing temperature
of the continuum component as a function of time. The burst does not
show photospheric radius expansion.
Table 3: Time-resolved spectral evolution of the burst emission.
The study of this burst allows, for the first time in this
source, to
independently constrain the value of the interstellar absorption
towards the source direction. Past studies, in fact, relied on the
Rossi XTE data, where the spectra started from 3.0 keV and
gave nearly
no constraint on the ![]() .
We fitted the six datasets using
a common fit, with the
.
We fitted the six datasets using
a common fit, with the ![]() tied for each dataset. The
reduced
tied for each dataset. The
reduced ![]() of the fit is acceptable, 1.03 for 472 dof, and we
derived a value for the
of the fit is acceptable, 1.03 for 472 dof, and we
derived a value for the ![]() parameter =
parameter = ![]() cm-2
(
cm-2
(
![]() cm-2
for 99% confidence level). Using the once common
wabs interstellar absorption component, we get
cm-2
for 99% confidence level). Using the once common
wabs interstellar absorption component, we get ![]() cm-2.
We further checked that
this global
cm-2.
We further checked that
this global ![]() value is within the error bars, when this
parameter is independently free to vary for each spectrum. We report
in Table 3
the best-fitting blackbody parameters
(blackbody radius calculated assuming a distance of 7.4 kpc)
for the
six time intervals and in Figs. 9 and 10
the burst light curve and the data with the residuals in units of
value is within the error bars, when this
parameter is independently free to vary for each spectrum. We report
in Table 3
the best-fitting blackbody parameters
(blackbody radius calculated assuming a distance of 7.4 kpc)
for the
six time intervals and in Figs. 9 and 10
the burst light curve and the data with the residuals in units of
![]() for the
common fit.
for the
common fit.
The evolution of this isolated burst is similar to some of the bursts reported for this source in the RXTE burst catalog (Galloway et al. 2008).
5 Discussion
5.1 The soft state
The two XMM-Newton observations of 4U 1705-44 offer the
opportunity of
testing a self-consistent model for the 1.0-12.0 keV energy
band and,
using spectral fitting, probing the different accretion states in this
source. During SoftObs the source was in a high-flux, soft
state. The bolometric luminosity of the source was at ![]() 50% of
the Eddington limit, with most of the X-ray emission within the
observed 1-12 keV band (
50% of
the Eddington limit, with most of the X-ray emission within the
observed 1-12 keV band (![]() 70%). This state corresponds
to one of
the softest states ever observed for this source. Because most of the
flux, theoretically limited by the Eddington rate, is radiated at soft
energies (E<10 keV), we expect that
the spectrum is relatively weak
in hard X-rays, (Barret &
Olive 2002). Even considering the possible
presence of a nonthermal hard tail, which was reported when the
source luminosity corresponded to
70%). This state corresponds
to one of
the softest states ever observed for this source. Because most of the
flux, theoretically limited by the Eddington rate, is radiated at soft
energies (E<10 keV), we expect that
the spectrum is relatively weak
in hard X-rays, (Barret &
Olive 2002). Even considering the possible
presence of a nonthermal hard tail, which was reported when the
source luminosity corresponded to ![]() erg s-1(Piraino et al. 2007),
this characterization remains valid as the hard
tail flux amounted to only
erg s-1(Piraino et al. 2007),
this characterization remains valid as the hard
tail flux amounted to only ![]() 10%
of the total source luminosity.
10%
of the total source luminosity.
The spectrum can be well-fitted by the sum of two thermal components together with the reflection component. This model accounts for the energetics and spectral distribution between the different continuum components, if we associate the blackbody hard emission with the boundary layer (BL) emission (Done et al. 2002; Revnivtsev & Gilfanov 2006; Gilfanov et al. 2003). The boundary layer should, in fact, occupy a very small region between the inner disk radius and the surface of the NS, and theoretically, it should Comptonize seed photons from the disk and the surface of the NS in an optically thick corona in these high-accretion states (Popham & Sunyaev 2001), resulting in a saturated single-temperature Comptonization.
![\begin{figure}
\par\includegraphics[angle=-90,width=9cm,clip]{13758f9.eps} \vspace*{-2mm}
\end{figure}](/articles/aa/full_html/2010/08/aa13758-09/img82.png)
|
Figure 9: Light curve of the burst observed during HardObs, the start time of the first time interval used for spectral analysis is time = 20 s in this plot. |
| Open with DEXTER | |
![\begin{figure}
\par\includegraphics[angle=-90,width=9cm,clip]{13758f10.eps} \vspace*{-2mm}
\end{figure}](/articles/aa/full_html/2010/08/aa13758-09/img83.png)
|
Figure 10: Data and residual with respect to the best-fitting model of the six time selected spectra of Table 3. |
| Open with DEXTER | |
The blackbody radius of the hard component is 5.5 km, a value that is
remarkably in agreement with the asymptotic value that we derived from
the analysis of the burst emission. Taking general relativistic effects
into account and the hardening of the spectrum (Shimura
& Takahara 1995), this radius is compatible with an
emission region of size comparable to the NS surface. The disk and the
BL have comparable fluxes with a luminosity ratio ![]() (assuming a spherical isotropic emission for the BL and neglecting the
reflection contribution) or 2.0 (considering the sum of the reflection
emission and the hard component).
(assuming a spherical isotropic emission for the BL and neglecting the
reflection contribution) or 2.0 (considering the sum of the reflection
emission and the hard component).
We can express the ratio of these two components in terms of
the outer
boundary layer radius, which can be written in units of the NS radius
as ![]() ,
and of the spin frequency of the NS, which can be
written as a fraction of the breakup spin frequency,
,
and of the spin frequency of the NS, which can be
written as a fraction of the breakup spin frequency, ![]() (Popham & Sunyaev 2001),
(Popham & Sunyaev 2001),
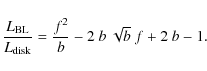
|
(1) |
The spin frequency of the NS is not known; however, the difference between the upper and the lower kHz QPOs is, in some sources, near the true spin frequency (see Méndez & Belloni 2007; van der Klis 2004). In 4U 1705-44, this difference is
The thermal disk component normalization N
is related to the inner
disk radius by the simple expression ![]() ,
where D is the distance expressed in units of
10 kpc and
,
where D is the distance expressed in units of
10 kpc and
![]() is the
inclination angle. Using a distance of 7.4 kpc and an
inclination angle of 35
is the
inclination angle. Using a distance of 7.4 kpc and an
inclination angle of 35![]() ,
we obtain a best-fitting value of
11.4 km. However, this value is generally considered an
underestimation of the true inner radius by a factor of
,
we obtain a best-fitting value of
11.4 km. However, this value is generally considered an
underestimation of the true inner radius by a factor of ![]() 2
(Merloni et al. 2000).
Taking these corrective factors into account, we
derive an inner disk radius of
2
(Merloni et al. 2000).
Taking these corrective factors into account, we
derive an inner disk radius of ![]() 10
10 ![]() ,
consistent with the
smearing factor of the reflection component and with our estimate of
the outer boundary layer radius as derived by the ratio of the
continuum fluxes (D'Aí
et al. 2007; D'Aì et al. 2009).
,
consistent with the
smearing factor of the reflection component and with our estimate of
the outer boundary layer radius as derived by the ratio of the
continuum fluxes (D'Aí
et al. 2007; D'Aì et al. 2009).
The reflection component in this state is remarkably strong,
and the
reprocessed flux at the disk surface is about 30% of the total
Comptonized component. Although most clearly determined by the shape
of the broad iron line, the reflection component, gives its strongest
contribution in the very soft X-ray band (below 1 keV there is 62% of
the overall bolometric flux of the component, with the dominant H-like
lines of oxygen and neon), where it can be as competitive as the disk
emission, as already noted by Ballantyne
(2004). In the 1-10 keV
range, the relative contribution is 33%, while above 10 keV, there is
only a 5% flux, owing to the very soft nature of the incident
flux. We calculated the reflection fraction (
![]() )
for
this model to be 0.23
)
for
this model to be 0.23 ![]() 0.01, a value that is consistent with our
proposed geometry of a compact illuminating source.
0.01, a value that is consistent with our
proposed geometry of a compact illuminating source.
The disk approaches the NS, and we obtain accurate constraints
from
the relativistically broadened reflection features, which set the
inner disk radius to less than 13 ![]() .
After comparing our
best-fitting model with the results of Di
Salvo et al. (2009), we note that
the blurring parameters agree quite well, with a difference only in
the outer radius, which in our model is found larger and in the
inclination angle, which is required to be somewhat lower (although
still compatible at 3
.
After comparing our
best-fitting model with the results of Di
Salvo et al. (2009), we note that
the blurring parameters agree quite well, with a difference only in
the outer radius, which in our model is found larger and in the
inclination angle, which is required to be somewhat lower (although
still compatible at 3![]() level). These differences are,
however, impressively small if we consider that we adopted here a
different continuum model and a self-consistent broadband reflection
model instead of local disklines.
level). These differences are,
however, impressively small if we consider that we adopted here a
different continuum model and a self-consistent broadband reflection
model instead of local disklines.
5.2 The hard state
Bright Z-sources accreting very close to the Eddington limit, do not show significant variation in the luminosity ratio between disk and coronal emission when they move along their Z-track on a color-color diagram, and the evolution of the spectral parameters is smooth, without jumps (e.g. D'Aí et al. 2007; Di Salvo et al. 2002; Agrawal & Sreekumar 2003).
Atoll sources, in contrast, resemble the spectral
decomposition of
bright Z-sources when they are in their soft state (also called
banana state), but strongly differ when they move
into the
hard state (also called island state). In this
state a very
soft component is occasionally detected (di Salvo et al. 2004; Barret
et al. 2000),
although the inferred emission radii are of a few kms, and some
authors identify this soft emission directly with the NS surface/BL
emission (Gierlinski
& Done 2002; Barret et al. 2003). The
luminosity is dominated
by a Comptonized spectrum, with moderate optical depth (
![]() )
and high-energy cut-offs between 30 and 100 keV. There is no
general agreement about what causes these state transitions, although
it is certain that the soft-hard and the hard-soft transitions are
switched at different luminosities giving rise to a hysteresis pattern
(Meyer-Hofmeister et al. 2005).
The difference in the switch luminosity is not,
however, universal, and 4U 1705-44 displays a small, or null,
hysteresis (Gladstone
et al. 2007). The luminosity that we derived using
the models 1-3 is within 2-
)
and high-energy cut-offs between 30 and 100 keV. There is no
general agreement about what causes these state transitions, although
it is certain that the soft-hard and the hard-soft transitions are
switched at different luminosities giving rise to a hysteresis pattern
(Meyer-Hofmeister et al. 2005).
The difference in the switch luminosity is not,
however, universal, and 4U 1705-44 displays a small, or null,
hysteresis (Gladstone
et al. 2007). The luminosity that we derived using
the models 1-3 is within 2-
![]() erg s-1,
which is
slightly below the threshold that Gladstone
et al. (2007) quotes for the
state transition of 4U 1705-44.
erg s-1,
which is
slightly below the threshold that Gladstone
et al. (2007) quotes for the
state transition of 4U 1705-44.
Comparing these results with the models proposed for the soft
state,
we note the very small contribution of the soft component to the
overall energy emission. The source accretes at levels less than 1%
![]() ,
so that the disk is theoretically expected to closely
approach the NS surface (at 1.1-1.2 R
,
so that the disk is theoretically expected to closely
approach the NS surface (at 1.1-1.2 R![]() ), because it has a flux
contribution higher, or similar, to the Comptonized component
(Popham & Sunyaev 2001).
But, as can be seen in Table 2,
any soft component would make only
), because it has a flux
contribution higher, or similar, to the Comptonized component
(Popham & Sunyaev 2001).
But, as can be seen in Table 2,
any soft component would make only ![]() 1/10 of the overall total
contribution. This aspect is well known as are the difficulties in the
spectral decomposition (see Lin
et al. 2007, for a complete discussion).
1/10 of the overall total
contribution. This aspect is well known as are the difficulties in the
spectral decomposition (see Lin
et al. 2007, for a complete discussion).
We showed the best-fitting parameters in Table 2, and the
residuals and the extrapolated models for three different
modelizations, which are able to describe the 1-10 keV energy
spectrum in Fig. 8.
The model with the lowest ![]() is Model 1, although the two other models cannot be
a priori ruled out, as the difference in
is Model 1, although the two other models cannot be
a priori ruled out, as the difference in ![]() is not significant and is given to tighter constraints imposed on
Models 2 and 3. We discuss hereafter the physical
implications of the three models, focusing on the combined broadband
continuum and line broadening mechanisms.
is not significant and is given to tighter constraints imposed on
Models 2 and 3. We discuss hereafter the physical
implications of the three models, focusing on the combined broadband
continuum and line broadening mechanisms.
5.2.1 Model 1
This model provides a very good fit to the data, and is also proposed
in Barret & Olive (2002)
for RXTE spectral analysis of the same source and
in Gierlinski & Done
(2002) for the atoll source 4U 1608-52. It closely
resembles the so-called Birmingham Model
(Church
& Baucinska-Church 2004; Church & Balucinska-Church 2001),
where the spectral decomposition is
resolved into a soft blackbody emission, ascribed to the boundary
layer, and a Comptonized emission that takes place in an extended
corona (coronal radius ![]() 109 cm)
caused by disk evaporation. The
inferred blackbody radius is rather small (
109 cm)
caused by disk evaporation. The
inferred blackbody radius is rather small (![]() km), but it can
be still consistent with a surface physically associated with the
BL. We derive good constraints for the Comptonized component on the
seed photon temperature and the thermal temperature of the electron
cloud. When comparing our results with Barret
& Olive (2002), we observe
that the soft blackbody component has a much lower temperature
(0.3 keV against 1 keV), while the electron
temperature is well consistent
with the RXTE results. The discrepancy is, however, explicable
considering the much better low energy coverage of the spectrum
offered by XMM-Newton, while the RXTE data start only from
3 keV, not
allowing any distinction between the Comptonized curvature at the
seed-photon temperature and the contribution of any other soft thermal
component. (In Barret & Olive
2002, the seed-photon temperature is, in
fact, kept frozen to a reference value of 0.4 keV because not
constrained by the fit.)
km), but it can
be still consistent with a surface physically associated with the
BL. We derive good constraints for the Comptonized component on the
seed photon temperature and the thermal temperature of the electron
cloud. When comparing our results with Barret
& Olive (2002), we observe
that the soft blackbody component has a much lower temperature
(0.3 keV against 1 keV), while the electron
temperature is well consistent
with the RXTE results. The discrepancy is, however, explicable
considering the much better low energy coverage of the spectrum
offered by XMM-Newton, while the RXTE data start only from
3 keV, not
allowing any distinction between the Comptonized curvature at the
seed-photon temperature and the contribution of any other soft thermal
component. (In Barret & Olive
2002, the seed-photon temperature is, in
fact, kept frozen to a reference value of 0.4 keV because not
constrained by the fit.)
We note, however, that the blackbody temperature is too low to be associated with the reprocessed emission from the NS surface, while it is physically implausible to observe seed photons for the Comptonized component more energetic than the emitted photons for the BL or the NS surface. We find it more reasonable, on the basis of the results of the soft state, to consider that the continuum soft component still needs to be associated with the thermal disk emission, while the Comptonized emission continues between the inner edge of the accretion disk and the surface of the NS.
5.2.2 Model 2
In analogy with soft state, this model ascribes the softer continuum
component to thermal disk emission and the harder component to
Comptonized emission. We tried two spectral solutions to check, at
least as a first order approximation, that the iron line broadness
could still be interpreted in terms of disk reflection. An optically
thick, geometrically thin disk must, therefore, be present, so we
tried in Model 2 to fit the low-energy X-ray band with a disk
emission, whose inner radius would match an ![]()
![]() ,
as is theoretically expected (Popham
& Sunyaev 2001). This
corresponds to fixing the normalization of the diskbb
component to 70, a value we found to lie within the error box, if the
parameter is left free to vary. The reflection component requires a
,
as is theoretically expected (Popham
& Sunyaev 2001). This
corresponds to fixing the normalization of the diskbb
component to 70, a value we found to lie within the error box, if the
parameter is left free to vary. The reflection component requires a
![]() temperature between 1.5 keV and 2.1 keV.
temperature between 1.5 keV and 2.1 keV.
The degree of smearing, given by the constraints imposed on
the
rdblur component are sufficient to adequately
describe the
iron line broadness. In this case, the reflection has a lower
subtended angle with respect to SoftObs, and the percentage ratio of
the extrapolated fluxes between the corona and the reflection
component is ![]() 4%,
which can physically correspond to a
geometrical shrinking of the area of the BL, which from a
quasi-spherical shape around the NS in the soft state, is expected to
decrease its area to an equatorial belt of a few kilometers diameter
(Inogamov & Sunyaev 1999).
Half of the reflected energy is absorbed and
re-emitted at energies less than 1 keV, while a higher fraction, about
20%, with respect to the soft state, emerges above 10 keV.
4%,
which can physically correspond to a
geometrical shrinking of the area of the BL, which from a
quasi-spherical shape around the NS in the soft state, is expected to
decrease its area to an equatorial belt of a few kilometers diameter
(Inogamov & Sunyaev 1999).
Half of the reflected energy is absorbed and
re-emitted at energies less than 1 keV, while a higher fraction, about
20%, with respect to the soft state, emerges above 10 keV.
This modelization has, however, the main flaw of unexplaining
the
strong difference in the fluxes of the two components (more than a
factor of 10). A similar spectral decomposition is also possible for
black hole sources in their low/hard states, where a very soft
component, together with a reflection component arising in an
untruncated accretion disk, is claimed to be present by some authors
(Miller
et al. 2006b,a; Rykoff et al. 2007), but
it is rejected by others
(Done &
Gierlinski 2006; Gierlinski et al. 2008;
D'Angelo
et al. 2008; Cabanac et al. 2009; Hiemstra
et al. 2009). However, in black holes, there is no
balance required in
the energetics of the components that make up the overall X-ray
emission, as the quantity of energy advected beyond the event horizon
is an unknown variable. In contrast, in X-ray systems harboring a
neutron star, all the accretion energy must be dissipated and released
as visible electromagnetic radiation (excluding any strong beaming
effect that could arise in a state, but not in an another). Because
the spectral solution that we envisioned for SoftObs is perfectly
consistent with the presence of a standard accretion disk truncated at
![]() 2
2
![]() ,
from an energetic distribution between the spectral
components, we conclude that, although statistically consistent, Model
2 lacks a correspondingly coherent physical scenario. It is,
therefore, possible that the disk structure strongly departs from the
standard Shakura-Sunyaev
,
from an energetic distribution between the spectral
components, we conclude that, although statistically consistent, Model
2 lacks a correspondingly coherent physical scenario. It is,
therefore, possible that the disk structure strongly departs from the
standard Shakura-Sunyaev ![]() -disk
model, becoming less
energetically efficient or losing its thinness (Maccarone & Coppi 2003;
Meyer-Hofmeister
et al. 2005; Dullemond & Spruit 2005).
-disk
model, becoming less
energetically efficient or losing its thinness (Maccarone & Coppi 2003;
Meyer-Hofmeister
et al. 2005; Dullemond & Spruit 2005).
Recently, Taam et al.
(2008) explored this scenario for the low/hard
states of black holes, finding that at luminosities of a few percent
of the Eddington limit, a cool, underfed, disk can be formed by
condensation of coronal matter onto the disk. This disk would be
under-luminous with respect to a standard ![]() -disk and still act
as a reflecting medium for coronal photons. However, the shape of the
reflection component would be strongly influenced by
Compton-scattering in the corona, if its optical thickness is much
higher than 1, as observed in the hard state of this source, and the
line should be strongly smeared and practically undetectable
(see the discussion in Di Salvo
et al. 2005). We are therefore led to
consider a different scenario, where still we have a standard
accretion disk, but truncated at some distance from the neutron star
by an unknown physical switch (magnetic pressure of the B-field of the
NS or change in the accretion flow or evaporation or a still unknown
physical mechanism).
-disk and still act
as a reflecting medium for coronal photons. However, the shape of the
reflection component would be strongly influenced by
Compton-scattering in the corona, if its optical thickness is much
higher than 1, as observed in the hard state of this source, and the
line should be strongly smeared and practically undetectable
(see the discussion in Di Salvo
et al. 2005). We are therefore led to
consider a different scenario, where still we have a standard
accretion disk, but truncated at some distance from the neutron star
by an unknown physical switch (magnetic pressure of the B-field of the
NS or change in the accretion flow or evaporation or a still unknown
physical mechanism).
5.2.3 Model 3
This model revisits Model 2 by forcing a spectral solution consisting
of a truncated accretion disk, Comptonized boundary layer emission,
and reflection component. The model is adequate for describing the
shape of the line, and it is only marginally statistically less
favored than the two other models. The diskbb
normalization
is set to correspond to a truncated disk at 30 ![]() and the inner
radius of the reflection component is also frozen at the same
value. We are not interested, here, in evaluating where exactly the
disk is truncated, as we do not have the necessary statistical
constraints for it, but rather, we are interested in showing a
representative spectral solution, which is physically motivated and
still statistically acceptable.
and the inner
radius of the reflection component is also frozen at the same
value. We are not interested, here, in evaluating where exactly the
disk is truncated, as we do not have the necessary statistical
constraints for it, but rather, we are interested in showing a
representative spectral solution, which is physically motivated and
still statistically acceptable.
Constraining the normalization of the diskbb component to a higher value than for Model 2 produces in the best-fit a lower disk temperature (from 0.4 keV to 0.2 keV) and a lower Compton seed-photon temperature while it has no effect on the determination of the hard part of the spectrum and on the shape of the reflection component.
We observe a large change in the ionization parameter of the
irradiated disk when we compare the reflection component in the hard
and soft states. The ![]() parameter, defined:
parameter, defined:

|
(2) |
can be used to compare the changes in the impinging flux, assuming that density and distance do not strongly differ in the two observations.
From ![]() and the results quoted in
Tables 1
and 2,
we would expect a
change in the fluxes of an order of magnitude, which corresponds to
the flux ratio of the hard blackbody component of the soft state and
the Comptonized flux of HardObs. We also calculated the reflection
fraction for this hard state. However, because the hard continuum
component in this state is a thermal Comptonized component and not a
blackbody, we measured the reflection fraction only in the restricted
energy band (5.5-8 keV), where we approximated the continuum
emission
with a blackbody-like spectrum. We obtained a value consistent with
the reflection fraction in the soft state (0.2
and the results quoted in
Tables 1
and 2,
we would expect a
change in the fluxes of an order of magnitude, which corresponds to
the flux ratio of the hard blackbody component of the soft state and
the Comptonized flux of HardObs. We also calculated the reflection
fraction for this hard state. However, because the hard continuum
component in this state is a thermal Comptonized component and not a
blackbody, we measured the reflection fraction only in the restricted
energy band (5.5-8 keV), where we approximated the continuum
emission
with a blackbody-like spectrum. We obtained a value consistent with
the reflection fraction in the soft state (0.2 ![]() 0.1), but with a
larger uncertainty. This value indicates that the geometry has not
noticeably changed and that the scenario of a compact illuminating
source is still valid.
0.1), but with a
larger uncertainty. This value indicates that the geometry has not
noticeably changed and that the scenario of a compact illuminating
source is still valid.
5.3 The reflection scenario in the hard and soft states
The analysis of the XMM-Newton data in the soft state of 4U 1705-44 presented in this work confirms the results of Di Salvo et al. (2009) regarding the reflection origin of the local emission and absorption features and their relativistic broadening. Our re-analysis excludes any possible influence of pile-up on the spectral modeling of the continuum and of the broad emission lines. Still, the quality of the data allows for tight constraints on the main spectral parameters that are at the origin of the broadening.
In Di Salvo et al.
(2009), the spectrum shows also a broad feature in
absorption seen at 8-8.5 keV, which has been interpreted as a
gravitationally red-shifted smeared K![]() absorption edge of
He-like iron ions. The presence and the degree of this smearing,
however, becomes very significant only when the central row of the
Epic-pn CCD is considered. In our re-analysis (that reduces the
statistics of a factor of 2 with respect to a spectrum
extracted
including the central row), the absorption edge is detected at a
weaker confidence (
absorption edge of
He-like iron ions. The presence and the degree of this smearing,
however, becomes very significant only when the central row of the
Epic-pn CCD is considered. In our re-analysis (that reduces the
statistics of a factor of 2 with respect to a spectrum
extracted
including the central row), the absorption edge is detected at a
weaker confidence (
![]() ,
with 3 d.o.f. more, than
for the same spectral model of Di
Salvo et al. (2009) without the smeared
edge), but the best-fitting spectral parameters remain consistent with
the values reported in Di Salvo
et al. (2009). In our re-analysis both the
absorption and the emission processes are consistently described by a
smeared broadband reflection model that has a blackbody prescription
for the irradiating source photons.
,
with 3 d.o.f. more, than
for the same spectral model of Di
Salvo et al. (2009) without the smeared
edge), but the best-fitting spectral parameters remain consistent with
the values reported in Di Salvo
et al. (2009). In our re-analysis both the
absorption and the emission processes are consistently described by a
smeared broadband reflection model that has a blackbody prescription
for the irradiating source photons.
Suzaku data of 4U 1705-44 also support the reflection scenario
interpretation for the observed broad features (Reis
et al. 2009).
Although the spectral decomposition is different, both the present
work and the analysis of the Suzaku data clearly indicate that the
reflection component can vary according to the accretion state of the
source, that the source is seen at an intermediate inclination angle
(30 ![]() 1 deg in the Suzaku fits), that relativistic effects
dominate because they arise from an accretion disk extremely close to
the compact object (
1 deg in the Suzaku fits), that relativistic effects
dominate because they arise from an accretion disk extremely close to
the compact object (
![]()
![]() in the
Suzaku fits), and that the ionization degree of the disk reflecting
matter strongly depends from the accretion state of the source (with
ionization parameter values ranging from 10 to
3500 erg cm2 s-1
in the Suzaku fits). The model of the present paper shows,
however, some important differences with respect to the model adopted
in Reis et al. (2009):
the continuum thermal disk emission is consistent
with a thermally hot accretion disk, close to the NS surface; the
reflection model has a different prescription regarding the spectral
shape of the disk illuminating primary source; i.e., we propose that,
during the soft state, the Comptonized component approaches a
blackbody-like spectrum and this is the source of the primary
impinging radiation on the disk, whereas in Reis
et al. (2009), the
reflionx table model (Ross
& Fabian 2005) has been used, which
assumes a power-law spectral distribution of the irradiating flux. We
showed that the interpretation of a thermalized source for the disk's
illuminating source is justified both by theory and by good
model-to-data fitting for the soft state.
in the
Suzaku fits), and that the ionization degree of the disk reflecting
matter strongly depends from the accretion state of the source (with
ionization parameter values ranging from 10 to
3500 erg cm2 s-1
in the Suzaku fits). The model of the present paper shows,
however, some important differences with respect to the model adopted
in Reis et al. (2009):
the continuum thermal disk emission is consistent
with a thermally hot accretion disk, close to the NS surface; the
reflection model has a different prescription regarding the spectral
shape of the disk illuminating primary source; i.e., we propose that,
during the soft state, the Comptonized component approaches a
blackbody-like spectrum and this is the source of the primary
impinging radiation on the disk, whereas in Reis
et al. (2009), the
reflionx table model (Ross
& Fabian 2005) has been used, which
assumes a power-law spectral distribution of the irradiating flux. We
showed that the interpretation of a thermalized source for the disk's
illuminating source is justified both by theory and by good
model-to-data fitting for the soft state.
This assumption may not be true for hard states, because the Comptonized component is no longer optically thick, and the spectrum substantially hardens, with most of its flux above 10 keV. Therefore, to test both the continuum model and the shape of the reflected component, a coverage of the hard X-ray spectrum (above 10 keV) is essential. If the nature of the disk's impinging radiation is still quite soft, with a low ionizing temperature (less than 3 keV), then no reflection Compton curvature is expected at higher energies, while a Compton bump should be present, together with the fluorescence emission lines, in the case of an extended power-law impinging spectrum. A claim of a detected reflection Compton bump has been made by Fiocchi et al. (2007) using INTEGRAL data; however, the strength of the Compton bump was not correlated with the iron line flux, and this would contradict a common physical origin.
6 Conclusions
We have examined and compared two XMM-Newton observations of the Atoll
source 4U 1705-44, in a soft and in a hard spectral state. The soft
state is characterized by three main spectral components: a
multicolored thermal disk emission, a harder, blackbody-like, boundary
layer emission, and a relativistically smeared reflection component. A
self-consistent model of reflection has been successfully applied to
fit the data, where the incident spectrum is assumed to have a
blackbody shape. We have shown that the temperature of this thermal
irradiating flux is consistent with the thermal boundary layer
temperature and found from independent constraints that the inner disk
radius, coincident with the outer boundary layer radius is located at
a distance of ![]() 2
2
![]() .
The second observation, taken when
the source is in the hard state, is also characterized by a broad
emission feature in the iron range, although its physical origin
appears less constrained because of the much lower statistics and lack
of high-energy response. We applied different modelizations, and with
the constraints obtained in the analysis of the soft observation, we
showed and discussed three possible spectral decompositions. The
scenario that appears more successful in data fitting and in its
physical implications is a model of very soft thermal disk emission,
with an inner edge truncated at relatively large distance from the NS
(between 20
.
The second observation, taken when
the source is in the hard state, is also characterized by a broad
emission feature in the iron range, although its physical origin
appears less constrained because of the much lower statistics and lack
of high-energy response. We applied different modelizations, and with
the constraints obtained in the analysis of the soft observation, we
showed and discussed three possible spectral decompositions. The
scenario that appears more successful in data fitting and in its
physical implications is a model of very soft thermal disk emission,
with an inner edge truncated at relatively large distance from the NS
(between 20 ![]() and 90
and 90 ![]() )
and a thermal Comptonized emission.
The width of the iron line in this state, can still be explained
within the reflection scenario, even with a truncated accretion
disk. Although the line is intrinsically broad, it does not show any
evidence of asymmetry, because of the lower statistics with respect to
the soft state observation and because relativistic effects are
strongly reduced if the disk is truncated at a greater distance from
the NS. To address the nature of the reflection component in the hard
states, we still need good spectral coverage of the overall X-ray
emission, in the soft (less than 1 keV) range to better
constrain the
continuum disk emission, in the iron range to resolve the shape of the
iron line, and in the hard (above 10 keV) range to constrain
the
reflection Compton-scattered continuum.
)
and a thermal Comptonized emission.
The width of the iron line in this state, can still be explained
within the reflection scenario, even with a truncated accretion
disk. Although the line is intrinsically broad, it does not show any
evidence of asymmetry, because of the lower statistics with respect to
the soft state observation and because relativistic effects are
strongly reduced if the disk is truncated at a greater distance from
the NS. To address the nature of the reflection component in the hard
states, we still need good spectral coverage of the overall X-ray
emission, in the soft (less than 1 keV) range to better
constrain the
continuum disk emission, in the iron range to resolve the shape of the
iron line, and in the hard (above 10 keV) range to constrain
the
reflection Compton-scattered continuum.
Note added in proof. During the peer review process
of the present manuscript, we become aware of a similar and related
work appeared on the arxiv.org pages by Cackett
et al. (2009).
References
- Agrawal, V. K., & Sreekumar, P. 2003, MNRAS, 346, 933 [NASA ADS] [CrossRef] [Google Scholar]
- Arnaud, K. A. 1996, in Astronomical Data Analysis Software and Systems V, ed. G. H. Jacoby, & J. Barnes, ASP Conf. Ser., 101, 17 [Google Scholar]
- Ballantyne, D. R. 2004, MNRAS, 351, 57 [NASA ADS] [CrossRef] [Google Scholar]
- Ballantyne, D. R., & Ross, R. R. 2002, MNRAS, 332, 777 [NASA ADS] [CrossRef] [Google Scholar]
- Ballantyne, D. R., & Strohmayer, T. E. 2004, ApJ, 602, L105 [NASA ADS] [CrossRef] [Google Scholar]
- Ballantyne, D. R., Ross, R. R., & Fabian, A. C. 2001, MNRAS, 327, 10 [NASA ADS] [CrossRef] [Google Scholar]
- Barret, D., & Olive, J.-F. 2002, ApJ, 576, 391 [NASA ADS] [CrossRef] [Google Scholar]
- Barret, D., Olive, J. F., Boirin, L., et al. 2000, ApJ, 533, 329 [NASA ADS] [CrossRef] [Google Scholar]
- Barret, D., Olive, J. F., & Oosterbroek, T. 2003, A&A, 400, 643 [NASA ADS] [CrossRef] [EDP Sciences] [Google Scholar]
- Bhattacharyya, S., & Strohmayer, T. E. 2007, ApJ, 664, L103 [NASA ADS] [CrossRef] [Google Scholar]
- Boirin, L., & Parmar, A. N. 2003, A&A, 407, 1079 [NASA ADS] [CrossRef] [EDP Sciences] [Google Scholar]
- Cabanac, C., Fender, R. P., Dunn, R. J. H., & Körding, E. G. 2009, MNRAS, 396, 1415 [NASA ADS] [CrossRef] [Google Scholar]
- Cackett, E. M., Miller, J. M., Bhattacharyya, S., et al. 2008, ApJ, 674, 415 [NASA ADS] [CrossRef] [Google Scholar]
- Cackett, E. M., Miller, J. M., Ballantyne, D. R., et al. 2009, ApJ, submitted [arXiv:0908.1098] [Google Scholar]
- Church, M. J., & Balucinska-Church, M. 2001, A&A, 369, 915 [NASA ADS] [CrossRef] [EDP Sciences] [Google Scholar]
- Church, M. J., & Ba▯ucinska-Church, M. 2004, MNRAS, 348, 955 [NASA ADS] [CrossRef] [Google Scholar]
- D'Aì, A., Iaria, R., Di Salvo, T., Matt, G., & Robba, N. R. 2009, ApJ, 693, L1 [NASA ADS] [CrossRef] [Google Scholar]
- D'Aí, A., Zycki, P., Di Salvo, T., et al. 2007, ApJ, 667, 411 [NASA ADS] [CrossRef] [Google Scholar]
- D'Angelo, C., Giannios, D., Dullemond, C., & Spruit, H. 2008, A&A, 488, 441 [NASA ADS] [CrossRef] [EDP Sciences] [Google Scholar]
- den Herder, J. W., Brinkman, A. C., Kahn, S. M., et al. 2001, A&A, 365, L7 [NASA ADS] [CrossRef] [EDP Sciences] [Google Scholar]
- Di Salvo, T., D'Aí, A., Iaria, R., et al. 2009, MNRAS, 398, 2022 [NASA ADS] [CrossRef] [Google Scholar]
- Di Salvo, T., Farinelli, R., Burderi, L., et al. 2002, A&A, 386, 535 [NASA ADS] [CrossRef] [EDP Sciences] [Google Scholar]
- Di Salvo, T., Iaria, R., Méndez, M., et al. 2005, ApJ, 623, L121 [NASA ADS] [CrossRef] [Google Scholar]
- di Salvo, T., Santangelo, A., & Segreto, A. 2004, Nucl. Phys. B Proc. Suppl., 132, 446 [Google Scholar]
- Done, C., & Gierlinski, M. 2006, MNRAS, 367, 659 [NASA ADS] [CrossRef] [Google Scholar]
- Done, C., Zycki, P. T., & Smith, D. A. 2002, MNRAS, 331, 453 [NASA ADS] [CrossRef] [Google Scholar]
- Dullemond, C. P., & Spruit, H. C. 2005, A&A, 434, 415 [NASA ADS] [CrossRef] [EDP Sciences] [Google Scholar]
- Fabian, A. C., Rees, M. J., Stella, L., & White, N. E. 1989, MNRAS, 238, 729 [NASA ADS] [CrossRef] [Google Scholar]
- Fiocchi, M., Bazzano, A., Ubertini, P., & Zdziarski, A. A. 2007, ApJ, 657, 448 [NASA ADS] [CrossRef] [Google Scholar]
- Ford, E. C., van der Klis, M., van Paradijs, J., et al. 1998, ApJ, 508, L155 [NASA ADS] [CrossRef] [Google Scholar]
- Forman, W., Jones, C., Cominsky, L., et al. 1978, ApJS, 38, 357 [NASA ADS] [CrossRef] [Google Scholar]
- Galloway, D. K., Muno, M. P., Hartman, J. M., Psaltis, D., & Chakrabarty, D. 2008, ApJS, 179, 360 [NASA ADS] [CrossRef] [Google Scholar]
- Gierlinski, M., & Done, C. 2002, MNRAS, 331, L47 [NASA ADS] [CrossRef] [Google Scholar]
- Gierlinski, M., Done, C., & Page, K. 2008, MNRAS, 388, 753 [NASA ADS] [CrossRef] [Google Scholar]
- Gilfanov, M., Revnivtsev, M., & Molkov, S. 2003, A&A, 410, 217 [NASA ADS] [CrossRef] [EDP Sciences] [Google Scholar]
- Gladstone, J., Done, C., & Gierlinski, M. 2007, MNRAS, 378, 13 [Google Scholar]
- Gottwald, M., Haberl, F., Langmeier, A., et al. 1989, ApJ, 339, 1044 [NASA ADS] [CrossRef] [Google Scholar]
- Haberl, F., & Titarchuk, L. 1995, A&A, 299, 414 [NASA ADS] [Google Scholar]
- Hasinger, G., & van der Klis, M. 1989, A&A, 225, 79 [NASA ADS] [Google Scholar]
- Hiemstra, B., Soleri, P., Méndez, M., et al. 2009, MNRAS, 394, 2080 [NASA ADS] [CrossRef] [Google Scholar]
- Homan, J., Kaplan, D. L., van den Berg, M., & Young, A. J. 2009, ApJ, 692, 73 [NASA ADS] [CrossRef] [Google Scholar]
- Iaria, R., D'Aí, A., di Salvo, T., et al. 2009, A&A, 505, 1143 [NASA ADS] [CrossRef] [EDP Sciences] [Google Scholar]
- Inogamov, N. A., & Sunyaev, R. A. 1999, Astron. Lett., 25, 269 [NASA ADS] [Google Scholar]
- Jansen, F., Lumb, D., Altieri, B., et al. 2001, A&A, 365, L1 [NASA ADS] [CrossRef] [EDP Sciences] [Google Scholar]
- Langmeier, A., Sztajno, M., Hasinger, G., Truemper, J., & Gottwald, M. 1987, ApJ, 323, 288 [NASA ADS] [CrossRef] [Google Scholar]
- Lin, D., Remillard, R. A., & Homan, J. 2007, ApJ, 667, 1073 [NASA ADS] [CrossRef] [Google Scholar]
- Maccarone, T. J., & Coppi, P. S. 2003, MNRAS, 338, 189 [NASA ADS] [CrossRef] [Google Scholar]
- Makishima, K., Maejima, Y., Mitsuda, K., et al. 1986, ApJ, 308, 635 [NASA ADS] [CrossRef] [Google Scholar]
- Matt, G., Guainazzi, M., & Maiolino, R. 2003, MNRAS, 342, 422 [NASA ADS] [CrossRef] [Google Scholar]
- Méndez, M., & Belloni, T. 2007, MNRAS, 381, 790 [NASA ADS] [CrossRef] [Google Scholar]
- Merloni, A., Fabian, A. C., & Ross, R. R. 2000, MNRAS, 313, 193 [NASA ADS] [CrossRef] [Google Scholar]
- Meyer-Hofmeister, E., Liu, B. F., & Meyer, F. 2005, A&A, 432, 181 [NASA ADS] [CrossRef] [EDP Sciences] [Google Scholar]
- Miller, J. M., Homan, J., & Miniutti, G. 2006a, ApJ, 652, L113 [NASA ADS] [CrossRef] [Google Scholar]
- Miller, J. M., Homan, J., Steeghs, D., et al. 2006b, ApJ, 653, 525 [NASA ADS] [CrossRef] [Google Scholar]
- Nayakshin, S., & Kazanas, D. 2002, ApJ, 567, 85 [NASA ADS] [CrossRef] [Google Scholar]
- Nayakshin, S., Kazanas, D., & Kallman, T. R. 2000, ApJ, 537, 833 [NASA ADS] [CrossRef] [Google Scholar]
- Olive, J.-F., Barret, D., & Gierlinski, M. 2003, ApJ, 583, 416 [NASA ADS] [CrossRef] [Google Scholar]
- Pandel, D., Kaaret, P., & Corbel, S. 2008, ApJ, 688, 1288 [NASA ADS] [CrossRef] [Google Scholar]
- Papitto, A., Di Salvo, T., D'Aì, A., et al. 2009, A&A, 493, L39 [NASA ADS] [CrossRef] [EDP Sciences] [Google Scholar]
- Piraino, S., Santangelo, A., di Salvo, T., et al. 2007, A&A, 471, L17 [NASA ADS] [CrossRef] [EDP Sciences] [Google Scholar]
- Popham, R., & Sunyaev, R. 2001, ApJ, 547, 355 [NASA ADS] [CrossRef] [Google Scholar]
- Raymond, J. C. 1993, ApJ, 412, 267 [NASA ADS] [CrossRef] [Google Scholar]
- Reis, R. C., Fabian, A. C., & Young, A. J. 2009, MNRAS, 399, L1 [NASA ADS] [CrossRef] [Google Scholar]
- Revnivtsev, M. G., & Gilfanov, M. R. 2006, A&A, 453, 253 [NASA ADS] [CrossRef] [EDP Sciences] [Google Scholar]
- Ross, R. R., & Fabian, A. C. 2005, MNRAS, 358, 211 [Google Scholar]
- Rózanska, A., Dumont, A., Czerny, B., & Collin, S. 2002, MNRAS, 332, 799 [NASA ADS] [CrossRef] [Google Scholar]
- Rykoff, E. S., Miller, J. M., Steeghs, D., & Torres, M. A. P. 2007, ApJ, 666, 1129 [NASA ADS] [CrossRef] [Google Scholar]
- Shimura, T., & Takahara, F. 1995, ApJ, 445, 780 [NASA ADS] [CrossRef] [Google Scholar]
- Strüder, L., Briel, U., Dennerl, K., et al. 2001, A&A, 365, L18 [NASA ADS] [CrossRef] [EDP Sciences] [Google Scholar]
- Taam, R. E., Liu, B. F., Meyer, F., & Meyer-Hofmeister, E. 2008, ApJ, 688, 527 [NASA ADS] [CrossRef] [Google Scholar]
- Titarchuk, L. 1994, ApJ, 434, 570 [NASA ADS] [CrossRef] [Google Scholar]
- Turner, M. J. L., Abbey, A., Arnaud, M., et al. 2001, A&A, 365, L27 [NASA ADS] [CrossRef] [EDP Sciences] [Google Scholar]
- van der Klis, M. 2004, ArXiv Astrophysics e-prints [Google Scholar]
- Verner, D. A., Ferland, G. J., Korista, K. T., & Yakovlev, D. G. 1996, ApJ, 465, 487 [NASA ADS] [CrossRef] [Google Scholar]
- Wijnands, R., van der Klis, M., Mendez, M., et al. 1998, ApJ, 495, L39 [NASA ADS] [CrossRef] [Google Scholar]
- Wilms, J., Allen, A., & McCray, R. 2000, ApJ, 542, 914 [NASA ADS] [CrossRef] [Google Scholar]
- Zycki, P. T., & Czerny, B. 1994, MNRAS, 266, 653 [NASA ADS] [CrossRef] [Google Scholar]
- Zycki, P. T., Krolik, J. H., Zdziarski, A. A., & Kallman, T. R. 1994, ApJ, 437, 597 [NASA ADS] [CrossRef] [Google Scholar]
Footnotes
- ... 1705-44
- Based on observations obtained with XMM-Newton, an ESA science mission with instruments and contributions directly funded by ESA Member States and NASA.
- ...
affected
- The RGS2 frame time is double with respect to the RGS1 CCDs caused by an instrumental failure occurred in August 2007; the longer frame time makes the RGS2 CCDs more easily subject to pile-up.
All Tables
Table 1: Best-fitting values of the parameters obtained for the soft state of 4U 1705-44.
Table 2: Best-fitting values and associated errors for different modelization used to fit the hard state data of 4U 1705-44.
Table 3: Time-resolved spectral evolution of the burst emission.
All Figures
|
|
Figure 1: Long term X-ray light curve of 4U 1705-44. Data from the All Sky Monitor (2-10 keV range) onboard the Rossi XTE, from 1 January 2006 (MJD 53736) to 1 January 2009 (MJD 54832). The two arrows in the figure mark the day when the SoftObs (right arrow) and the HardObs (left arrow) took place. |
| Open with DEXTER | |
| In the text | |
|
|
Figure 2:
Light curves for SoftObs ( upper panel) and for
HardObs ( lower panel). In HardObs, a type I X-ray
burst is present at |
| Open with DEXTER | |
| In the text | |
|
|
Figure 3: Color-color diagram that shows the relative positions of the two observations. Each point represents a time segment of 500 s. SoftObs data in red, HardObs data in green. |
| Open with DEXTER | |
| In the text | |
|
|
Figure 4:
Residuals, in units of |
| Open with DEXTER | |
| In the text | |
|
|
Figure 5: Data and best-fitting model with individual components separately shown (top panels), together with residuals in units of sigma (lower panels). Left panel: the best-fitting model without the Ar XVIII and Ca XIX emission lines. Right panel: data and residuals using the best-fitting model of Table 1. |
| Open with DEXTER | |
| In the text | |
|
|
Figure 6:
Best fitting model in the |
| Open with DEXTER | |
| In the text | |
|
|
Figure 7: Left panel: data and residuals at the soft energies (0.6-3.0 keV), using an absorbed blackbody component. Residuals clearly display an S-shaped pattern in the Epic-pn data (black data) between 1.5 keV and 2.0 keV and a general mismatch between RGS data (green and red data) and Epic-pn data at softer energies. Data have been rebinned for clarity. Right panel: residuals in the iron range, when data 4.0-9.0 keV are fitted with Model 1 and the iron line is subtracted from the data. |
| Open with DEXTER | |
| In the text | |
|
|
Figure 8:
Right panels: XMM-Newton data and residuals
in units of |
| Open with DEXTER | |
| In the text | |
|
|
Figure 9: Light curve of the burst observed during HardObs, the start time of the first time interval used for spectral analysis is time = 20 s in this plot. |
| Open with DEXTER | |
| In the text | |
|
|
Figure 10: Data and residual with respect to the best-fitting model of the six time selected spectra of Table 3. |
| Open with DEXTER | |
| In the text | |
Copyright ESO 2010
Current usage metrics show cumulative count of Article Views (full-text article views including HTML views, PDF and ePub downloads, according to the available data) and Abstracts Views on Vision4Press platform.
Data correspond to usage on the plateform after 2015. The current usage metrics is available 48-96 hours after online publication and is updated daily on week days.
Initial download of the metrics may take a while.