| Issue |
A&A
Volume 516, June-July 2010
|
|
|---|---|---|
| Article Number | A2 | |
| Number of page(s) | 17 | |
| Section | Astronomical instrumentation | |
| DOI | https://doi.org/10.1051/0004-6361/200913677 | |
| Published online | 16 June 2010 | |
Fitting isochrones to open cluster photometric data
A new global optimization tool
H. Monteiro - W. S. Dias - T. C. Caetano
UNIFEI, DFQ - Instituto de Ciências Exatas, Universidade Federal de Itajubá, Itajubá MG, Brazil
Received 16 November 2009 / Accepted 17 March 2010
Abstract
We present a new technique to fit color-magnitude diagrams of open
clusters based on the cross-entropy global optimization algorithm. The
method uses theoretical isochrones available in the literature and
maximizes a weighted likelihood function based on distances measured in
the color-magnitude space. The weights are obtained through a non
parametric technique that takes into account the star distance to the
observed center of the cluster, observed magnitude uncertainties, the
stellar density profile of the cluster among others. The parameters
determined simultaneously are distance, reddening, age and metallicity.
The method takes binary fraction into account and uses a Monte-Carlo
approach to obtain uncertainties on the determined parameters for the
cluster by running the fitting algorithm many times with a re-sampled
data set through a bootstrapping procedure. We present results for
9 well studied open clusters, based on 15 distinct data sets, and
show that the results are consistent with previous studies. The method
is shown to be reliable and free of the subjectivity of most previous
visual isochrone fitting techniques.
Key words: open clusters and associations: general - methods: statistical
1 Introduction
Galactic open clusters are a key class of objects used in a wide range of investigations due to their wide span of ages and distances as well as the precision to which these parameters can be determined through their color-magnitude diagrams (CMD). With the publication of the Hipparcos Catalog (ESA 1997) and its derivatives the Tycho and Tycho2 (Høg et al. 2000; Perryman & ESA 1997) as well as individual efforts using modern ground based instrumentation there has been increased interest in studies involving open clusters in the Galaxy.
Individually the results obtained from the study of open clusters can provide important constraints for theoretical models of stellar formation and evolution. Comparison of observed CMDs to model isochrones can provide important information on the effect of overshooting VandenBerg & Stetson (2004) and chemical abundances Kassis et al. (1997); Meynet et al. (1993). Open clusters can also be used in the study of variable stars, especially Cepheids (Majaess et al. 2009; Kang et al. 2008), in the search for connections between stellar magnetic fields and their evolution and in the search for extra-terrestrial planets, among many others.
Our group has focused efforts in the investigation of open clusters and their use in the understanding of the Galactic spiral structure (Lépine et al. 2008; Dias & Lépine 2005). The results are based on the catalog of open clusters published in Dias et al. (2002) witch is now in version 2.10 and, since 2002, can be accessed on line at http://www.astro.iag.usp.br/ wilton.
The results presented in our catalog are compiled from data published from many authors, using different instruments, techniques, calibrations and criteria which results in a heterogeneous sample. However, in Paunzen & Netopil (2006), the authors show that our data has the same statistical significance as the data they use to define the standard parameters of the chosen open clusters when considering the calculated errors.
To derive the fundamental parameters of open clusters the main sequence ``fitting'' in most works up to today has been done mostly with subjective visual fitting. This is mainly due to the fact that the isochrones have no simple parametric form so that a usual least square technique can be applied. The available isochrones in the literature are usually in the form of tabulated points for a set of fundamental parameters such as age and metallicity. The traditional ``fitting'' method utilized is to first determine the reddening by adjusting a Zero Age Main Sequence (ZAMS) to the observed color-color diagram (usually (B-V) vs. (U-B) of the cluster and then, keeping this value fixed, adjusting the distance and age using the observed CMD and tabulated isochrones. Both of these steps are usually performed by eye as mentioned, leading to inevitable subjectivity in the fitting of an isochrone to a given observed CMD. The subjectivity in the determination of the reddening is specially problematic since it affects the subsequent determination of the distance and age of the cluster. It is also important to point out that in some cases the reddening is not determined through the use of U filter photometry which can further compromise the results obtained.
The lack of homogenization of the data and especially the subjectivity of the methods used to obtain fundamental parameters of clusters from their CMD indicate the great need for a method that circumvents at least the subjectivity. The subject of automatic fitting and non subjective criteria to choose the best fit was addressed in some papers such the recently published work by Naylor & Jeffries (2006), where the authors propose a maximum likelihood method for fitting two dimensional model distributions to stellar data in a CMD. In this work the authors also discuss the most important attempts at performing isochrone fits using different methods and we refer the reader to their very complete discussion and references therein. The authors also present the main problems involved in this kind of study, as the data precision (see also Narbutis et al. 2007), the importance of non resolved binaries (see Schlesinger 1975; Fernie & Rosenberg 1961 and in more modern observational studies von Hippel & Sarajedini 1998; Montgomery et al. 1993).
In this work we present a new technique to fit models to open cluster photometric data using a weighted likelihood criterion to define the goodness of fit and a global optimization algorithm known as cross-entropy to find the best fitting isochrone. We have successfully applied the optimization algorithm in the study of jet precession in active galactic nuclei (Caproni et al. 2009) where we demonstrate the robustness of the method. In the present work we adapt the method to study open clusters and show that it can find the best parameters and eliminate the subjectivity (author analysis dependence) of the main sequence fitting process by using well defined control parameters and a weighted likelihood.
In the next section we introduce the optimization technique and how it was adapted to the problem of ishocrone fitting. In Sect. 3. we define the likelihood function used and in Sect. 4 how the weight function is obtained. In Sect. 5 we demonstrate the validity of the method by applying it to synthetic clusters and in Sect. 6 we apply the method to the data of 9 clusters carefully chosen. In Sect. 7 we discuss the results and in Sect. 8 we give our final conclusions.
2 Cross entropy global optimization
2.1 The optimization method
The cross entropy (CE) technique was first introduced by Rubinstein (1997), with the objective of estimating probabilities of rare events in complex stochastic networks, having been modified later by Rubinstein (1999) to deal with continuous multi-extremal and discrete combinatorial optimization problems. Its theoretical asymptotic convergence has been demonstrated by Margolin (2005), while Kroese et al. (2006) studied the efficiency of the CE method in solving continuous multi-extremal optimization problems. Some examples of robustness of the CE method in several situations are listed in De Boer et al. (2004). The CE procedure uses concepts of importance sampling, which is a variance reduction technique, but removing the need for a priory knowledge of the reference parameters of the parent distribution. The CE procedure provides a simple adaptive way of estimating the optimal reference parameters. Basically, the CE method involves an iterative procedure where in each iteration the following is done:- (i)
- Random generation of the initial parameter sample, respecting pre-defined criteria;
- (ii)
- Selection of the best candidates based on some mathematical criterion;
- (iii)
- Random generation of updated parameter samples from the previous best candidates to be evaluated in the next iteration;
- (iv)
- Optimization process repeats steps (ii) and (iii) until a pre-specified stopping criterion is fulfilled.
Here we have implemented the CE method to find the best fitting model isochrone to open cluster data as discussed in the following sections.
2.2 Cross entropy isochrone fitting
Let us suppose that we wish to study a set of ![]() observational data in terms of an analytical model characterized by
observational data in terms of an analytical model characterized by ![]() parameters
parameters
![]() .
.
The main goal of the CE continuous multi-extremal optimization method
is to find a set of parameters p*i (
![]() )
for
which the model provides the best description of the data
(Rubinstein 1999; Kroese et al. 2006). It is performed generating randomly Nindependent sets of model parameters
)
for
which the model provides the best description of the data
(Rubinstein 1999; Kroese et al. 2006). It is performed generating randomly Nindependent sets of model parameters
![]() ,
where
,
where
![]() ,
and minimizing the
objective function
,
and minimizing the
objective function
![]() used to transmit the quality of the
fit during the run process. If the convergence to the exact solution
is achieved then
used to transmit the quality of the
fit during the run process. If the convergence to the exact solution
is achieved then
![]() ,
which means
,
which means
![]() .
.
In order to find the optimal solution from CE optimization, we start
by defining the parameter range in which the algorithm will search for
the best candidates:
![]() .
Introducing
.
Introducing
![]() and
and
![]() ,
we can compute
,
we can compute
![]() from:
from:
|
(1) |
where Gi,j is an
The next step is to calculate S for each component of
![]() ,
ordering them from the lowest to the highest value of S. Then the
first
,
ordering them from the lowest to the highest value of S. Then the
first
![]() set of parameters is selected, i.e. the
set of parameters is selected, i.e. the
![]() -samples with lower S-values, which will be labeled
hereafter as the elite sample array
-samples with lower S-values, which will be labeled
hereafter as the elite sample array
![]() .
.
Having determined
![]() at kth iteration, the mean
and standard deviation of the elite sample are calculated,
at kth iteration, the mean
and standard deviation of the elite sample are calculated,
![]() and
and
![]() respectively, using:
respectively, using:
| |
= | 
|
(2) |
| = | ![$\displaystyle \sqrt{\frac{1}{\left(N_{\rm elite}-1\right)}\sum\limits_{j=1}^{N_{\rm elite}}\left[X^{\rm elite}_{ji}-\bar{{\vec x}}^{\rm elite}_j(k)\right]^2}.$](/articles/aa/full_html/2010/08/aa13677-09/img24.png)
|
(3) |
In order to prevent convergence to a sub-optimal solution due to the intrinsic rapid convergence of the CE method, Kroese et al. (2006) suggested the implementation of a fixed smoothing scheme for
| |
= | (4) | |
| = | (5) |
where
|
(6) |
with
The array ![]() at kth iteration is determined analogously to
Eq. (1):
at kth iteration is determined analogously to
Eq. (1):
|
(7) |
The optimization stops when either the mean value of
3 Defining the likelihood
To implement an objective function we use a weighted likelihood
function similar to the one proposed by Flannery & Johnson (1982) and Hernandez & Valls-Gabaud (2008) to fit theoretical isochrones to star
cluster data. In the first work the authors derive what they called
the Near Point Estimator based on a Maximum Likelihood analysis of
cluster data where the fitting statistic measures the overall
coincidence of model isochrones and observed data, assuming uniform
star distribution along the isochrone. The Near Point Estimator is
derived in Flannery & Johnson (1982) and we refer the reader to this work for the
details. The authors show that the probability of a given measurement
to be a cluster star related to a given theoretical isochrone is given
by
![]() ,
where
,
where
![]() is the minimum
distance from the observed point to the model isochrone, being valid
for any number of distinct measurements. In the latter work the
authors use a similar method but take the Bayesian approach to solving
the problem by setting a likelihood function very similar to the Near
Point Estimator of the previous work. Both works relate the
probability of a given star of belonging to a given model isochrone to
distances in the CMD.
is the minimum
distance from the observed point to the model isochrone, being valid
for any number of distinct measurements. In the latter work the
authors use a similar method but take the Bayesian approach to solving
the problem by setting a likelihood function very similar to the Near
Point Estimator of the previous work. Both works relate the
probability of a given star of belonging to a given model isochrone to
distances in the CMD.
In this work we adopt a similar path to define our likelihood function
which will then be maximized by the CE method described
previously. The major difference is that we include a weighting
factor, discussed in detail below, in a semi-Bayesian approach, which
defines our prior knowledge based on the observed data-set. Unlike the
work of Flannery & Johnson (1982) we do not assume uniform distribution of stars
along the isochrone. To accomplish this we define the isochrone points
by sampling from an initial mass function (IMF), randomly generating a
number of stars in the mass range of the original isochrone. Because
we sample from a given IMF, we are also able to directly account for
binaries. We have done so assuming a binary fraction of 100% with
companions drawn randomly from the same IMF as the cluster
stars. With these randomly generated stars we obtain a synthetic
cluster which can be compared to the observed data set through a given
metric. Because this procedure populates the CMD in the correct manner
through the IMF there is no need to introduce approximations to
account for weights along the isochrone, therefore a statistic which
sums over the distances in magnitude space of a given observed star to
the generated points will give the observed point probability of
belonging to that specific model isochrone, which is calculated by:
| P(V,BV,UB|IN)l | = | (8) | |
![$\displaystyle {\rm EXP}\left [-\frac{1}{2}\left(\frac{V_l-{I_N}_{,V_m}} {\sigma_{V_l}} \right)^2 \right]$](/articles/aa/full_html/2010/08/aa13677-09/img44.png)
|
|||
![$\displaystyle {\rm EXP}\left[-\frac{1}{2}\left(\frac{BV_l-{I_N}_{,BV_m}}{\sigma_{BV_l}} \right)^2 \right]$](/articles/aa/full_html/2010/08/aa13677-09/img45.png)
|
|||
![$\displaystyle {\rm EXP}\left[-\frac{1}{2}\left(\frac{UB_{l}-{I_N}_{,UB_m}}{\sigma_{UB_l}} \right)^2 \right]$](/articles/aa/full_html/2010/08/aa13677-09/img46.png)
|
where IN is a tabulated Isochrone function defined by m points, Vl is the observed V magnitude, BVl and UBl the color indexes,
Because the IN isochrone is a discretely tabulated function, the
continuous optimization algorithm described previously was adapted to
find the nearest parameters thus introducing a grid resolution error
in the values obtained. The grid used is comprised of isochrones of
ages from
![]() to
to
![]() with a step of
with a step of
![]() .
The uncertainty resulting from the grid resolution
has been incorporated in the final quoted errors.
.
The uncertainty resulting from the grid resolution
has been incorporated in the final quoted errors.
The weighted likelihood function is then given in the usual manner by:
|
(9) |
where Wl is the weight for a given star as determined from the data using the non-parametric technique described in the following section.
The likelihood above is used to define the objective function
![]() of the optimization algorithm as follows:
of the optimization algorithm as follows:
| (10) |
where
4 Determining the weight function
Before determining the weights of each observed star we must first deal with the fact that the data is not free of contamination from stars that do not belong to the cluster itself. The contamination is usually from field stars that can be at different distances and have different reddening values than that of the cluster. Therefore we must introduce schemes to filter out contaminating stars as well as to determine which stars are more likely to belong to the cluster in a way that can be easily reproduced given simple and clear parameters.
4.1 Magnitude cut-off
The first step in the decontamination is to inspect the magnitude cut-off of the observations. In many cases the observations are clearly not complete down to the faintest magnitude as can be easily seen in the histogram of the observed V magnitude. With the V magnitude histogram, obtained with a bin size of 0.5, we determine in which magnitude it peaks and then reject stars that have magnitudes higher than this threshold. This procedure takes care of a good part of the contamination from faint stars, that are in fact intrinsically brighter and further away than the cluster itself and thus show up as faint stars in the CMD. However, this procedure is not sufficient to remove contamination from stars that are within the completeness limit of the observation.
The stars that are within the completeness limit of the observations are usually the main source of contamination in the fainter (lower mass) regions of the CMD where larger magnitude errors also contribute to the confusion. Typically when a field is very crowded and this contamination type is large, it can be identified as a triangular region where the stars concentrate with high density and no clear clustering around a main sequence. To treat these situations when there is high density of field stars and no detectable clustering around an isochrone main sequence we introduced a magnitude cut-off that can be defined by the user. Since the turn-off point and the red giant region of the open clusters are the two most important features that constrain the determination of fundamental parameters, this cut-off does not affect negatively their final value in most situations.
4.2 Cluster density profile
Having eliminated the most obvious types of contamination we proceed to estimating the weight of a given cluster star using non-parametric techniques. The main assumption made here is that cluster stars are concentrated in a limited region in the observed field and also in a specific region of the CMD assuming they formed according to a single isochrone. To determine the region in the observed field where the cluster stars are located we use the position of the cluster center, usually provided with the observational data set obtained from the literature. In some cases where this information is not provided it can be determined by obtaining a two dimensional histogram of star positions and determining the location of the peak, provided sufficient number of stars.
With the position of each star measured relative to the cluster center
we obtain their radial distance (measured in pixels). We then use the
radial distances to calculate the number of stars at a given radial
distance using a histogram. The bin size of the histogram is
calculated with
![]() ,
where
,
where ![]() is the
vector of all star radial distances. For a given cluster h bins will
determined and the density of stars as a function of radial distance
is then estimated by
is the
vector of all star radial distances. For a given cluster h bins will
determined and the density of stars as a function of radial distance
is then estimated by
![]() ,
where
Nh is the number of stars in the hth bin. Typically the density
profile of a cluster falls off as the radius increases. Integrating
this density profile we can define a cluster radius where we find a
given percentage of the total number of stars in the field. The user
defined percentage value, which we call star fraction or
,
where
Nh is the number of stars in the hth bin. Typically the density
profile of a cluster falls off as the radius increases. Integrating
this density profile we can define a cluster radius where we find a
given percentage of the total number of stars in the field. The user
defined percentage value, which we call star fraction or
![]() ,
is then used to define two regions, Cluster and Field, using the
following integral:
,
is then used to define two regions, Cluster and Field, using the
following integral:
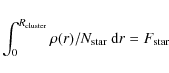
|
(11) |
where
4.3 Photometric uncertainty
To determine the weight of each star we also need the photometric
error
![]() of the observed data. The error is defined as a
percentage and errors for each star in magnitude and color are
calculated using this factor. For the color errors we assume that the
photometric errors in each filter are independent of each other and
therefore calculate the error with the usual propagation formula.
Since few works in the literature include a full study of the errors
involved in obtaining magnitudes we adopted values that were
consistent with the ones obtained by Moitinho (2001), where the author
presents error values for stars observed multiple times with the same
instrumentation. We also used the results of the filtering described
below to guide the final error value adopted, aiming for the most
efficient elimination of contamination.
of the observed data. The error is defined as a
percentage and errors for each star in magnitude and color are
calculated using this factor. For the color errors we assume that the
photometric errors in each filter are independent of each other and
therefore calculate the error with the usual propagation formula.
Since few works in the literature include a full study of the errors
involved in obtaining magnitudes we adopted values that were
consistent with the ones obtained by Moitinho (2001), where the author
presents error values for stars observed multiple times with the same
instrumentation. We also used the results of the filtering described
below to guide the final error value adopted, aiming for the most
efficient elimination of contamination.
4.4 Non-parametric weight function
![\begin{figure}
\par\includegraphics[scale=0.5]{fig-selected.ps}\includegraphics[scale=0.5]{fig-pesos.ps}
\vspace*{5mm}
\end{figure}](/articles/aa/full_html/2010/08/aa13677-09/img63.png)
|
Figure 1: Result of the decontamination ( left) and weighting process ( right) for the cluster NGC 2477. The black dots in the left graph are the selected stars after decontamination, the open circles are stars that fall outside the defined cluster radius and light dots are stars for which no statistic was available due to low numbers. The right graph shows open circles with sizes scaled to their weights, with larger sizes meaning larger weights. |
| Open with DEXTER | |
With the Cluster and Field regions as well as the photometric errors
defined, the weight for each star is then estimated by comparing the
characteristics of the stars in an area around the lth star in the
CMD defined by a box with dimensions 3
![]() by
3
by
3
![]() .
We then calculate the average and standard
deviation of V and (B-V) for the stars that fall within this box
and belong to the Cluster region defined earlier. The assumption made
here is that this statistic provides the most likely position for a
cluster star in the CMD region defined by the error box of the lth
observed star. This is clearly not the case when there is no
detectable concentration of cluster stars relative to field stars
within the error box. This situation is more likely to happen in
clusters with heavy field contamination and large magnitude errors as
in the lower magnitude regions of the CMD. However, as discussed
earlier the magnitude cut-off can resolve this issue by eliminating
these stars from the sample to be fitted. We then calculate the weight
for the lth star with the expression:
.
We then calculate the average and standard
deviation of V and (B-V) for the stars that fall within this box
and belong to the Cluster region defined earlier. The assumption made
here is that this statistic provides the most likely position for a
cluster star in the CMD region defined by the error box of the lth
observed star. This is clearly not the case when there is no
detectable concentration of cluster stars relative to field stars
within the error box. This situation is more likely to happen in
clusters with heavy field contamination and large magnitude errors as
in the lower magnitude regions of the CMD. However, as discussed
earlier the magnitude cut-off can resolve this issue by eliminating
these stars from the sample to be fitted. We then calculate the weight
for the lth star with the expression:
| Wl | = | ||

|
|||

|
|||

|
|||

|
(12) |
where Vl, BVl and UBl are the observed V magnitude and the color indexes of the lth star,
In Fig. 1 we show the results of the decontamination and weighting process for the cluster NGC 2477 and data set of Kassis et al. (1997). The black dots in the left graph are the selected stars after decontamination, the open circles are stars that fall outside the defined cluster radius (which are then eliminated from the sample to be fitted) and light dots are stars for which no statistic was available due to low numbers. The right graph shows open circles with sizes scaled to their weights, with larger sizes meaning larger weights. It is clear from these graphs that the decontamination scheme we have adopted is not perfect and in regions where field stars have large densities in the CMD non-cluster stars are likely to survive the process. However, as we can see in the right graph, the weighting procedure does a good job of assigning low values to these fields stars. In any case, as discussed before, we have introduced a magnitude cut-off to eliminate these regions altogether from the fitting process if necessary.
4.5 Implementing the Cross entropy algorithm
In our problem IN is a tabulated function taken from a grid of models calculated by Padova database of stellar evolutionary tracks and isochrones Girardi et al. (2000); Marigo et al. (2008).
The tabulated isochrones are defined by 2 parameters, namely, age and
metallicity and to compare to observed data we also need distance and
extinction, which we consider constant. These are the parameters we
wish to optimize thus fitting the tabulated isochrone to the observed
data. The parameter ranges for generating ![]() are pre-defined by
the user and should be representative of the problem being
optimized. In general, the CE algorithm is very forgiving of large
parameter spaces, being very efficient in quickly zoning in on optimal
regions. In the isochrone fitting done in this work we defined the
parameter space as follows:
are pre-defined by
the user and should be representative of the problem being
optimized. In general, the CE algorithm is very forgiving of large
parameter spaces, being very efficient in quickly zoning in on optimal
regions. In the isochrone fitting done in this work we defined the
parameter space as follows:
- 1.
- Age: from
log(age)=6.60 to
 encompassing the full range of theoretical isochrones;
- 2.
- distance: from 1 to 10 000 parsecs;
- 3.
-
 :
from 0.0 to 3.0;
:
from 0.0 to 3.0;
- 4.
- Z: fixed (used literature values).
Table 1: Results for synthetic clusters studied by the fitting method.
The filtered sample is then fed through the optimization algorithm
described previously which then minimizes the objective function ![]() thus maximizing the likelihood function to find the best fitting
values for age, distance and reddening for a given metallicity.
thus maximizing the likelihood function to find the best fitting
values for age, distance and reddening for a given metallicity.
![\begin{figure}
\par\includegraphics[width=15.5cm,clip]{mlh-space.ps}
\end{figure}](/articles/aa/full_html/2010/08/aa13677-09/img94.png)
|
Figure 2: Parameter space coverage of a full run of the optimization algorithm ( left column) as well as the 2D likelihoods ( right column) for the fitted parameters for synthetic cluster SC 06. In the right column open circles represent the correct solution and filled circles the final parameter value obtained from the algorithm. |
| Open with DEXTER | |
An important point to be made is that although in the algorithm all parameters can be fit simultaneously, we opted to take the usual procedure of determining the E(B-V) parameter first, using only the colour-colour diagram and the ZAMS, and then performing the fit for the other parameters in the CMD. However, to ensure that the fit has some liberty in accommodating other possibilities in the second stage of the fitting we allow E(B-V) to vary in a range of 10% of the value determined in the first step.
An advantage of this fitting procedure is that it allows for
determination of parameter errors through Monte-Carlo techniques. To
accomplish this we perform the fit for each data set NRun times,
each time re-sampling from the original data set with replacement to
perform a bootstrap procedure as well as generating new isochrone
points from the adopted IMF as described previously. For each run we
also replace the stars chosen in the new bootstrap sample with ones
obtained by randomly generating values of (U,B,V)l drawn from a
normal distribution centered at the original data value and with
![]() .
The final uncertainties in each parameter are
obtained by calculating the standard deviation of the NRun fit
values.
.
The final uncertainties in each parameter are
obtained by calculating the standard deviation of the NRun fit
values.
5 Validating the method
To validate the method we applied the fitting algorithm to a set of synthetic clusters generated from a predefined isochrone of a given age and metallicity. We set the distance and reddening and generate a set of stars drawn from a probability distribution obtained from a Salpeter IMF. To make the test more realistic we also introduce some contaminating field stars, generated in a bigger volume of space and with varying reddening constants determined randomly. It is important to point out that the synthetic cluster is not supposed to be a realistic rendition of a real open cluster but just a tool to gage the capability of the method to recover well defined parameters. In this case we know precisely the age and metallicity of the isochrone as well as the IMF that generated the stars. In real situations the contaminations can come from many sources and have very different characteristics. We did not run exhaustive tests with synthetic clusters and different contamination schemes to determine their effect in the results. However as the results will show in the following sections the filtering scheme explained previously does a good job in rejecting stars with low probability of belonging to the cluster.
5.1 Synthetic cluster
Based on other works published in the literature, we generated synthetic clusters with typical numbers of stars, photometric errors and contamination. In all tests we were able to recover the parameters used to create the cluster within reasonable errors considering the level of contamination and photometric errors as well as the number of generated stars. As would be expected, the method is sensitive to the number of observed stars and the photometric errors, but in all cases gave good values within the errors established. In general, as long as the cluster was well sampled, i.e. had enough member stars, the method converged well. Poorly populated clusters should always be treated with care or be avoided by this type of technique. Even so, we managed to fit synthetic clusters with as little as 20 stars with errors in the order of 25%. The actual accuracy will depend on what section of the isochrone is sampled, especially for the age, since the presence of red giants usually provide a strong constraint.
The synthetic clusters were generated with the following parameters:
-
 yr;
yr;
- distance=2100 pc;
-
 ;
;
- Z = 0.019;
- Number of stars
 100 to 1000;
- Contamination 20% to 50%;
- Photometric error
 .
.
In Fig. 2 we show plots of the parameter space coverage of a full run of the optimization algorithm as well as the 2D likelihood for the fitted parameters for synthetic cluster SC01. It is clear in these plots that the method finds the optimal solution even in considerably irregular likelihood space. The error bars shown were obtained from the bootstrap procedure. Note that the solution obtained from the fitting algorithm (filled circles) are consistent with the values used to generate the synthetic cluster (open circles). The non-coincidence of the open circle positions and the likelihood maxima is due to the generation of synthetic clusters with limited number os stars as well as the errors used. The smaller the error and the greater the number of stars the closer the positions would be.
The generated cluster data as well as the final fitting isochrone is shown for two of the synthetic clusters (SC03 and SC06) in Figs. 3 and 4.
![\begin{figure}
\par\includegraphics[scale=0.6]{control-cluster-bad.ps}
\vspace*{3mm}
\end{figure}](/articles/aa/full_html/2010/08/aa13677-09/img103.png)
|
Figure 3: Result of the fitting method for the synthetic cluster SC 06 with the ZAMS (thin line) and the fitted isochrone (thick line) where we show the rejected stars by our filtering method (open circles) as well as stars used in the fit (filled circles) |
| Open with DEXTER | |
![\begin{figure}
\par\includegraphics[scale=0.6]{control-cluster-good.ps}\vspace*{3mm}
\end{figure}](/articles/aa/full_html/2010/08/aa13677-09/img104.png)
|
Figure 4: Result of the fitting method for the synthetic cluster SC 03 with the ZAMS (thin line) and the fitted isochrone (thick line) where we show the rejected stars by our filtering method (open circles) as well as stars used in the fit (filled circles). |
| Open with DEXTER | |
To quantify the effect of adopting 100% binaries in the fitting procedure we generated a synthetic cluster using the same parameters adopted for the previous tests but now with a binary fraction of 50%. We then performed fits using different binary fractions of 0%, 25%, 50%, 75% and 100%. The results are shown in Fig. 5. The main effect observed is the overestimation of the distance and reddening for adopted binary fractions that are higher than the true value. However, as Fig. 5 shows, in the most extreme case this introduces a systematic error of about 10% in the determined distance and reddening and less than 1% for the age. Ideally the binary fraction should be determined through other means and then incorporated in the fit performed. Adopting a binary fraction of 100% essentialy means that the results should be viewed as upper limits for distance and reddening.
![\begin{figure}
\par\includegraphics[width=8.2cm,clip]{binarity.ps} %
\end{figure}](/articles/aa/full_html/2010/08/aa13677-09/img105.png)
|
Figure 5: Results of the fitting method for one realization of a synthetic cluster with a binary fraction of 0.5. The final fit values obtained were normalized to the expected (true) values (as defined in Sect. 5.1). The points have been slightly shifted in the x axis for clarity. |
| Open with DEXTER | |
![\begin{figure}
\par\includegraphics[width=8.2cm,clip]{imf-test.ps} %
\end{figure}](/articles/aa/full_html/2010/08/aa13677-09/img106.png)
|
Figure 6: Results of the fitting method for one realization of a synthetic cluster using different IMF exponents. The final fit values obtained were normalized to the expected (true) values (as defined in Sect. 5.1). The points have been slightly shifted in the x axis for clarity. |
| Open with DEXTER | |
We also probed the effect of using different IMF parametrization. Using a synthetic cluster with no binaries we obtained fits using IMF exponents of 1.0, 1.5, 2.0, 2.1, 2.2 and 2.35. The results are shown in Fig. 6 where it is clear that the IMF variations do not affect the final results significantly.
6 Fitting published data
Having validated the fitting technique with the synthetic clusters we proceeded to the fitting of real cluster data. We selected a set of well studied clusters based on the work of Paunzen & Netopil (2006) where the authors performed a statistical analysis of the determined physical parameters of open clusters published in the literature to characterize the current status of knowledge and the precision of open cluster parameters such as age, reddening and distance. The authors defined a sample of 72 open clusters with the most precise known parameters, which they suggest, should be used as standards for future theoretical work.
In our work we pre-selected 29 clusters from the standard sample proposed by Paunzen & Netopil (2006) that had at least 5 independent fundamental parameter estimates to be representative of the heterogeneity of the published results. This allowed us to compare our results to others obtained in the literature considering a more representative estimate of the errors in each parameter.
The observational data was obtained through the WEBDA
catalog![]() (Mermilliod 1995) for each cluster. We only selected clusters with
U band photometry as this allowed us to determine the reddening
through the color-color diagram of open clusters as traditionally done
(see Phelps & Janes 1994). We did not use data sets that had mixed
observations from different authors, using only those sets that
originated from a single source. For the 29 previously selected
clusters only 13 satisfied these conditions. For some of the clusters
we also obtained multiple data sets that satisfied our criteria and
those were also used. From the 13 final clusters we selected a sample
of 9 to which we applied our fitting technique.
(Mermilliod 1995) for each cluster. We only selected clusters with
U band photometry as this allowed us to determine the reddening
through the color-color diagram of open clusters as traditionally done
(see Phelps & Janes 1994). We did not use data sets that had mixed
observations from different authors, using only those sets that
originated from a single source. For the 29 previously selected
clusters only 13 satisfied these conditions. For some of the clusters
we also obtained multiple data sets that satisfied our criteria and
those were also used. From the 13 final clusters we selected a sample
of 9 to which we applied our fitting technique.
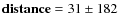
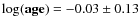
In Table 2 we present the fit parameters used and in Table 3 we present the final fitting results as well as the reference numbers (as defined in the WEBDA catalog) of each cluster studied using our method.
Table 2: Cross-Entropy fit parameters.
As mentioned before, since the selected data samples did not contain photometric error estimates in WEBDA, we have adopted values based on the results of the filtering algorithm applied. The photometric errors presented in Table 2 are those that gave the best result for the filtering method based on elimination of obvious contaminating stars and good definition of the turn-off and main sequence of the cluster. Because of this procedure these estimated errors should not be taken as formal photometric errors for the data.
7 Results and discussion
It is difficult to compare our results directly to other individual results in the literature given that they use different methods to analise the CMD as well as different isochrone models in some cases. For this reason we opted to use the Paunzen & Netopil (2006) values instead of individual parameter determinations as we feel these are more representative of real values and the errors reflect the precision of all techniques used so far. In this way we avoid any potential bias to any one given technique or observational data set and heterogeneity can be accommodated by the quoted errors, also allowing us a more quantifiable comparison to other parameter determinations.
We present the comparison of our results to those given by Paunzen & Netopil (2006) for the 9 open clusters studied in Figs. 7-9. The average and standard deviation of the differences of our results to those of Paunzen & Netopil (2006) are:
-
 mag;
mag;
-
 pc;
pc;
-
 yr.
yr.
Table 3: Basic parameters obtained for the investigated clusters.
![\begin{figure}
\par\includegraphics[width=8.8cm]{ebv-comp.ps}
\end{figure}](/articles/aa/full_html/2010/08/aa13677-09/img187.png)
|
Figure 7: Comparison of our fit results to those of Paunzen & Netopil (2006) for the parameter E(B-V). The error bars are obtained from the errors presented in Table 3 for our fit and literature respectively. |
| Open with DEXTER | |
![\begin{figure}
\par\includegraphics[width=8.8cm]{dist-comp.ps}
\end{figure}](/articles/aa/full_html/2010/08/aa13677-09/img188.png)
|
Figure 8: Same as in Fig. 4 for the parameter distance. |
| Open with DEXTER | |
![\begin{figure}
\par\includegraphics[width=8.8cm]{age-comp.ps}
\end{figure}](/articles/aa/full_html/2010/08/aa13677-09/img190.png)
|
Figure 9:
Same as in Fig. 4 for the parameter |
| Open with DEXTER | |
7.1 Melotte 105
For the open cluster Melotte 105 we find a discrepancy in the distance determined using the data from Sagar et al. (2001) when compared to the result obtained by Paunzen & Netopil (2006). This can be explained by the stars used in our fit as result of the filtering technique as well as the weights assigned to them (see Figs. 17 and 18). It is clear from the figures that the data from Sagar et al. (2001) is somewhat different from the one obtained by Kjeldsen & Frandsen (1991). In this case it is difficult to determine which is the best result without more observational information. Given that other results were obtained through visual fits we cannot compare each weight attribution or determine which stars were deemed more important by the authors, however it seems likely that Sagar et al. (2001) gave more importance to stars around V = 11.5 that in our case were eliminated by the decontamination.
7.2 NGC 2355
For the open cluster NGC 2355 we find significant differences in
E(B-V), distance and ![]() for the fit results using the
Ann et al. (1999) (Ref. 217) data set and a small discrepancy for
E(B-V) with the data set of Kaluzny & Mazur (1991) when compared to the
results obtained by Paunzen & Netopil (2006). It is likely that the most important
factor in explaining these differences is the adopted
metallicities. For NGC 2355 Kaluzny & Mazur (1991) adopt
for the fit results using the
Ann et al. (1999) (Ref. 217) data set and a small discrepancy for
E(B-V) with the data set of Kaluzny & Mazur (1991) when compared to the
results obtained by Paunzen & Netopil (2006). It is likely that the most important
factor in explaining these differences is the adopted
metallicities. For NGC 2355 Kaluzny & Mazur (1991) adopt
![]() while we use the value of
while we use the value of
![]()
![]() obtained by Soubiran et al. (2000) through spectroscopic observations of
24 stars, which we believe to be more reliable.
obtained by Soubiran et al. (2000) through spectroscopic observations of
24 stars, which we believe to be more reliable.
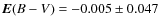
Other factors as the obvious difference in detection efficiency of each observational data set as well as precision of photometry will affect the results. The fit parameters obtained from the data of Kaluzny & Mazur (1991) (Ref. 44) are in better agreement with the ones obtained by Paunzen & Netopil (2006). We believe that data from Kaluzny & Mazur (1991) is more precise although not going as deep as the data from Ann et al. (1999) (Ref. 217), indicating that the bigger discrepancies, when compared to the results of Paunzen & Netopil (2006), are likely due to lower photometric precision and higher level of contamination in the data. We point out that the discrepancies in the determination of E(B-V) may be due to differences in photometry. In Figs. 16 and 17 one can easily see in the colour-colour diagrams for each data set of NGC 2355 that there is a systematic difference of about 0.1 in (U-B) between the data sets.
7.3 NGC 7044
For the open cluster NGC 7044 we find differences between our fit
value of E(B-V) to the one determined by Paunzen & Netopil (2006) although the
![]() and distance values are within the uncertainties. The
E(B-V) value of Paunzen & Netopil (2006) is clearly not adequate for this data
set as can be seen in the colour-colour diagram plot of Fig. 8,
however our value for E(B-V) as well as
and distance values are within the uncertainties. The
E(B-V) value of Paunzen & Netopil (2006) is clearly not adequate for this data
set as can be seen in the colour-colour diagram plot of Fig. 8,
however our value for E(B-V) as well as ![]() is consistent
with the determination of Aparicio et al. (1993) (Ref. 62), the source
of the data.
is consistent
with the determination of Aparicio et al. (1993) (Ref. 62), the source
of the data.
![\begin{figure}
\par\includegraphics[scale=0.5,clip]{ngc2477_ref152.ps}
\end{figure}](/articles/aa/full_html/2010/08/aa13677-09/img194.png)
|
Figure 10: Model fit results for NGC 2477 (Ref. 152) where we show the rejected stars by our filtering method (open circles) as well as stars used in the fit (filled circles). The fitted isochrone and ZAMS are shown in thin and thick solid lines respectively as well as the values from Paunzen & Netopil (2006) with the ZAMS as well as the isochrone plotted with thick and thin dashed lines respectively. |
| Open with DEXTER | |
![\begin{figure}
\par\includegraphics[scale=0.5]{ngc7044_ref62.ps}
\end{figure}](/articles/aa/full_html/2010/08/aa13677-09/img195.png)
|
Figure 11: |
| Open with DEXTER | |
![\begin{figure}
\par\includegraphics[scale=0.5]{ngc2266_ref41.ps}
\end{figure}](/articles/aa/full_html/2010/08/aa13677-09/img196.png)
|
Figure 12: |
| Open with DEXTER | |
![\begin{figure}
\par\includegraphics[scale=0.52]{Be32_ref40.ps}
\end{figure}](/articles/aa/full_html/2010/08/aa13677-09/img197.png)
|
Figure 13: Same as Fig. 7 for Berkeley 32 (Ref. 40). |
| Open with DEXTER | |
![\begin{figure}
\par\includegraphics[scale=0.52]{ngc2682_ref335.ps}
\end{figure}](/articles/aa/full_html/2010/08/aa13677-09/img198.png)
|
Figure 14: |
| Open with DEXTER | |
![\begin{figure}
\par\includegraphics[scale=0.52]{ngc2682_ref31.ps}
\end{figure}](/articles/aa/full_html/2010/08/aa13677-09/img199.png)
|
Figure 15: |
| Open with DEXTER | |
The large spread in the main sequence region is also an important factor as pointed out by Aparicio et al. (1993), where they argue that the large spread may be an indication of a large number binaries and based on this they estimate a value of 22% for the binary fraction. It is clear from Fig. 8 that our method of including binaries does a good job in accounting for their presence as can be seen also by the agreement in the distance determined by the fit.
7.4 Trumpler 1
For the open cluster Trumpler 1 the fitted distance agrees within the
errors to those determined by Paunzen & Netopil (2006) except for the
![]() .
The age difference, especially for Yadav & Sagar (2002)
(Ref. 320), is likely due to the bright stars considered in the fit.
.
The age difference, especially for Yadav & Sagar (2002)
(Ref. 320), is likely due to the bright stars considered in the fit.
As we can see in Fig. 21 for the data from Yadav & Sagar (2002) (Ref. 320), our filtering technique has removed some bright stars that may belong to the turn-off of the cluster. The removal happened because in all cases these were single events in that region of the CMD and thus no statistic could be performed. We have introduced an option to keep these single points if the case may present itself but did not use it in this cluster as it introduced considerable contamination along with the wanted stars in the tip of the turn-off. It may be the case that in these situations our errors are underestimated since these stars have low photometric errors when compared to the fainter and more numerous stars.
![\begin{figure}
\par\includegraphics[scale=0.52]{ngc2682_ref54.ps}
\end{figure}](/articles/aa/full_html/2010/08/aa13677-09/img200.png)
|
Figure 16: |
| Open with DEXTER | |
![\begin{figure}
\par\includegraphics[scale=0.52]{ngc2506_ref284.ps}
\end{figure}](/articles/aa/full_html/2010/08/aa13677-09/img201.png)
|
Figure 17: |
| Open with DEXTER | |
![\begin{figure}
\par\includegraphics[scale=0.52]{ngc2506_ref163.ps}
\end{figure}](/articles/aa/full_html/2010/08/aa13677-09/img202.png)
|
Figure 18: |
| Open with DEXTER | |
In situations like these other data may resolve the issue if incorporated in the calculation of the weights. One example is the determination of proper motions for cluster stars, as done by Loktin & Beshenov (2003) for Trumpler 1, where the author determines the proper motion of the cluster from measurements of 12 stars. However, the author does not provide the individual data for the stars and therefore it could not be used to assign weights to the observations.
The situation is similar when we examine the results presented in Fig. 21 for the fit of the observational data provided by Phelps & Janes (1994) (Ref. 86). In this case our filtering technique also rejected single points in the CMD in the region of the turn-off. The same considerations made above about the errors apply in this case.
![\begin{figure}
\par\includegraphics[scale=0.52]{ngc2355_ref217.ps}
\end{figure}](/articles/aa/full_html/2010/08/aa13677-09/img203.png)
|
Figure 19: |
| Open with DEXTER | |
![\begin{figure}
\par\includegraphics[scale=0.52]{ngc2355_ref44.ps}
\end{figure}](/articles/aa/full_html/2010/08/aa13677-09/img204.png)
|
Figure 20: |
| Open with DEXTER | |
![\begin{figure}
\par\includegraphics[scale=0.52]{mel105_ref289.ps}
\end{figure}](/articles/aa/full_html/2010/08/aa13677-09/img205.png)
|
Figure 21: Same as Fig. 7 for Melotte 105 (Ref. 289). |
| Open with DEXTER | |
As a final note we point out that significant differences exist
between each data set. The observations of Phelps & Janes (1994) have a
limiting magnitude of
![]() while Yadav & Sagar (2002) have a
limiting magnitude of
while Yadav & Sagar (2002) have a
limiting magnitude of
![]() yielding 1291 and 670 detected
stars respectively both with considerable contamination from field
stars. Yadav & Sagar (2002) mention in their work that they suspect the
data from Phelps & Janes (1994) suffers from calibration problems. All
these factors are likely to be sources of the differences in the
results we obtained.
yielding 1291 and 670 detected
stars respectively both with considerable contamination from field
stars. Yadav & Sagar (2002) mention in their work that they suspect the
data from Phelps & Janes (1994) suffers from calibration problems. All
these factors are likely to be sources of the differences in the
results we obtained.
8 Conclusions
As pointed out by Paunzen & Netopil (2006), studying phenomena using open cluster physical parameters, is highly dependent on their precision. The authors also show that major discrepancies still exist even in well studied clusters. In our work we provide a new technique for the determination of open cluster physical parameters that is not dependent on the user and is reproducible within the statistical uncertainties given well defined conditions.
Our method, based on the Cross-Entropy optimization algorithm, was tailored to the fitting of theoretical isochrones as the ones of Girardi et al. (2000); Marigo et al. (2008) used in this work. The procedure is simple and allows for the use of any tabulated theoretical isochrones and thus provides also an unbiased means of comparing fits using different theoretical models given the same constraints and fitting procedure.
![\begin{figure}
\par\includegraphics[scale=0.52]{mel105_ref32.ps}
\end{figure}](/articles/aa/full_html/2010/08/aa13677-09/img208.png)
|
Figure 22: Same as Fig. 7 for Melotte 105 (Ref. 32). |
| Open with DEXTER | |
![\begin{figure}
\par\includegraphics[scale=0.52]{tr01_ref320.ps}
\end{figure}](/articles/aa/full_html/2010/08/aa13677-09/img209.png)
|
Figure 23: Same as Fig. 7 for Trumpler 1 (Ref. 320). |
| Open with DEXTER | |
![\begin{figure}
\par\includegraphics[scale=0.52]{tr01_ref86.ps}
\end{figure}](/articles/aa/full_html/2010/08/aa13677-09/img210.png)
|
Figure 24: Same as Fig. 7 for Trumpler 1 (Ref. 86). |
| Open with DEXTER | |
In this work we have concentrated in the validation of the method limiting ourselves to fitting synthetic clusters and well studied open clusters with the tabulated isochrones of Padova. The results show that the method is capable of recovering the original parameters with good accuracy even in cases where we included considerable non-uniform field contamination demonstrating its robustness. The validation using these synthetic clusters is by no means complete, however, we explored the most typical situations present in open cluster data.
The results using the observed data available in the literature show that the parameters determined through our technique are consistent with the results obtained by other authors and especially those given by Paunzen & Netopil (2006) as shown in Table 3. In all cases where we encountered significant discrepancies these could be explained by data quality, level of contamination, which stars were selected by our filtering technique or some combination of these. In any case, the fact that all the steps related to our fitting procedure are quantifiable, allows us to perform objective comparisons of different parameters for a given data set, removing the subjectivity of which stars are selected.
The filtering and weighting technique defined by a precise set of conditions is central to our method. As shown in the results for Trumpler 1, in cases where the cluster has low sampling, i.e. low number of stars, it becomes difficult to determine the weight for cluster stars. It is likely that better statistical tools may improve the efficiency of this step. In general, the filtering technique performed well in eliminating most of the contamination and assigning weights in the observed clusters, especially in the well sampled cases.
The final results show that there is good agreement in general with the results adopted as standards in the literature, but also indicates that some issues still remain unresolved. Perhaps the most important of these issues is related to the metallicity. As mentioned before, we kept the metallicity values fixed in our fits and attempted to use the ones provided by the observers, except in cases where we believed more reliable values were available. Many of the clusters show results that could be clearly improved by changing the metallicity, as for example the case of NGC 7044. Given the considerations above, it is also important to point out that the values we used for comparison taken from the proposed standard list of Paunzen & Netopil (2006) do not take metallicities into account. The different author determinations for the parameters that were averaged possibly were derived using different metallicities.
Another aspect that plays a major role in the final results is the binary fraction. This is a characteristic of the clusters that is not easily accounted for even in visual fits and so it is difficult to evaluate how much this is relevant in each individual case. We have accounted for this effect by assuming a 100% binary fraction and drawing companions from the same IMF used to generate the fitting points. While this is clearly not the correct binary fraction for all clusters, the effect of adopting that value is relatively small, as shown in Fig. 5, due to the fact that effectively only binary systems with similar mass will show a significant difference in magnitude on the CMD.
Given all the consideration above, we show that our method is reliable and robust and although the results presented in this work are consistent with literature values all clusters we believe that there is room for improvement in the accepted parameter values for other clusters. The possibility of re-evaluating previous results with more quantifiable means is important as it removes the subjectivity inherent in most open cluster studies up to today.
AcknowledgementsWe thank Professor Jacques Lépine for motivation and for some helpful discussions. We also thank the referee Dr. Bailer-Jones for extremely useful comments that greatly improved the paper. W. S. Dias thanksto CNPq (grant number 302762/2007-8), CAPES (project CAPES-GRICES process 040/2008) and FAPEMIG (process number APQ-00090-08). T. C. Caetano thanks to CAPES. Extensive use has been made of the WEBDA databases.
References
- Ann, H. B., Lee, M. G., Chun, M. Y., et al. 1999, J. Korean Astron. Soc., 32, 7 [Google Scholar]
- Aparicio, A., Alfaro, E. J., Delgado, A. J., Rodriguez-Ulloa, J. A., & Cabrera-Cano, J. 1993, AJ, 106, 1547 [NASA ADS] [CrossRef] [Google Scholar]
- Caproni, A., Monteiro, H., & Abraham, Z. 2009, MNRAS, 399, 1415 [NASA ADS] [CrossRef] [Google Scholar]
- De Boer, P., Kroese, Mannor, S., & Rubinstein, R. Y. 2004, in Annals of Operations Research, 134, 19 [Google Scholar]
- Dias, W. S., Alessi, B. S., Moitinho, A., et al. 2002, A&A, 389, 871 [NASA ADS] [CrossRef] [EDP Sciences] [Google Scholar]
- Dias, W. S., & Lépine, J. R. D. 2005, ApJ, 629, 825 [NASA ADS] [CrossRef] [Google Scholar]
- Fernie, J. D., & Rosenberg, W. J. 1961, PASP, 73, 259 [NASA ADS] [CrossRef] [Google Scholar]
- Flannery, B. P., & Johnson, B. C. 1982, ApJ, 263, 166 [NASA ADS] [CrossRef] [Google Scholar]
- Gilliland, R. L., Brown, T. M., Duncan, D. K., et al. 1991, AJ, 101, 541 [NASA ADS] [CrossRef] [Google Scholar]
- Girardi, L., Bressan, A., Bertelli, G., et al. 2000, A&AS, 141, 371 [Google Scholar]
- Hernandez, X., & Valls-Gabaud, D. 2008, MNRAS, 383, 1603 [NASA ADS] [CrossRef] [Google Scholar]
- Høg, E., Fabricius, C., Makarov, V. V., et al. 2000, A&A, 355, L27 [NASA ADS] [Google Scholar]
- Kaluzny, J., & Mazur, B. 1991, Acta Astron., 41, 167 [Google Scholar]
- Kang, Y. B., Kim, S., Rey, S., et al. 2008, PASP, 120, 358 [NASA ADS] [CrossRef] [Google Scholar]
- Kassis, M., Janes, K. A., Friel, E. D., et al. 1997, AJ, 113, 1723 [NASA ADS] [CrossRef] [Google Scholar]
- Kim, S., Chun, M., Park, B., et al. 2001, Acta Astron., 51, 49 [Google Scholar]
- Kjeldsen, H., & Frandsen, S. 1991, A&AS, 87, 119 [NASA ADS] [Google Scholar]
- Kroese, D. P., Porotsky, S., & Rubinstein, R. Y. 2006, Methodology and Computing in Applied Probability, 8, 383 [Google Scholar]
- Lépine, J. R. D., Dias, W. S., & Mishurov, Y. 2008, MNRAS, 386, 2081 [NASA ADS] [CrossRef] [Google Scholar]
- Loktin, A. V., & Beshenov, G. V. 2003, Astron. Rep., 47, 6 [NASA ADS] [CrossRef] [Google Scholar]
- Majaess, D. J., Turner, D. G., & Lane, D. J. 2009, MNRAS, 398, 263 [NASA ADS] [CrossRef] [Google Scholar]
- Marconi, G., Hamilton, D., Tosi, M., et al. 1997, MNRAS, 291, 763 [NASA ADS] [CrossRef] [Google Scholar]
- Margolin, L. 2005, in Annals of Operations Research, 134 (Netherlands: Springer), 201 [Google Scholar]
- Marigo, P., Girardi, L., Bressan, A., et al. 2008, A&A, 482, 883 [NASA ADS] [CrossRef] [EDP Sciences] [Google Scholar]
- Mermilliod, J.-C. 1995, in Information On-Line Data in Astronomy, ed. D. Egret, & M. A. Albrecht, Astrophysics and Space Science Library, 203, 127 [Google Scholar]
- Meynet, G., Mermilliod, J., & Maeder, A. 1993, A&AS, 98, 477 [NASA ADS] [Google Scholar]
- Moitinho, A. 2001, A&A, 370, 436 [NASA ADS] [CrossRef] [EDP Sciences] [Google Scholar]
- Montgomery, K. A., Marschall, L. A., & Janes, K. A. 1993, AJ, 106, 181 [NASA ADS] [CrossRef] [Google Scholar]
- Narbutis, D., Bridzius, A., Stonkute, R., et al. 2007, Baltic Astron., 16, 421 [NASA ADS] [Google Scholar]
- Naylor, T., & Jeffries, R. D. 2006, MNRAS, 373, 1251 [NASA ADS] [CrossRef] [Google Scholar]
- Paunzen, E., & Netopil, M. 2006, MNRAS, 371, 1641 [NASA ADS] [CrossRef] [Google Scholar]
- Perryman, M. A. C., & ESA, ed. 1997, The HIPPARCOS and TYCHO catalogues. Astrometric and photometric star catalogues derived from the ESA HIPPARCOS Space Astrometry Mission, ESA SP, 1200 [Google Scholar]
- Phelps, R. L., & Janes, K. A. 1994, ApJS, 90, 31 [NASA ADS] [CrossRef] [Google Scholar]
- Rubinstein, R. Y. 1997, European Journal of Operational Research, 99, 89 [CrossRef] [Google Scholar]
- Rubinstein, R. Y. 1999, Journal Methodology and Computing in Applied Probability, 1, 127 [NASA ADS] [CrossRef] [Google Scholar]
- Sagar, R., Munari, U., & de Boer, K. S. 2001, MNRAS, 327, 23 [NASA ADS] [CrossRef] [Google Scholar]
- Schlesinger, B. M. 1975, AJ, 80, 1071 [NASA ADS] [CrossRef] [Google Scholar]
- Soubiran, C., Odenkirchen, M., & Le Campion, J. 2000, A&A, 357, 484 [NASA ADS] [Google Scholar]
- VandenBerg, D. A., & Stetson, P. B. 2004, PASP, 116, 997 [NASA ADS] [CrossRef] [Google Scholar]
- von Hippel, T., & Sarajedini, A. 1998, AJ, 116, 1789 [NASA ADS] [CrossRef] [Google Scholar]
- Yadav, R. K. S., & Sagar, R. 2002, MNRAS, 337, 133 [NASA ADS] [CrossRef] [Google Scholar]
Footnotes
- ...
catalog
![[*]](/icons/foot_motif.png)
- Available at http://www.univie.ac.at/webda
All Tables
Table 1: Results for synthetic clusters studied by the fitting method.
Table 2: Cross-Entropy fit parameters.
Table 3: Basic parameters obtained for the investigated clusters.
All Figures
|
|
Figure 1: Result of the decontamination ( left) and weighting process ( right) for the cluster NGC 2477. The black dots in the left graph are the selected stars after decontamination, the open circles are stars that fall outside the defined cluster radius and light dots are stars for which no statistic was available due to low numbers. The right graph shows open circles with sizes scaled to their weights, with larger sizes meaning larger weights. |
| Open with DEXTER | |
| In the text | |
|
|
Figure 2: Parameter space coverage of a full run of the optimization algorithm ( left column) as well as the 2D likelihoods ( right column) for the fitted parameters for synthetic cluster SC 06. In the right column open circles represent the correct solution and filled circles the final parameter value obtained from the algorithm. |
| Open with DEXTER | |
| In the text | |
|
|
Figure 3: Result of the fitting method for the synthetic cluster SC 06 with the ZAMS (thin line) and the fitted isochrone (thick line) where we show the rejected stars by our filtering method (open circles) as well as stars used in the fit (filled circles) |
| Open with DEXTER | |
| In the text | |
|
|
Figure 4: Result of the fitting method for the synthetic cluster SC 03 with the ZAMS (thin line) and the fitted isochrone (thick line) where we show the rejected stars by our filtering method (open circles) as well as stars used in the fit (filled circles). |
| Open with DEXTER | |
| In the text | |
|
|
Figure 5: Results of the fitting method for one realization of a synthetic cluster with a binary fraction of 0.5. The final fit values obtained were normalized to the expected (true) values (as defined in Sect. 5.1). The points have been slightly shifted in the x axis for clarity. |
| Open with DEXTER | |
| In the text | |
|
|
Figure 6: Results of the fitting method for one realization of a synthetic cluster using different IMF exponents. The final fit values obtained were normalized to the expected (true) values (as defined in Sect. 5.1). The points have been slightly shifted in the x axis for clarity. |
| Open with DEXTER | |
| In the text | |
|
|
Figure 7: Comparison of our fit results to those of Paunzen & Netopil (2006) for the parameter E(B-V). The error bars are obtained from the errors presented in Table 3 for our fit and literature respectively. |
| Open with DEXTER | |
| In the text | |
|
|
Figure 8: Same as in Fig. 4 for the parameter distance. |
| Open with DEXTER | |
| In the text | |
|
|
Figure 9:
Same as in Fig. 4 for the parameter |
| Open with DEXTER | |
| In the text | |
|
|
Figure 10: Model fit results for NGC 2477 (Ref. 152) where we show the rejected stars by our filtering method (open circles) as well as stars used in the fit (filled circles). The fitted isochrone and ZAMS are shown in thin and thick solid lines respectively as well as the values from Paunzen & Netopil (2006) with the ZAMS as well as the isochrone plotted with thick and thin dashed lines respectively. |
| Open with DEXTER | |
| In the text | |
|
|
Figure 11: |
| Open with DEXTER | |
| In the text | |
|
|
Figure 12: |
| Open with DEXTER | |
| In the text | |
|
|
Figure 13: Same as Fig. 7 for Berkeley 32 (Ref. 40). |
| Open with DEXTER | |
| In the text | |
|
|
Figure 14: |
| Open with DEXTER | |
| In the text | |
|
|
Figure 15: |
| Open with DEXTER | |
| In the text | |
|
|
Figure 16: |
| Open with DEXTER | |
| In the text | |
|
|
Figure 17: |
| Open with DEXTER | |
| In the text | |
|
|
Figure 18: |
| Open with DEXTER | |
| In the text | |
|
|
Figure 19: |
| Open with DEXTER | |
| In the text | |
|
|
Figure 20: |
| Open with DEXTER | |
| In the text | |
|
|
Figure 21: Same as Fig. 7 for Melotte 105 (Ref. 289). |
| Open with DEXTER | |
| In the text | |
|
|
Figure 22: Same as Fig. 7 for Melotte 105 (Ref. 32). |
| Open with DEXTER | |
| In the text | |
|
|
Figure 23: Same as Fig. 7 for Trumpler 1 (Ref. 320). |
| Open with DEXTER | |
| In the text | |
|
|
Figure 24: Same as Fig. 7 for Trumpler 1 (Ref. 86). |
| Open with DEXTER | |
| In the text | |
Copyright ESO 2010
Current usage metrics show cumulative count of Article Views (full-text article views including HTML views, PDF and ePub downloads, according to the available data) and Abstracts Views on Vision4Press platform.
Data correspond to usage on the plateform after 2015. The current usage metrics is available 48-96 hours after online publication and is updated daily on week days.
Initial download of the metrics may take a while.