| Issue |
A&A
Volume 516, June-July 2010
|
|
|---|---|---|
| Article Number | A94 | |
| Number of page(s) | 7 | |
| Section | Stellar structure and evolution | |
| DOI | https://doi.org/10.1051/0004-6361/200913410 | |
| Published online | 21 July 2010 | |
K-band spectroscopy of IGR J16358-4726 and IGR J16393-4643: two new symbiotic X-ray binaries![[*]](/icons/foot_motif.png)
E. Nespoli1 - J. Fabregat1 - R. E. Mennickent2
1 - Observatorio Astronómico de la Universidad de
Valencia, Calle Catedrático Agustín Escardino 7, 46980 Paterna,
Valencia, Spain
2 - Departamento de Astronomía, Universidad de Concepción, Casilla 160-C, Concepción, Chile
Received 6 October 2009 / Accepted 7 March 2010
Abstract
Context. Symbiotic X-ray binaries (SyXBs) are a recently
discovered subclass of low mass X-ray binaries. Their growing number
makes them an important evolutionary channel of X-ray binaries.
Aims. Our goal is to perform spectral analysis and
classification of the proposed counterparts to IGR J16358-4726 and
IGR J16393-4643 and establish their nature as X-ray systems.
Methods. We used the ESO/UT1 ISAAC spectrograph to observe the proposed counterparts to the two sources, obtaining K-band medium resolution spectra (R = 500) with a S/N ![]() 140. Data reduction was performed with the standard procedure. We
classified them by means of comparison with published atlases. We
performed SED fitting to refine the spectral classification.
140. Data reduction was performed with the standard procedure. We
classified them by means of comparison with published atlases. We
performed SED fitting to refine the spectral classification.
Results. The two counterparts clearly exhibit the typical
features of late-type stars, notably strong CO absorption bands in the
red part of the spectrum. With information from previous X-ray studies,
we classify the two systems as two new members of the SyXB class. For
IGR J16393-4643, we considered the most probable counterpart to
the system, although three other objects cannot be completely
discarded. For this system, we compared our findings with available
orbital solutions, constraining the orbital parameters and the mass of
the companion star.
Conclusions. By including two more systems, we increased to
eight the number of known SyXBs, which emerges as a non-negligible
category of galactic X-ray binaries.
Key words: X-rays: binaries - stars: neutron - stars: individual: IGR J16358-4726 - stars: individual: IGR J16393-4643
1 Introduction
Low-mass X-ray binaries (LMXBs) are interacting systems consisting of an accreting compact object and a low-mass (typically ![]() 1
1 ![]() )
main-sequence or slightly evolved late-type star. A new sub-class of
LMXBs has emerged, in which the secondary is an M-type giant. These
rare systems are called symbiotic X-ray binaries (SyXBs) after Masetti et al. (2006)
by analogy with symbiotic binaries, in which a white dwarf accretes
matter from an M giant companion, either from the wind of the M star or
via Roche-lobe overflow. At present, only six X-ray sources are known
to belong to this subclass: GX 1+4 (Chakrabarty & Roche 1997; Davidsen et al. 1977), 4U 1700+24 (Masetti et al. 2002; García et al. 1983), 4U 1954+319 (Mattana et al. 2006; Masetti et al. 2006), Scutum X-1 (Kaplan et al. 2007), IGR J16194-2810 (Masetti et al. 2007), and 1RXS J180431.1-273932 (Nucita et al. 2007). Masetti et al. (2007, Table 3) presented a summary of the main properties of the first 5 SyXBs, Nucita et al. (2007) including the last discovered one.
)
main-sequence or slightly evolved late-type star. A new sub-class of
LMXBs has emerged, in which the secondary is an M-type giant. These
rare systems are called symbiotic X-ray binaries (SyXBs) after Masetti et al. (2006)
by analogy with symbiotic binaries, in which a white dwarf accretes
matter from an M giant companion, either from the wind of the M star or
via Roche-lobe overflow. At present, only six X-ray sources are known
to belong to this subclass: GX 1+4 (Chakrabarty & Roche 1997; Davidsen et al. 1977), 4U 1700+24 (Masetti et al. 2002; García et al. 1983), 4U 1954+319 (Mattana et al. 2006; Masetti et al. 2006), Scutum X-1 (Kaplan et al. 2007), IGR J16194-2810 (Masetti et al. 2007), and 1RXS J180431.1-273932 (Nucita et al. 2007). Masetti et al. (2007, Table 3) presented a summary of the main properties of the first 5 SyXBs, Nucita et al. (2007) including the last discovered one.
The increasing number of systems with an evolved giant donor makes this subclass an emerging evolutionary channel of X-ray binaries. They have also been proposed as the probable progenitors of most wide-orbit LMXBs (Chakrabarty & Roche 1997).
The six-years of INTEGRAL/IBIS data are improving substantially our knowledge about Galactic X-ray binaries (see, for instance, Bird et al. 2007,2010) by detecting a new class of heavily absorbed supergiant massive X-ray binaries (first proposed by Revnivtsev et al. 2003), by detecting and allowing the study of supergiant fast X-ray transients (SFXTs; see, for instance, Smith et al. 2006; Sguera et al. 2006; Sidoli et al. 2007; Nespoli et al. 2008c; Negueruela et al. 2007), by doubling the number of known high-mass X-ray binaries (HMXBs, see Walter et al. 2006), and by discovering a vast number of new magnetic cataclysmic variables (CVs; see Masetti et al. 2009; Barlow et al. 2006). Among INTEGRAL results, one can also identify one new SyXB, IGR J16194-2810 (Masetti et al. 2007).
Table 1: ISAAC/VLT journal of observations.
IGR J16358-4726 was discovered by Revnivtsev et al. (2003), then serendipitously observed by Chandra, which located the source at RA = 16
![]() ,
Dec = -47
,
Dec = -47
![]() with an accuracy of 0.6'' (Kouveliotou et al. 2003).
This allowed these authors to identify an infrared counterpart,
2MASS J16355369-4725398. Subsequent astrometry performed by Chaty et al. (2008),
although stating that the 2MASS object is 1.2'' from the Chandra
detection, resulted in establishing it as the true counterpart, mainly
because of its brightness (J= 15.41 mag, H=13.44 mag, K=12.59 mag).
The X-ray source was identified as a transient, and its spectrum fitted with a power law of spectral index
with an accuracy of 0.6'' (Kouveliotou et al. 2003).
This allowed these authors to identify an infrared counterpart,
2MASS J16355369-4725398. Subsequent astrometry performed by Chaty et al. (2008),
although stating that the 2MASS object is 1.2'' from the Chandra
detection, resulted in establishing it as the true counterpart, mainly
because of its brightness (J= 15.41 mag, H=13.44 mag, K=12.59 mag).
The X-ray source was identified as a transient, and its spectrum fitted with a power law of spectral index
![]() ,
hydrogen column density
,
hydrogen column density
![]() cm-2, and a FeK
cm-2, and a FeK![]() fluorescence line at 6.4 keV (Patel et al. 2007). From accurate spectral and timing analysis of multi-satellite data, Patel et al. (2007) also proposed that the source is a neutron star, estimating its magnetic field to be between 1013 and 1015 G,
if the retrieved spin up was caused by disc accretion, and thus
proposing that the object might be a magnetar. A spin period of
fluorescence line at 6.4 keV (Patel et al. 2007). From accurate spectral and timing analysis of multi-satellite data, Patel et al. (2007) also proposed that the source is a neutron star, estimating its magnetic field to be between 1013 and 1015 G,
if the retrieved spin up was caused by disc accretion, and thus
proposing that the object might be a magnetar. A spin period of
![]() s was found by Patel et al. (2004) and confirmed by several authors (Mereghetti et al. 2006; Lutovinov et al. 2005).
The source is understood to be located in the Norma Galactic arm, at a
distance of 5-6 kpc or 12-13 kpc, depending on which crossing
of the arm with the line of sight is chosen (Lutovinov et al. 2005).
s was found by Patel et al. (2004) and confirmed by several authors (Mereghetti et al. 2006; Lutovinov et al. 2005).
The source is understood to be located in the Norma Galactic arm, at a
distance of 5-6 kpc or 12-13 kpc, depending on which crossing
of the arm with the line of sight is chosen (Lutovinov et al. 2005).
From NIR spectroscopy, Chaty et al. (2008)
inferred that the system is a HMXB, and proposed that the counterpart
might be a sgB[e] star because of the detection of H Brackett series,
He I, and He II absorption lines and a forbidden [FeII] line at 2.22 ![]() m. This result was then corroborated by Rahoui et al. (2008) by means of SED fitting.
m. This result was then corroborated by Rahoui et al. (2008) by means of SED fitting.
Sugizaki et al. (2001) first discovered IGR J16393-4643 with the ASCA satellite and listed it as AX J16390.4-4642. During the first INTEGRAL scan of the Galactic plane, it was later detected (Malizia et al. 2004). Subsequent observations with XMM-Newton/EPIC derived an improved position (RA =
![]() ,
Dec =
,
Dec =
![]() ), which enabled Bodaghee et al. (2006) to identify 2MASS J16390535-4642137 as the most probable counterpart to the source.
These authors fitted the X-ray spectrum with a highly absorbed (
), which enabled Bodaghee et al. (2006) to identify 2MASS J16390535-4642137 as the most probable counterpart to the source.
These authors fitted the X-ray spectrum with a highly absorbed (
![]() cm-2) power law (
cm-2) power law (
![]() ), which, with the discovery of a pulse period of
), which, with the discovery of a pulse period of
![]() s, led to conclude that the source is an X-ray pulsar (Bodaghee et al. 2006).
s, led to conclude that the source is an X-ray pulsar (Bodaghee et al. 2006).
Thompson et al. (2006, hereafter T06) used RXTE
data to carry out a pulse timing analysis to determine the orbital
parameters of the system. They obtained three mathematical solutions,
among which the most plausible one indicated, with an orbital period of
3.7 days and a mass function of
![]() ,
that the system should be a HMXB.
The other two solutions foresaw the following parameters: an orbital period of 50.2 days for a mass function of 0.092
,
that the system should be a HMXB.
The other two solutions foresaw the following parameters: an orbital period of 50.2 days for a mass function of 0.092 ![]() and an orbital period of 8.1 days for mass function of 221
and an orbital period of 8.1 days for mass function of 221 ![]() ;
both of them were rejected by the authors as being statistically and physically weaker.
Chaty et al. (2008) obtained accurate
astrometry and photometry of the field of IGR J16393-4643, finding
three more candidate counterparts, although their lower NIR brightness
seemed to favor the 2MASS object. They also performed SED fitting of
optical to MIR observations, inferring a BIV-V spectral type for the
companion.
;
both of them were rejected by the authors as being statistically and physically weaker.
Chaty et al. (2008) obtained accurate
astrometry and photometry of the field of IGR J16393-4643, finding
three more candidate counterparts, although their lower NIR brightness
seemed to favor the 2MASS object. They also performed SED fitting of
optical to MIR observations, inferring a BIV-V spectral type for the
companion.
In this paper, we present K-band spectroscopy of the
proposed counterparts to the two X-ray systems. In the case of
IGR J16393-4643, our data represents the first available IR
spectrum; in the case of IGR J16358-4726, our data is the first IR
spectrum beyond 2.3 ![]() m.
We demonstrate the need for a new classification of the counterparts,
which implies a new classification of the systems as SyXBs, if the
proposed counterparts are the true ones. In the next section, we
describe our observations and data reduction; in Sect. 3, we report the
obtained spectra, analyze their features, and propose a classification;
in Sect. 4, we discuss our results, and in Sect. 5 we point out
the conclusions. Preliminary results of our data analysis were
published in Nespoli et al. (2008a).
m.
We demonstrate the need for a new classification of the counterparts,
which implies a new classification of the systems as SyXBs, if the
proposed counterparts are the true ones. In the next section, we
describe our observations and data reduction; in Sect. 3, we report the
obtained spectra, analyze their features, and propose a classification;
in Sect. 4, we discuss our results, and in Sect. 5 we point out
the conclusions. Preliminary results of our data analysis were
published in Nespoli et al. (2008a).
2 Observations and data analysis
The two proposed counterparts to the X-ray sources were observed in service mode on 2007 April 5 with the ISAAC spectrograph (Moorwood et al. 1998) on UT1 at ESO/Paranal observatory. The sky was clear during the observations, the seeing was ![]() 1.4'',
and the targets were observed at airmasses of 1.08 and 1.09,
respectively. Data were taken in the short wavelength-low resolution
mode with a pixel scale of 0.147''/pixel and a resolution of 500. Table
1 reports the observation log, including the achieved signal-to-noise ratio (S/N). Typical on-source integration times for standard stars were between 6 and 10 s.
1.4'',
and the targets were observed at airmasses of 1.08 and 1.09,
respectively. Data were taken in the short wavelength-low resolution
mode with a pixel scale of 0.147''/pixel and a resolution of 500. Table
1 reports the observation log, including the achieved signal-to-noise ratio (S/N). Typical on-source integration times for standard stars were between 6 and 10 s.
Data reduction was performed using the IRAF![]() package, following standard procedures for IR spectra. We first
corrected for the inter-quadrant row cross-talk, a feature that affects
the ISAAC detector. We then performed sky subtraction, applied dome
flat-fields, extracted and rectified the one dimensional spectra.
Wavelength calibration was accomplished using xenon and argon lamp
spectra. Spurious features, such as cosmic rays or bad pixels, were
removed by interpolation, when necessary. The reduced spectra were
normalized by dividing them by a fitted polynomial continuum.
package, following standard procedures for IR spectra. We first
corrected for the inter-quadrant row cross-talk, a feature that affects
the ISAAC detector. We then performed sky subtraction, applied dome
flat-fields, extracted and rectified the one dimensional spectra.
Wavelength calibration was accomplished using xenon and argon lamp
spectra. Spurious features, such as cosmic rays or bad pixels, were
removed by interpolation, when necessary. The reduced spectra were
normalized by dividing them by a fitted polynomial continuum.
To ensure accurate removal of atmospheric features from the spectra, we followed a strategy similar to that descripted by Clark & Steele (2000).
Both an A0-A3 III-V and a G2-3 V standard stars were observed
immediately before or after each target to obtain very small
differences in airmass (differences of 0.008 and 0.007 in airmasses
were accomplished for IGR J16358-4726 and IGR J16393-4643,
respectively). To compute the telluric features in the region of the H I 21 661 Å (Brackett-![]() line, or Br
line, or Br![]() ),
which is the only non-telluric feature in the A-star spectra, we
employed the observed G-star spectra divided by a solar spectrum
),
which is the only non-telluric feature in the A-star spectra, we
employed the observed G-star spectra divided by a solar spectrum![]() that had been properly degraded in resolution and dispersion corrected
with the dispersion solution obtained for the ISAAC spectra. The
spectra of the A star, G star, and the solar one were then aligned in
wavelength space. A telluric spectrum for each science target was
obtained by patching into the A-star spectrum the ratio of the G star
to the solar spectrum in the Br
that had been properly degraded in resolution and dispersion corrected
with the dispersion solution obtained for the ISAAC spectra. The
spectra of the A star, G star, and the solar one were then aligned in
wavelength space. A telluric spectrum for each science target was
obtained by patching into the A-star spectrum the ratio of the G star
to the solar spectrum in the Br![]() region (we selected the range 21 590-21 739 Å). We then
corrected for telluric absorption by dividing each science spectrum by
its corresponding telluric spectrum. A scale and a shift factor were
applied to the calibration telluric spectrum, to correct in the most
accurate way for the airmass difference and the possible constant
wavelength shift; the optimal values for these parameters were then
obtained using an iterative procedure that minimizes the residual
noise.
region (we selected the range 21 590-21 739 Å). We then
corrected for telluric absorption by dividing each science spectrum by
its corresponding telluric spectrum. A scale and a shift factor were
applied to the calibration telluric spectrum, to correct in the most
accurate way for the airmass difference and the possible constant
wavelength shift; the optimal values for these parameters were then
obtained using an iterative procedure that minimizes the residual
noise.
![\begin{figure}
\par\includegraphics[width=18cm]{13410fg1.eps}
\end{figure}](/articles/aa/full_html/2010/08/aa13410-09/img21.png)
|
Figure 1:
K-band spectrum of 2MASS J16355369-4725398 and
2MASS J16390535-4642137, the infrared counterparts to
IGR J16358-47262 and IGR J16393-4643, respectively (first two
spectra from above). The positions of identified spectral features are
marked by solid lines. With the aim of comparison, we also show the K-band
spectrum of a blue supergiant (third spectrum from above). The three
targets were observed in the same night with the same
telescope/instrument configuration. Data reduction was performed in the
same way. 12CO absorption bands (
|
| Open with DEXTER | |
3 Results
We present the spectral analysis and classification results for the two
targets. The field of NIR spectral classification has not yet been
fully developed and the level of S/N and resolution required to perform a quantitative profile analysis are very high (
![]() and
and
![]() ). Our analysis is therefore qualitative, based on comparison with available NIR spectral atlases.
). Our analysis is therefore qualitative, based on comparison with available NIR spectral atlases.
The spectra are shown in Fig. 1 (first two spectra from above), while their most remarkable features are reported in Table 2.
Errors in the equivalent widths are evaluated as the deviations from
their mean values, measured using different values for the continuum.
For the sake of comparison, we included in Fig. 1
the spectrum of IGR J16493-4348 (third spectrum from above), a
supergiant X-ray binary (SGXRB) that we observed during the same night
and conditions as the previous ones. The two first spectra are very
similar, their most prominent features being the series of strong CO
absorption bands between 2.29 and 2.40 ![]() m,
which are characteristic of late-type stars.
Several metallic lines are clearly recognizable, although at our
resolution they are generally blended. Although weaker than the CO
bands, they appear significant within the measured errors.
m,
which are characteristic of late-type stars.
Several metallic lines are clearly recognizable, although at our
resolution they are generally blended. Although weaker than the CO
bands, they appear significant within the measured errors.
We also tentatively detected He I 20 581 Å and Br![]() in faint emission in both spectra; since they are not a typical
spectral feature of late-type stars, these lines might be the signature
of an accretion disk around the compact object. However, they are very
weak, and we cannot exclude that they might be a residual artifact from
the telluric lines removal procedure, which for this region should be
performed with great care. This interpretation is consistent with the
almost identical profile of the Br
in faint emission in both spectra; since they are not a typical
spectral feature of late-type stars, these lines might be the signature
of an accretion disk around the compact object. However, they are very
weak, and we cannot exclude that they might be a residual artifact from
the telluric lines removal procedure, which for this region should be
performed with great care. This interpretation is consistent with the
almost identical profile of the Br![]() line in the two spectra. In any case, emission features typical of
X-ray binaries do not seem to be present in almost all of the optical
spectra of SyXBs (see Masetti et al. 2007,2006).
This is because of the high total luminosity of these evolved giant
companions, that should overwhelm the light derived from the
reprocessing of X-ray irradiation.
line in the two spectra. In any case, emission features typical of
X-ray binaries do not seem to be present in almost all of the optical
spectra of SyXBs (see Masetti et al. 2007,2006).
This is because of the high total luminosity of these evolved giant
companions, that should overwhelm the light derived from the
reprocessing of X-ray irradiation.
Table 2: K-band line identifications for IGR J16358-4724, denoted by (I), and IGR J16393-4643 (II).
Our ISAAC spectra clearly infer that both objects are of late-type and
exclude that the systems are HMXBs with OB companions. From the
identified spectral lines, our conclusion is that both stars are of K
or M spectral type (see, for instance, Kleinmann & Hall 1986; Förster Schreiber 2000; Ivanov et al. 2004,
for a comparison with atlases of cold stars). The forbidden [Fe II]
transition at 22 200 Å detected in IGR J16358-4726 by Chaty et al. (2008)
is not present in our spectrum. The general morphology of the spectra
and the comparison between the relative strength of CO 22 900 Å
and both Na I and Ca I lines, which are luminosity indicators (Ramírez et al. 1997), indicate that both stars are giants. In particular, from the empirical relation EW(CO) versus.
![]() that these authors found, our EW(12CO(2, 0)) infers a K giant classification for both objects, and nominal values of
that these authors found, our EW(12CO(2, 0)) infers a K giant classification for both objects, and nominal values of
![]() K for IGR J16358-4726 and
K for IGR J16358-4726 and
![]() K for IGR J16393-4643.
K for IGR J16393-4643.
We believe that the level of precision achievable in our spectral
classification cannot be higher than this, because of the lack of
reliable
![]() indicators in the K-band in this spectral type range. Adequate indicators in the NIR domain are present in the J and H bands (Wright et al. 2008). Unfortunately, we have no spectra for these ranges.
indicators in the K-band in this spectral type range. Adequate indicators in the NIR domain are present in the J and H bands (Wright et al. 2008). Unfortunately, we have no spectra for these ranges.
To corroborate the accuracy of our analysis and to avoid any possible mistaking of CO absorption bands with telluric components, we included in Fig. 1, besides the spectra from the two sources described in this work, the spectrum of IGR J16493-4348, a SGXRB that we observed in the same night and conditions as the previous ones. We classified the counterpart to IGR J16493-4348 as a B0.5Ib star (Nespoli et al. 2008b) and, as one can see, the telluric corrected spectrum of the source shows no evidence of the deep absorption features that characterize the spectra that are the subject of this work.
![\begin{figure}
\par\includegraphics[width=8cm,clip]{13410fg2.eps}
\end{figure}](/articles/aa/full_html/2010/08/aa13410-09/img47.png)
|
Figure 2: Spectral energy distribution of IGR J16358-4724 (crosses) and SED obtained from intrinsic colors for three different spectral types (lines). The errors for the photometric data are within the size of the marks. |
| Open with DEXTER | |
In Figs. 2 and 3, we present the spectral energy distribution of IGR J16358-4724 and IGR J16393-4643, respectively, in the log
![]() - log
- log ![]() plane, using photometry given by Chaty et al. (2008) and Rahoui et al. (2008). This includes photometry in the bands RIJHK and the GLIMPSE 3.6
plane, using photometry given by Chaty et al. (2008) and Rahoui et al. (2008). This includes photometry in the bands RIJHK and the GLIMPSE 3.6 ![]() m and 4.5
m and 4.5 ![]() m bands for both sources; for IGR J16393-4643, V
photometry was also available. We built SEDs corresponding to different
spectral types, according to the intrinsic colors given by Pickles (1998) for optical/NIR bands and by Koornneef (1983)
for MIR. In the figures, data are marked by crosses, and fitted SEDs by
lines. Photometric data and spectral type distributions are normalized
in the K band. We did not attempt formal fitting procedures.
The aim of the figures is to illustrate that very different choices of
spectral type and reddening produce reasonable fits to the data. In our
calculation, we employed the mean extinction law,
RV= 3.1 (Rieke & Lebofsky 1985).
m bands for both sources; for IGR J16393-4643, V
photometry was also available. We built SEDs corresponding to different
spectral types, according to the intrinsic colors given by Pickles (1998) for optical/NIR bands and by Koornneef (1983)
for MIR. In the figures, data are marked by crosses, and fitted SEDs by
lines. Photometric data and spectral type distributions are normalized
in the K band. We did not attempt formal fitting procedures.
The aim of the figures is to illustrate that very different choices of
spectral type and reddening produce reasonable fits to the data. In our
calculation, we employed the mean extinction law,
RV= 3.1 (Rieke & Lebofsky 1985).
We plot a blue supergiant and two red giants as representative examples of possible spectral types. We found that, even with slight differences, every spectral type can be fitted to the data by choosing the appropriate value of extinction. In the case of IGR J16358-4726, we obtained best fits by choosing AV = 20 mag for a B0I type, AV = 14 mag for a K0III type, and AV=13 mag for a M0III type. Analogous results were obtained for IGR J16393-4643 with AV = 12 for a B0I, AV = 8 mag for a K0III and AV = 6 mag for a M0III.
![\begin{figure}
\par\includegraphics[width=8cm,clip]{13410fg3.eps}
\end{figure}](/articles/aa/full_html/2010/08/aa13410-09/img50.png)
|
Figure 3: The same as Fig. 2, for IGR J16393-4643. The errors in the photometric data are within the size of the plot symbols. |
| Open with DEXTER | |
The reason why very different spectral types are able to reasonably fit the data is the degeneracy between the direction of the reddening vector and the effective temperature variation in the spectral range that we employed, which makes almost every spectral type possible if the opportune extinction value is chosen. The results provided by SED fitting do not therefore allow the spectral classification to be improved, but provide a valuable tool with which to calculate the interstellar extinction of any assumed spectral type.
In the case of IGR J16393-4643, the low values obtained for the
extinction are inconsistent with the high hydrogen column density
measured in the X-ray range, namely
![]() cm-2.
This may indicate that the star is not the true counterpart to the
system; another explanation could be an additional source of extinction
intrinsic to the system, which only affects the compact object where
the X-ray emission originates. Enormous amounts of absorption, with
cm-2.
This may indicate that the star is not the true counterpart to the
system; another explanation could be an additional source of extinction
intrinsic to the system, which only affects the compact object where
the X-ray emission originates. Enormous amounts of absorption, with
![]() cm-2, has been observed for other SyXBs, (see, for instance, Mattana et al. 2006).
cm-2, has been observed for other SyXBs, (see, for instance, Mattana et al. 2006).
For the aforementioned spectral types and corresponding extinction values, we calculated the distance using the relation MK = K + 5 - 5 log d - AK. In each case, absolute magnitudes and intrinsic color indices were obtained from Pickles (1998). The estimated distance values were, for IGR J16358-4726: 36.6 kpc (if B0I), 1.4 kpc (if K0III), and 20.1 kpc (if M0III); for IGR J16393-4643: 24.1 kpc (if B0I), 1.0 kpc (if K0III), and 13.9 kpc (if M0III). For both sources, a type B0I counterpart would thus provide an unrealistically large estimate of the distance; the same occurs, for IGR J16358-4726 only, in the case of a M0III companion.
The remaining estimates are compatible with both the classical (four arms, Vallée 2008) and the more recently proposed (two main arms, Churchwell et al. 2009) spiral structure models of our Galaxy. A K0I companion would locate both sources in the Sagittarius/Carina inner arm according to the classical model, or the Sagittarius minor arm, according to the most recently proposed model. Finally, a M0III companion for IGR J16393-4643 would imply that the source is placed in the tangential region of the Norma arm with both models.
The error estimation for the distance depends mainly on the error in
the mean absolute magnitude assigned to the spectral type, which can be
very large and reach more than 50![]() when propagated to the distance calculation. Since the derived
extinction value for each type would also apply to a wide range of
subtypes, the consequent distance value range would largely extend. The
distance inferred should thus be interpreted with care.
when propagated to the distance calculation. Since the derived
extinction value for each type would also apply to a wide range of
subtypes, the consequent distance value range would largely extend. The
distance inferred should thus be interpreted with care.
4 Discussion
On the basis of the spectral classification of the proposed counterparts as cold giants/supergiants and the X-ray features of the systems illustrated in Sect. 1, we propose that both of them belong to the class of SyXBs, in which the companion to the neutron star is an evolved late-type star. In the discussion that follows, we use the terms giant and supergiant in its physical sense, i.e., related to the mass, internal structure, and evolutionary status of the star and not to its luminosity class. As discussed above, a precise determination of the spectral type and luminosity class is difficult using our K-band spectra.A red giant represents the late evolutionary stage of either a low-mass star (0.8 to 2.3 ![]() )
or an intermediate-mass star (2.3 to 10
)
or an intermediate-mass star (2.3 to 10 ![]() ).
The red giant phase includes the shell hydrogen-burning phase (first
giant branch), the core helium-burning phase (horizontal branch or
``red clump'' for low-mass stars, ``blue loop'' for intermediate-mass
stars), and the shell helium-burning phase (asymptotic giant branch).
We refer, for instance, to Iben (1974) and Iben & Renzini (1983). Red supergiants are short-lived stages in the late evolution of moderately massive stars (10 to 25
).
The red giant phase includes the shell hydrogen-burning phase (first
giant branch), the core helium-burning phase (horizontal branch or
``red clump'' for low-mass stars, ``blue loop'' for intermediate-mass
stars), and the shell helium-burning phase (asymptotic giant branch).
We refer, for instance, to Iben (1974) and Iben & Renzini (1983). Red supergiants are short-lived stages in the late evolution of moderately massive stars (10 to 25 ![]() ,
see Figer et al. 2006; Massey et al. 2009).
,
see Figer et al. 2006; Massey et al. 2009).
In the case of IGR J16358-4724, we classified the proposed
counterpart as a K-M giant/supergiant. Strong support for this system
hosting a neutron star is provided by the detection of X-ray pulsations
(Patel et al. 2004)
in addition to the description of the X-ray energy spectrum as an
absorbed power law model, a high energy cut-off, and an Fe line (Patel et al. 2007),
which are typical features of neutron stars in Galactic X-ray binaries.
The designation of 2MASS J16355369-4725398 as a counterpart was
confirmed in the literature (see Chaty et al. 2008; Kouveliotou et al. 2003). Previous NIR spectroscopy from Chaty et al. (2008)
was used to classify it as a sgB[e], but, as the authors warned, their
NIR spectrum was very faint and extremely absorbed. By ending at
2.3 ![]() m, it also missed the last and most significant portion of the K
band, where CO bands clearly indicate the K-M spectral type of the
star. We propose that these factors could lead to a misclassification
of the system.
m, it also missed the last and most significant portion of the K
band, where CO bands clearly indicate the K-M spectral type of the
star. We propose that these factors could lead to a misclassification
of the system.
In the case of IGR J16393-4643, our spectrum is also indicative of a K-M giant/supergiant. The presence of a pulsar in the binary system is validated by both the spectral shape of the X-ray emission (Bodaghee et al. 2006) and the detection of pulsations (T06). Because of its magnitude, the optical counterpart that we considered is the most probable one among the four objects within the error circle of the X-ray detection.
According to T06, IGR J16393-4643 has an orbital period of 3.7 days and a mass function of 6.5 ![]() (orbital solution 1 in T06). It seems unlikely that an
intermediate-mass red giant can fit in such a narrow orbit. To check
this, we use the physical parameters of a 7
(orbital solution 1 in T06). It seems unlikely that an
intermediate-mass red giant can fit in such a narrow orbit. To check
this, we use the physical parameters of a 7 ![]() star along its evolutionary track given by Schaller et al. (1992).
star along its evolutionary track given by Schaller et al. (1992).
The size of the Roche lobe of a star in a binary system is usually characterized by the Roche radius ![]() ,
defined as the radius of a sphere that has the same volume as the Roche lobe. To calculate the Roche radius, we used the Eggleton (1983) approximation
,
defined as the radius of a sphere that has the same volume as the Roche lobe. To calculate the Roche radius, we used the Eggleton (1983) approximation
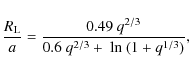
where a is the semimajor axis and q is the mass ratio of the binary components (
To obtain the Roche radius for solution 1 of T06, we first calculated the major axis of the orbit from the third Kepler law
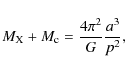
where G is the gravitational constant that we wrote as
![]() d-2, a is the semimajor axis, and p = 3.7 d is the orbital period. For the above parameters, we obtained a Roche radius of
d-2, a is the semimajor axis, and p = 3.7 d is the orbital period. For the above parameters, we obtained a Roche radius of
![]() .
.
According to Schaller et al. (1992), the radius of a 7 ![]() star at the beginning of the giant branch is 86.5
star at the beginning of the giant branch is 86.5 ![]() .
During its later evolution, at the core He-burning phase, the minimum radius reached is 50
.
During its later evolution, at the core He-burning phase, the minimum radius reached is 50 ![]() .
The only evolutionary phase in which a 7
.
The only evolutionary phase in which a 7 ![]() star can fit wihin a 10.68
star can fit wihin a 10.68 ![]() Roche lobe is during the main sequence, for temperatures higher than
15 000 K. This corresponds to a B-type spectrum, which is
completely rejected by our spectral classification. This result shows
that the system IGR J16393-4643, in the binary orbit proposed by
T06, cannot harbor a late-type giant star of
Roche lobe is during the main sequence, for temperatures higher than
15 000 K. This corresponds to a B-type spectrum, which is
completely rejected by our spectral classification. This result shows
that the system IGR J16393-4643, in the binary orbit proposed by
T06, cannot harbor a late-type giant star of ![]() 7
7 ![]() .
.
Among the orbital solutions calculated by T06, the above discussion
thus excludes solution 1. Our conclusion may be supported by the
non-detection of any orbital period of the order of a few days (as
solution 1 estimates) by Bodaghee et al. (2006)
from ISGRI light curves. We also exclude solution 3 because of, as the
authors point out, its statistical weakness and physically unrealistic
constraints. Although statistically less favored than the first,
solution 2 appears to be the only acceptable solution. With a mass
function of 0.092 ![]() and an orbital period of 50.2 days, it is indeed compatible with our spectral classification, as we now show.
and an orbital period of 50.2 days, it is indeed compatible with our spectral classification, as we now show.
To constrain the mass of the companion, we calculated, for increasing values of mass, the corresponding radius at the beginning of the giant branch, and compared it with the maximum permitted one, i.e., the Roche radius.
We again first calculated the major axis of the orbit by applying the third Kepler law in Eq. (2), using p = 50.2 d from solution 2 as the orbital period.
Table 3:
Results from the analysis of the orbital parameters of IGR J16393-4643 for different values of mass of the companion star ![]() .
.
Table 4: Synoptic table reporting the main known parameters for IGR J16358-4724 and IGR J16393-4643.
Taking the common approximation
![]()
![]() ,
we solved Eq. (2) with respect to a for different values of
,
we solved Eq. (2) with respect to a for different values of ![]() ,
and employed the retrieved value in Eq. (1)
to obtain the corresponding Roche radius. We then considered a red
giant at the beginning of the giant branch, took tabulated values of
,
and employed the retrieved value in Eq. (1)
to obtain the corresponding Roche radius. We then considered a red
giant at the beginning of the giant branch, took tabulated values of
![]() and L from Schaller et al. (1992), and solved the black-body equation,
and L from Schaller et al. (1992), and solved the black-body equation,
![]() ,
to obtain the stellar radius. For each value of mass, starting with
,
to obtain the stellar radius. For each value of mass, starting with
![]()
![]() ,
we compared the retrieved radius with the Roche radius of the system. Results from this analysis are reported in Table 3,
where we also show, for each case, the corresponding spectral type,
obtained from temperature and luminosity, and the inclination i of the system as calculated from the mass function of solution 2.
,
we compared the retrieved radius with the Roche radius of the system. Results from this analysis are reported in Table 3,
where we also show, for each case, the corresponding spectral type,
obtained from temperature and luminosity, and the inclination i of the system as calculated from the mass function of solution 2.
We emphasize that the parameters ![]() and i in Table 3
correspond to the beginning of the first giant branch ascent. In
consequence, they only represent a lower limit to the radius and upper
limit to the inclination angle for stars of the given mass.
and i in Table 3
correspond to the beginning of the first giant branch ascent. In
consequence, they only represent a lower limit to the radius and upper
limit to the inclination angle for stars of the given mass.
Up to
![]()
![]() ,
a red giant is able to fit within the orbit foreseen by solution 2 of
T06, while for higher values the stellar radius would exceed the Roche
radius of the system. We thus set an upper limit of 5
,
a red giant is able to fit within the orbit foreseen by solution 2 of
T06, while for higher values the stellar radius would exceed the Roche
radius of the system. We thus set an upper limit of 5 ![]() to the mass of the companion star. This mass limit excludes the
possibility that the companion is a supergiant since the lower limit to
the mass of a red supergiant is 10
to the mass of the companion star. This mass limit excludes the
possibility that the companion is a supergiant since the lower limit to
the mass of a red supergiant is 10 ![]() as discussed above.
as discussed above.
An alternative explanation is that 2MASS J16390535-4642137 is not the true optical/infrared counterpart to IGR J16393-4643. A spectroscopic study of the other three stars (see Chaty et al. 2008, Fig. 2c) found in the error box of the X-ray source is needed to confirm or exclude this case. If one of those targets were an OB supergiant, this would then support the classification of the system as a HMXB, and would make the orbital solution 1 from T06 acceptable.
For the sake of comparison, we collect in Table 4 the main properties of the two systems studied, thus extending Table 3 by Masetti et al. (2007). The mass accretion rate was calculated from the X-ray luminosity, as

where
Although the class of SyXBs is not yet well characterized we note that the known properties of these two systems and those of the other six members are homogeneous. We confirm the peculiarity of the class with respect to the spin, which exhibits periodicities spanning a wide range, from hundreds of seconds to hours (see Masetti et al. 2007, and references therein).
5 Conclusions
We have used infrared medium-resolution spectroscopy to classify the proposed counterparts to IGR J16358-4724 and IGR J16393-4643. In this work, we have found that:
- -
- Both objects exhibit the typical features of cold giant or supergiant stars. Our classification constrains the spectral type to be K-M.
- -
- Previous classifications of the systems as HMXBs have been dismissed.
- -
- Spectral classifications of the counterparts as late type-giant stars, and an X-ray behavior characteristic of neutron stars known from previous works, has allowed us to include both systems in the SyXB class, increasing the number of this group from six to eight members.
- -
- Among the orbital solutions for IGR J16393-4643 proposed by Thompson et al. (2006) from a pulse-timing analysis, only one, with a mass function of 0.092
 and orbital period of 50.2 days, is compatible with our spectral classification.
- -
- An upper limit to the mass of the companion star in IGR J16393-4643 was set to be 5 .
Note added in proof. From RXTE/PCA and Swift/BAT light curves,
Corbet et al. (2010, ATel 2570) reported a 4.24 d orbital period
for IGR J16393-4643. We have repeated the calculations presented in
Sect. 4, and found that a red giant with mass up to 2 ![]() can have such an orbital period. Therefore, the newly discovered
orbital period is compatible with IGR J16393-4643 being a symbiotic
system.
can have such an orbital period. Therefore, the newly discovered
orbital period is compatible with IGR J16393-4643 being a symbiotic
system.
The work of E.N. and J.F. is supported by the Spanish Ministerio de Educación y Ciencia, and FEDER, under contract AYA 2007-62487. This work has been partly supported by the Generalitat Valenciana project of excellence PROMETEO/2009/064. E.N. acknowledges a ``V Segles'' research grant from the University of Valencia. R.E.M. acknowledges support by Fondecyt 1070705, the Chilean Center for Astrophysics FONDAP 15010003 and the BASAL Centro de Astrofísica y Tecnologías Afines (CATA) PFB-06/2007.
References
- Barlow, E. J., Knigge, C., Bird, A. J., et al. 2006, MNRAS, 372, 224 [NASA ADS] [CrossRef] [Google Scholar]
- Bird, A. J., Malizia, A., Bazzano, A., et al. 2007, ApJS, 170, 175 [NASA ADS] [CrossRef] [Google Scholar]
- Bird, A. J., Bazzano, A., Bassani, L., et al. 2010, ApJS, 186, 1 [NASA ADS] [CrossRef] [Google Scholar]
- Bodaghee, A., Walter, R., Zurita Heras, J. A., et al. 2006, A&A, 447, 1027 [NASA ADS] [CrossRef] [EDP Sciences] [Google Scholar]
- Chakrabarty, D., & Roche, P. 1997, ApJ, 489, 254 [NASA ADS] [CrossRef] [Google Scholar]
- Chaty, S., Rahoui, F., Foellmi, C., et al. 2008, A&A, 484, 783 [NASA ADS] [CrossRef] [EDP Sciences] [Google Scholar]
- Churchwell, E., Babler, B. L., Meade, M. R., et al. 2009, PASP, 121, 213 [NASA ADS] [CrossRef] [Google Scholar]
- Clark, J. S., & Steele, I. A. 2000, A&AS, 141, 65 [NASA ADS] [CrossRef] [EDP Sciences] [Google Scholar]
- Davidsen, A., Malina, R., & Bowyer, S. 1977, ApJ, 211, 866 [NASA ADS] [CrossRef] [Google Scholar]
- Eggleton, P. P. 1983, ApJ, 268, 368 [NASA ADS] [CrossRef] [Google Scholar]
- Figer, D. F., MacKenty, J. W., Robberto, M., et al. 2006, ApJ, 643, 1166 [NASA ADS] [CrossRef] [Google Scholar]
- Förster Schreiber, N. M. 2000, AJ, 120, 2089 [NASA ADS] [CrossRef] [Google Scholar]
- García, M., Baliunas, S. L., Elvis, M., et al. 1983, ApJ, 267, 291 [NASA ADS] [CrossRef] [Google Scholar]
- Iben, Jr., I. 1974, ARA&A, 12, 215 [NASA ADS] [CrossRef] [Google Scholar]
- Iben, Jr., I., & Renzini, A. 1983, ARA&A, 21, 271 [NASA ADS] [CrossRef] [Google Scholar]
- Ivanov, V. D., Rieke, M. J., Engelbracht, C. W., et al. 2004, ApJS, 151, 387 [NASA ADS] [CrossRef] [Google Scholar]
- Kaplan, D. L., Levine, A. M., Chakrabarty, D., et al. 2007, ApJ, 661, 437 [NASA ADS] [CrossRef] [Google Scholar]
- Kleinmann, S. G., & Hall, D. N. B. 1986, ApJS, 62, 501 [NASA ADS] [CrossRef] [Google Scholar]
- Koornneef, J. 1983, A&A, 128, 84 [NASA ADS] [Google Scholar]
- Kouveliotou, C., Patel, S., Tennant, A., et al. 2003, IAU Circ., 8109, 2 [NASA ADS] [Google Scholar]
- Lutovinov, A., Revnivtsev, M., Gilfanov, M., et al. 2005, A&A, 444, 821 [NASA ADS] [CrossRef] [EDP Sciences] [Google Scholar]
- Malizia, A., Bassani, L., di Cocco, G., et al. 2004, The Astronomer's Telegram, 227, 1 [NASA ADS] [Google Scholar]
- Masetti, N., Dal Fiume, D., Cusumano, G., et al. 2002, A&A, 382, 104 [NASA ADS] [CrossRef] [EDP Sciences] [Google Scholar]
- Masetti, N., Orlandini, M., Palazzi, E., Amati, L., & Frontera, F. 2006, A&A, 453, 295 [NASA ADS] [CrossRef] [EDP Sciences] [Google Scholar]
- Masetti, N., Landi, R., Pretorius, M. L., et al. 2007, A&A, 470, 331 [NASA ADS] [CrossRef] [EDP Sciences] [Google Scholar]
- Masetti, N., Parisi, P., Palazzi, E., et al. 2009, A&A, 495, 121 [NASA ADS] [CrossRef] [EDP Sciences] [Google Scholar]
- Massey, P., Silva, D. R., Levesque, E. M., et al. 2009, ApJ, 703, 420 [NASA ADS] [CrossRef] [Google Scholar]
- Mattana, F., Götz, D., Falanga, M., et al. 2006, A&A, 460, L1 [NASA ADS] [CrossRef] [EDP Sciences] [Google Scholar]
- Mereghetti, S., Esposito, P., Tiengo, A., et al. 2006, ApJ, 653, 1423 [NASA ADS] [CrossRef] [Google Scholar]
- Moorwood, A., Cuby, J.-G., Biereichel, P., et al. 1998, The Messenger, 94, 7 [NASA ADS] [Google Scholar]
- Negueruela, I., Smith, D. M., Torrejón, J. M., & Reig, P. 2007, in ESA Special Publication, 622, 255 [Google Scholar]
- Nespoli, E., Fabregat, J., & Mennickent, R. E. 2008a, The Astronomer's Telegram, 1450, 1 [NASA ADS] [Google Scholar]
- Nespoli, E., Fabregat, J., & Mennickent, R. E. 2008b, The Astronomer's Telegram, 1396, 1 [Google Scholar]
- Nespoli, E., Fabregat, J., & Mennickent, R. E. 2008c, A&A, 486, 911 [NASA ADS] [CrossRef] [EDP Sciences] [Google Scholar]
- Nucita, A. A., Carpano, S., & Guainazzi, M. 2007, A&A, 474, L1 [NASA ADS] [CrossRef] [EDP Sciences] [Google Scholar]
- Patel, S. K., Kouveliotou, C., Tennant, A., et al. 2004, ApJ, 602, L45 [NASA ADS] [CrossRef] [Google Scholar]
- Patel, S. K., Zurita, J., Del Santo, M., et al. 2007, ApJ, 657, 994 [NASA ADS] [CrossRef] [Google Scholar]
- Pickles, A. J. 1998, PASP, 110, 863 [CrossRef] [Google Scholar]
- Rahoui, F., Chaty, S., Lagage, P.-O., & Pantin, E. 2008, A&A, 484, 801 [NASA ADS] [CrossRef] [EDP Sciences] [Google Scholar]
- Ramírez, S. V., Depoy, D. L., Frogel, J. A., Sellgren, K., & Blum, R. D. 1997, AJ, 113, 1411 [NASA ADS] [CrossRef] [Google Scholar]
- Revnivtsev, M. G., Sazonov, S. Y., Gilfanov, M. R., & Sunyaev, R. A. 2003, Astron. Lett., 29, 587 [NASA ADS] [CrossRef] [Google Scholar]
- Rieke, G. H., & Lebofsky, M. J. 1985, ApJ, 288, 618 [NASA ADS] [CrossRef] [Google Scholar]
- Schaller, G., Schaerer, D., Meynet, G., & Maeder, A. 1992, A&AS, 96, 269 [Google Scholar]
- Sguera, V., Bazzano, A., Bird, A. J., et al. 2006, ApJ, 646, 452 [NASA ADS] [CrossRef] [Google Scholar]
- Sidoli, L., Romano, P., Mereghetti, S., et al. 2007, A&A, 476, 1307 [NASA ADS] [CrossRef] [EDP Sciences] [Google Scholar]
- Smith, D. M., Heindl, W. A., Markwardt, C. B., et al. 2006, ApJ, 638, 974 [NASA ADS] [CrossRef] [Google Scholar]
- Sugizaki, M., Mitsuda, K., Kaneda, H., et al. 2001, ApJS, 134, 77 [NASA ADS] [CrossRef] [Google Scholar]
- Thompson, T. W. J., Tomsick, J. A., Rothschild, R. E., in't Zand, J. J. M., & Walter, R. 2006, ApJ, 649, 373 [NASA ADS] [CrossRef] [Google Scholar]
- Vallée, J. P. 2008, AJ, 135, 1301 [NASA ADS] [CrossRef] [Google Scholar]
- Walter, R., Zurita Heras, J., Bassani, L., et al. 2006, A&A, 453, 133 [NASA ADS] [CrossRef] [EDP Sciences] [Google Scholar]
- Wright, N. J., Greimel, R., Barlow, M. J., et al. 2008, MNRAS, 390, 929 [NASA ADS] [CrossRef] [Google Scholar]
Footnotes
- ... binaries
- Based on observations collected at the European Southern Observatory, Chile (Programme ID 079.D-0668-B).
- ... IRAF
- IRAF is distributed by the National Optical Astronomy Observatories which is operated by the Association of Universities for Research in Astronomy, Inc. under contract with the National Science Foundation.
- ... spectrum
- We used the NSO/Kitt Peak FTS solar spectrum, produced by NSF/NOAO.
All Tables
Table 1: ISAAC/VLT journal of observations.
Table 2: K-band line identifications for IGR J16358-4724, denoted by (I), and IGR J16393-4643 (II).
Table 3:
Results from the analysis of the orbital parameters of IGR J16393-4643 for different values of mass of the companion star ![]() .
.
Table 4: Synoptic table reporting the main known parameters for IGR J16358-4724 and IGR J16393-4643.
All Figures
|
|
Figure 1:
K-band spectrum of 2MASS J16355369-4725398 and
2MASS J16390535-4642137, the infrared counterparts to
IGR J16358-47262 and IGR J16393-4643, respectively (first two
spectra from above). The positions of identified spectral features are
marked by solid lines. With the aim of comparison, we also show the K-band
spectrum of a blue supergiant (third spectrum from above). The three
targets were observed in the same night with the same
telescope/instrument configuration. Data reduction was performed in the
same way. 12CO absorption bands (
|
| Open with DEXTER | |
| In the text | |
|
|
Figure 2: Spectral energy distribution of IGR J16358-4724 (crosses) and SED obtained from intrinsic colors for three different spectral types (lines). The errors for the photometric data are within the size of the marks. |
| Open with DEXTER | |
| In the text | |
|
|
Figure 3: The same as Fig. 2, for IGR J16393-4643. The errors in the photometric data are within the size of the plot symbols. |
| Open with DEXTER | |
| In the text | |
Copyright ESO 2010
Current usage metrics show cumulative count of Article Views (full-text article views including HTML views, PDF and ePub downloads, according to the available data) and Abstracts Views on Vision4Press platform.
Data correspond to usage on the plateform after 2015. The current usage metrics is available 48-96 hours after online publication and is updated daily on week days.
Initial download of the metrics may take a while.