| Issue |
A&A
Volume 515, June 2010
|
|
|---|---|---|
| Article Number | A87 | |
| Number of page(s) | 13 | |
| Section | Stellar structure and evolution | |
| DOI | https://doi.org/10.1051/0004-6361/200913490 | |
| Published online | 11 June 2010 | |
Seismic
and spectroscopic
characterization of the solar-like pulsating CoRoT target HD 49385![[*]](/icons/foot_motif.png) ,
,
S. Deheuvels1 - H. Bruntt1 - E. Michel1 - C. Barban1 - G. Verner2 - C. Régulo3,4 - B. Mosser1 - S. Mathur5 - P. Gaulme6 - R. A. Garcia7,8 - P. Boumier6 - T. Appourchaux6 - R. Samadi1 - C. Catala1 - F. Baudin6 - A. Baglin1 - M. Auvergne1 - I. W. Roxburgh1,2 - F. Pérez Hernández3,4
1 - LESIA, UMR8109, Université Pierre et Marie
Curie, Université Denis Diderot, Observatoire de Paris, 92195 Meudon
Cedex, France
2 - Astronomy Unit, Queen Mary, University of London Mile End Road, London E1 4NS, UK
3 - Instituto de Astrofísica de Canarias, 38205, La Laguna, Tenerife, Spain
4 - Universidad de La Laguna, 38206 La Laguna, Tenerife, Spain
5 - Indian Institute of Astrophysics, Koramangala, Bangalore 560034, India
6 - Institut d'Astrophysique Spatiale, UMR8617, Université Paris XI, Bâtiment 121, 91405 Orsay Cedex, France
7 - Laboratoire AIM, CEA/DSM-CNRS-Université Paris Diderot; CEA, IRFU, SAp, centre de Saclay, 91191, Gif-sur-Yvette, France
8 - GEPI, Observatoire de Paris, CNRS, Université Paris Diderot; 5 place Jules Janssen, 92190 Meudon, France
Received 16 October 2009 / Accepted 8 March 2010
Abstract
Context. The star HD 49385 is the first G-type
solar-like pulsator observed in the seismology field of the space
telescope CoRoT. The satellite collected 137 days of high-precision
photometric data on this star, confirming that it presents solar-like
oscillations. HD 49385 was also observed in spectroscopy with the
NARVAL spectrograph in January 2009.
Aims. Our goal is to characterize HD 49385 using both spectroscopic and seismic data.
Methods. The fundamental stellar parameters of HD 49385 are
derived with the semi-automatic software VWA, and the projected
rotational velocity is estimated by fitting synthetic profiles to
isolated lines in the observed spectrum. A maximum likelihood
estimation is used to determine the parameters of the observed p modes.
We perform a global fit, in which modes are fitted simultaneously over
nine radial orders, with degrees ranging from ![]() to
to ![]() (36 individual modes).
(36 individual modes).
Results. Precise estimates of the atmospheric parameters (
![]() ,
[M/H],
,
[M/H], ![]() )
and of the
)
and of the ![]() of HD 49385 are obtained. The seismic analysis of the star leads to a clear identification of the modes for degrees
of HD 49385 are obtained. The seismic analysis of the star leads to a clear identification of the modes for degrees
![]() .
Around the maximum of the signal (
.
Around the maximum of the signal (
![]() Hz), some peaks are found significant and compatible with the expected characteristics of
Hz), some peaks are found significant and compatible with the expected characteristics of ![]() modes. Our fit yields robust estimates of the frequencies, linewidths and amplitudes of the modes. We find amplitudes of
modes. Our fit yields robust estimates of the frequencies, linewidths and amplitudes of the modes. We find amplitudes of ![]()
![]() ppm
for radial modes at the maximum of the signal. The lifetimes of the
modes range from one day (at high frequency) to a bit more than two
days (at low frequency). Significant peaks are found outside the
identified ridges and are fitted. They are attributed to mixed modes.
ppm
for radial modes at the maximum of the signal. The lifetimes of the
modes range from one day (at high frequency) to a bit more than two
days (at low frequency). Significant peaks are found outside the
identified ridges and are fitted. They are attributed to mixed modes.
Key words: methods: data analysis - methods: statistical - methods: observational - stars: oscillations - stars: individual: HD 49385
1 Introduction
In the Sun, oscillations are excited by the turbulent motions in the outer part of the external convective envelope and are further propagated into the interior of the star. The study of these oscillations has yielded constraints on the inner structure of the Sun, allowing us to estimate the sound speed and density profiles (Basu et al. 2003; Turck-Chièze et al. 2001), the position of the base of the convective zone (Christensen-Dalsgaard et al. 1991), and the rotation profile (Thompson et al. 2003; Mathur et al. 2008). However, the very low amplitude of these oscillations (a few ppm in photometry) makes it very challenging to detect and analyze them in other stars than the Sun.
Achieving a better understanding of the interiors of solar-like pulsations is one of the main objectives of the space mission CoRoT (Convection, Rotation and planetary Transits). CoRoT is a space telescope performing high-precision photometry over quasi-uninterrupted long observing runs (Baglin et al. 2006). Solar-like oscillations have already been studied in several other stars with CoRoT data. The analyses of these stars have encountered difficulties identifying the degrees of the modes, either because of a too low signal-to-noise ratio (HD 175726: Mosser et al. 2009b; HD 181906: García et al. 2009), or because of a too short lifetime of the modes, inducing large mode linewidths (HD 49933: Appourchaux et al. 2008; HD 181420: Barban et al. 2009).
The star HD 49385 is the first G-type solar-like pulsator observed in the seismology field of CoRoT. It is cooler than the solar-like pulsators previously analysed with CoRoT data, and probably more evolved (at the end of the main sequence or shortly after it). The choice of HD 49385 as a CoRoT target has motivated us to lead spectroscopic observations, performed with the NARVAL spectrograph at the Pic du Midi Observatory. The fundamental parameters of HD 49385 are derived from these observations, as described in Sect. 2. The photometric observations with CoRoT are presented in Sect. 3. Section 4 presents the study of the low-frequency part of the power spectrum, in search of a signature of the stellar rotation. The extraction of p-mode parameters is described in Sect. 5, and Sect. 6 is dedicated to conclusions.
2 Stellar parameters of HD 49385
The solar-like pulsator HD 49385 is a G0-type star with an apparent magnitude of
![]() (uvby catalog, Hauck & Mermilliod 1998).
To determine the fundamental parameters of HD 49385 we analysed a
high-quality spectrum from the NARVAL spectrograph mounted on the
2-m Bernard Lyot Telescope
at the Pic du Midi Observatory. We stacked two spectra
collected on 2009 January 10, totalizing an exposure time of
6600 s.
The spectrum was normalized by identifying continuum windows in a
synthetic spectrum and fitting a low-order spline through these points.
This was done order-by-order and we made sure the line depths agreed
for the overlapping part of
adjacent echelle orders. We measured a mean signal-to-noise (S/N) ratio
of 600 in the continuum for several line-free regions
in the range 5000-7000 Å for a data sampling of 2.7 data points
per resolution element (R=65 000).
(uvby catalog, Hauck & Mermilliod 1998).
To determine the fundamental parameters of HD 49385 we analysed a
high-quality spectrum from the NARVAL spectrograph mounted on the
2-m Bernard Lyot Telescope
at the Pic du Midi Observatory. We stacked two spectra
collected on 2009 January 10, totalizing an exposure time of
6600 s.
The spectrum was normalized by identifying continuum windows in a
synthetic spectrum and fitting a low-order spline through these points.
This was done order-by-order and we made sure the line depths agreed
for the overlapping part of
adjacent echelle orders. We measured a mean signal-to-noise (S/N) ratio
of 600 in the continuum for several line-free regions
in the range 5000-7000 Å for a data sampling of 2.7 data points
per resolution element (R=65 000).
2.1 Temperature,  and metalicity
We used the semi-automatic VWA software (Bruntt 2009)
to fit synthetic profiles for more than 600 lines in the range from
4135 to 8545 Å. We used a differential approach, meaning all
abundances are measured relative to exactly the same lines in the solar
spectral atlas from
Kurucz et al. (1984). This differential approach is described in more detail by Bruntt et al. (2008). As part of the analysis, we determined the atmospheric model
parameters
![]() ,
,
![]() ,
and the microturbulence. This was done by requiring that abundances determined from Fe I
lines do not correlate with the equivalent
width (EW) or the excitation potential (EP). Furthermore we required
that the same mean abundances are measured from the Fe I and Fe II lines (``ionization balance'').
We estimated the uncertainty on the model parameters by adjusting them until the correlations of Fe I with EW or EP became significant or the ionization
balance deviated (see Bruntt et al. 2008,
for details). We stress that the uncertainties are strictly internal
errors because the underlying assumption is that the model
atmosphere represents the star. Any systematic error in the temperature
profile or departures from local thermal equilibrium (LTE) will likely
affect the results.
We therefore quadratically added 50 K and 0.05 dex to the
uncertainty on
,
and the microturbulence. This was done by requiring that abundances determined from Fe I
lines do not correlate with the equivalent
width (EW) or the excitation potential (EP). Furthermore we required
that the same mean abundances are measured from the Fe I and Fe II lines (``ionization balance'').
We estimated the uncertainty on the model parameters by adjusting them until the correlations of Fe I with EW or EP became significant or the ionization
balance deviated (see Bruntt et al. 2008,
for details). We stress that the uncertainties are strictly internal
errors because the underlying assumption is that the model
atmosphere represents the star. Any systematic error in the temperature
profile or departures from local thermal equilibrium (LTE) will likely
affect the results.
We therefore quadratically added 50 K and 0.05 dex to the
uncertainty on
![]() and
and ![]() .
The spectroscopic parameters are listed in Table 1.
.
The spectroscopic parameters are listed in Table 1.
As an additional check of the surface gravity we fitted the wings of
the pressure sensitive Ca lines at 6122.2 and 6162.2 Å. This was
done by first adjusting the van der Waals constants to fit the solar
spectrum for the canonical value
![]() .
The fitted values for the two lines
for HD 49385 are
.
The fitted values for the two lines
for HD 49385 are
![]() and
and
![]() ,
which agrees very well with the Fe I/Fe II ionization balance.
The low value we obtain for the
,
which agrees very well with the Fe I/Fe II ionization balance.
The low value we obtain for the ![]() of HD 49385 indicates that it certainly is an evolved object.
of HD 49385 indicates that it certainly is an evolved object.
Table 1: Spectroscopic parameters of HD 49385.
The parameters agree well with the calibration of the Strömgren indices. From TEMPLOGG (Rogers 1995; Kupka & Bruntt 2001) we get
![]() K,
K,
![]() ,
and
,
and
![]() .
TEMPLOGG determines a significant interstellar reddening
.
TEMPLOGG determines a significant interstellar reddening
![]() .
If we assume zero interstellar reddening, we get from the V-K, using the Ramírez & Meléndez (2005) calibration,
.
If we assume zero interstellar reddening, we get from the V-K, using the Ramírez & Meléndez (2005) calibration,
![]() K and
K and ![]() K from b-y.
The uncertainties include the calibration uncertainty and the photometric uncertainty on the indices. Finally, Kovtyukh et al. (2004) used line-depth ratios
to determine effective temperatures of stars and found
K from b-y.
The uncertainties include the calibration uncertainty and the photometric uncertainty on the indices. Finally, Kovtyukh et al. (2004) used line-depth ratios
to determine effective temperatures of stars and found
![]() K (internal error). They also determined
K (internal error). They also determined ![]() and [Fe/H], but did not
give uncertainties on these two parameters:
and [Fe/H], but did not
give uncertainties on these two parameters:
![]() and
and
![]() .
In summary, our result from VWA agrees well with the
photometric calibrations and the line-depth ratio method for
.
In summary, our result from VWA agrees well with the
photometric calibrations and the line-depth ratio method for
![]() .
.
We found a high abundance of lithium in HD 49385 of
![]() (relative to the Sun). This value appears to be typical for a dwarf
star with solar metalicity (e.g., Boesgaard et al. 2005). We used the
line list from Ghezzi et al. (2009), but did not include the relatively weak
molecular CN bands; hence the Li abundance may be slightly
overestimated. The Li feature around 6707.8 is known to be strongly affected by
NLTE effects, but when using 3D instead of 1D atmosphere models these
two effects appear to cancel to first order (Asplund 2005). In other
words, because we are using 1D LTE models,
the imposed error should be relatively small. Furthermore, because we
are calculating abundances relative to the same Li line feature as in the
Sun, our estimate of [Li] should be robust as the atmospheric parameters
of the two stars are quite similar.
(relative to the Sun). This value appears to be typical for a dwarf
star with solar metalicity (e.g., Boesgaard et al. 2005). We used the
line list from Ghezzi et al. (2009), but did not include the relatively weak
molecular CN bands; hence the Li abundance may be slightly
overestimated. The Li feature around 6707.8 is known to be strongly affected by
NLTE effects, but when using 3D instead of 1D atmosphere models these
two effects appear to cancel to first order (Asplund 2005). In other
words, because we are using 1D LTE models,
the imposed error should be relatively small. Furthermore, because we
are calculating abundances relative to the same Li line feature as in the
Sun, our estimate of [Li] should be robust as the atmospheric parameters
of the two stars are quite similar.
The abundance pattern we determine is shown in Fig. 1 and listed in Table 2.
The overall metalicity is determined as the mean
of the metals with at least 10 lines used in the analysis
(Si, Ca, Ti, V, Cr, Fe, Co, Ni) giving
![]() .
This range is marked by the horizontal bar in Fig. 1.
.
This range is marked by the horizontal bar in Fig. 1.
| Figure 1:
Relative abundances of 22 elements measured in HD 49385.
Open and solid circles are mean values for neutral and
singly ionized lines, respectively.
The yellow horizontal bar marks the mean metalicity with 1- |
|
| Open with DEXTER | |
2.2 Projected rotational velocity
Because we have a relatively high-resolution spectrum with very high
S/N we were able to estimate the projected rotational velocity (![]() ).
We fitted synthetic profiles to ten isolated lines in the range
4600-6800 Å. We calculated the synthetic profiles with the SYNTH
software Valenti & Piskunov (1996),
thus taking into account weak blends. We considered three broadening
mechanisms which were convolved with the synthetic profiles: (1) the
instrumental resolution;
(2) macroturbulence (
).
We fitted synthetic profiles to ten isolated lines in the range
4600-6800 Å. We calculated the synthetic profiles with the SYNTH
software Valenti & Piskunov (1996),
thus taking into account weak blends. We considered three broadening
mechanisms which were convolved with the synthetic profiles: (1) the
instrumental resolution;
(2) macroturbulence (
![]() ); and (3)
); and (3) ![]() .
The instrumental power of resolution of NARVAL is R=65 000, but to check this value we fitted six narrow telluric lines around 6290 Å. We found that
a Gaussian function with a FWHM of 6290 Å/65 000 = 0.097 Å fitted these lines very well and we used the same value of R for the stellar lines.
For
.
The instrumental power of resolution of NARVAL is R=65 000, but to check this value we fitted six narrow telluric lines around 6290 Å. We found that
a Gaussian function with a FWHM of 6290 Å/65 000 = 0.097 Å fitted these lines very well and we used the same value of R for the stellar lines.
For ![]() and
and
![]() we calculated a
we calculated a
![]() grid of convolved profiles for 0-8 km s-1 in steps of 0.5 km s-1. To identify the best combination of
grid of convolved profiles for 0-8 km s-1 in steps of 0.5 km s-1. To identify the best combination of ![]() and
and
![]() we compared
the synthetic profile and the observed spectrum by computing the
we compared
the synthetic profile and the observed spectrum by computing the ![]() value.
value.
In Fig. 2 we show an example of the ![]() contour for the Fe I line at 6156.1 Å. The plots for all ten lines are very similar and show the same
strong correlation between
contour for the Fe I line at 6156.1 Å. The plots for all ten lines are very similar and show the same
strong correlation between ![]() and
and
![]() .
We marked three points on the contour in Fig. 2 with filled circles, and the synthetic profiles corresponding to these
grid points are shown in Fig. 3. The observed spectrum is shown with open circles. From our analysis we can put a firm upper limit on
.
We marked three points on the contour in Fig. 2 with filled circles, and the synthetic profiles corresponding to these
grid points are shown in Fig. 3. The observed spectrum is shown with open circles. From our analysis we can put a firm upper limit on ![]() of 5 km s-1,
corresponding to
of 5 km s-1,
corresponding to
![]() km s-1. The values that provide the best fit based on the analysis of the
km s-1. The values that provide the best fit based on the analysis of the ![]() contours for all ten lines are
contours for all ten lines are
![]() km s-1 and
km s-1 and
![]() km s-1.
km s-1.
![\begin{figure}
\par\includegraphics[width=8.4cm,clip]{13490fg2.eps}\vspace*{-2mm}
\end{figure}](/articles/aa/full_html/2010/07/aa13490-09/img53.png)
|
Figure 2:
Example of the |
| Open with DEXTER | |
![\begin{figure}
\par\includegraphics[width=8.7cm,clip]{13490fg3.eps}\vspace*{2.5mm}
\end{figure}](/articles/aa/full_html/2010/07/aa13490-09/img54.png)
|
Figure 3:
The upper panel shows the fit of three synthetic profiles
to the observed line (marked by open circles). Each profile was
convolved with different combinations of |
| Open with DEXTER | |
Table 2: Abundances of 22 elements in HD 49385 relative to the Sun.
2.3 Luminosity
Using the Hipparcos parallax of the star,
![]() mas
(van Leeuwen 2007), we could derive the absolute visual magnitude of the object
mas
(van Leeuwen 2007), we could derive the absolute visual magnitude of the object
![]() .
The bolometric correction was determined by interpolating in the grid
provided by Bessell et al. (1998) for appropriate values of temperature and
.
The bolometric correction was determined by interpolating in the grid
provided by Bessell et al. (1998) for appropriate values of temperature and ![]() for HD 49385. We obtained
for HD 49385. We obtained
![]() ,
which yields a luminosity
,
which yields a luminosity
![]() .
The values of
.
The values of
![]() and L provided an estimate of the radius
and L provided an estimate of the radius
![]() .
.
3 CoRoT observations
The star HD 49385 was one of the targets of the second Long Run in the asteroseismology field of the space mission CoRoT. 136.9 days of photometric data have been collected from October 2007 to March 2008, with a duty cycle of 88.2%. After being corrected from known instrumental effects as described in Samadi et al. (2007a), the lightcurve consists of a series of equally-spaced measurements (32 s) in the heliocentric frame (also known as N2 data). Small gaps remain in the lightcurve (a few minutes long) mainly due to the passage of the CoRoT satellite in the South Atlantic Anomaly (SAA). A larger gap (3.5 days) was caused by an unexpected reset of the DPU (Digital Processing Unit), which was probably the consequence of the impact of an energetic particle, because this event occured while the satellite was crossing the SAA. These gaps were linearly interpolated, based on the measurements collected 1000 s on either sides of the gap. A low-frequency trend due to the aging of the CCD was also corrected by removing a linear gain variation of -5.32 10 -5 day-1 (see Auvergne et al. 2009 for more details). The resulting lightcurve is shown in Fig. 4.
Figure 5 shows
the power spectrum of the lightcurve, computed with the Fast Fourier
Transform algorithm (FFT). It was normalized so that the integrated
power spectrum
from 0 to twice the Nyquist frequency corresponds to the variance of
the time series. At low frequency the background rises due to stellar
granulation and possibly
to stellar activity (see discussion in Sect. 4). The signature of perturbations due to the orbit of the satellite (
![]() Hz) and the day (
Hz) and the day (
![]() Hz)
remains in the power spectrum. These perturbations were expected (see Auvergne et al. 2009) and are of relatively low amplitudes (a few tens of ppm
Hz)
remains in the power spectrum. These perturbations were expected (see Auvergne et al. 2009) and are of relatively low amplitudes (a few tens of ppm![]() Hz
for the
strongest ones at low frequency). They appear as combinations of the
harmonics of both frequencies. For instance, a peak appears at 150.1
Hz
for the
strongest ones at low frequency). They appear as combinations of the
harmonics of both frequencies. For instance, a peak appears at 150.1 ![]() Hz (corresponding to
Hz (corresponding to
![]() ).
Finally, a broad excess of power, centered around 1 mHz, is clearly
seen in the power spectrum and corresponds to the acoustic modes of
HD 49385, which are studied in Sect. 5.
).
Finally, a broad excess of power, centered around 1 mHz, is clearly
seen in the power spectrum and corresponds to the acoustic modes of
HD 49385, which are studied in Sect. 5.
![\begin{figure}
\par\includegraphics[width=9cm,clip]{13490fg4.ps}\vspace*{3.2mm}
\end{figure}](/articles/aa/full_html/2010/07/aa13490-09/img82.png)
|
Figure 4: Lightcurve of 137 days of CoRoT observations on HD 49385, detrended using instrumental information. |
| Open with DEXTER | |
![\begin{figure}
\par\includegraphics[width=9cm,clip]{13490fg5.ps}\vspace*{3.2mm}
\end{figure}](/articles/aa/full_html/2010/07/aa13490-09/img85.png)
|
Figure 5:
Power spectrum of 137 days of CoRoT data for HD 49385. The peaks indicated by arrows are from left to right: the 14- |
| Open with DEXTER | |
4 Search for a signature of stellar rotation in the Fourier domain
The measurement of the rotation period from the lightcurve analysis was found to be useful in previous analyses of p-mode parameters (see Appourchaux et al. 2008; Barban et al. 2009; Mosser et al. 2009b). It indeed provides a direct measurement of the surface rotation period and hence a first estimate of the rotational splitting value.
Contrary to other solar-like pulsating CoRoT targets, no immediate signature of the activity can be seen in the lightcurve (see Fig. 4). Only a long period trend stands out. The same trend was also found in several stars observed on the same CCD during the same specific observation run. Its instrumental or environmental origin is thus established and is currently under study.
We first identified a peak around ![]() Hz (period of about 29 days), the significance of which is hard to assess
because it presents a relatively low amplitude in a frequency domain
where the intrumental noise can dominate the power spectrum.
We performed a time-frequency analysis with Morlet wavelets (as described in Mathur et al. 2010) which showed that this peak presents a certain stability in time. But because the periods we were
testing correspond to a non-negligible fraction of the total observation period, the cone of influence (Torrence & Compo 1998) prevented us from drawing any conclusion.
Hz (period of about 29 days), the significance of which is hard to assess
because it presents a relatively low amplitude in a frequency domain
where the intrumental noise can dominate the power spectrum.
We performed a time-frequency analysis with Morlet wavelets (as described in Mathur et al. 2010) which showed that this peak presents a certain stability in time. But because the periods we were
testing correspond to a non-negligible fraction of the total observation period, the cone of influence (Torrence & Compo 1998) prevented us from drawing any conclusion.
A prominent peak can also be detected at a frequency of ![]() Hz
(period of about 0.8 day) with a signal-to-noise ratio of more
than 10.
This peak is however unlikely to be directly related to rotation.
Indeed, let us assume ad absurdum that the rotation frequency is
Hz
(period of about 0.8 day) with a signal-to-noise ratio of more
than 10.
This peak is however unlikely to be directly related to rotation.
Indeed, let us assume ad absurdum that the rotation frequency is ![]() Hz.
Our estimate of the radius implies a surface velocity of more than 120 km s-1. To obtain the measured
Hz.
Our estimate of the radius implies a surface velocity of more than 120 km s-1. To obtain the measured ![]() ,
we would need a value of the inclination angle lower than
,
we would need a value of the inclination angle lower than ![]() ,
which means that the star is seen pole-on. In this case
it is extremely difficult to derive the signature of the activity from the light curve (Mosser et al. 2009a)
and no peak related to the rotation period can be
detected in the power spectrum, which contradicts our assumption.
In the power spectrum of HD 49933, which is a target of the
seismo-field for the same run, we also found a small peak around
,
which means that the star is seen pole-on. In this case
it is extremely difficult to derive the signature of the activity from the light curve (Mosser et al. 2009a)
and no peak related to the rotation period can be
detected in the power spectrum, which contradicts our assumption.
In the power spectrum of HD 49933, which is a target of the
seismo-field for the same run, we also found a small peak around ![]() Hz,
suggesting this peak might be instrumental. However, the frequencies do
not match exactly, and the peak observed for HD 49933 does not
appear to
be significant. The origin of this peak remains unclear. But it cannot
be related to rotation.
Hz,
suggesting this peak might be instrumental. However, the frequencies do
not match exactly, and the peak observed for HD 49933 does not
appear to
be significant. The origin of this peak remains unclear. But it cannot
be related to rotation.
In summary, we found no clear signature of the stellar rotation of HD 49385. The low-frequency part of the power spectrum can therefore not be used to obtain a first estimate of the rotational splitting. We may however infer from the absence of a clear activity signal either that the star has a low activity, which cannot be detected even with the CoRoT sensitivity, or that the inclination of the star is close to pole-on.
5 Analysis of p mode oscillations
Figure 6 shows the power spectrum smoothed with a 10-![]() Hz boxcar. The comb-like
structure of this excess of power is typical of p-mode oscillations. This section presents the analysis of these modes.
Hz boxcar. The comb-like
structure of this excess of power is typical of p-mode oscillations. This section presents the analysis of these modes.
![\begin{figure}
\par\includegraphics[width=9cm,clip]{13490fg6.ps}\vspace*{2.5mm}
\end{figure}](/articles/aa/full_html/2010/07/aa13490-09/img90.png)
|
Figure 6:
Smoothed power spectrum of HD 49385 (with a 10 |
| Open with DEXTER | |
5.1 Frequency of maximum power and large spacing
To estimate the frequency of the maximum of signal, we fitted a Gaussian profile on the raw power spectrum
in the frequency range of the oscillations and above a fitted background (fit described in Sect. 5.3).
The result is shown in Fig. 6. We obtained as the frequency of maximum power
![]() Hz.
Hz.
In Fig. 6 a comb-like structure is clearly visible between 600 and ![]() Hz.
The autocorrelation of the power spectrum provides a first estimate of the mean value of the large spacing
Hz.
The autocorrelation of the power spectrum provides a first estimate of the mean value of the large spacing
![]() Hz.
Hz.
5.2 Mode identification
We used the value of the large spacing given in the previous section to build the échelle diagram shown in Fig. 7.
It is obtained by piling onto one another sections of 56 ![]() Hz of the power spectrum.
Three clear ridges appear in the échelle diagram: two neighboring ones, referred to as ridges A and B in Fig. 7, and a third one (ridge C).
Hz of the power spectrum.
Three clear ridges appear in the échelle diagram: two neighboring ones, referred to as ridges A and B in Fig. 7, and a third one (ridge C).
![\begin{figure}
\par\includegraphics[width=9cm,clip]{13490fg7.ps}\vspace*{2mm}
\end{figure}](/articles/aa/full_html/2010/07/aa13490-09/img95.png)
|
Figure 7:
Échelle diagram of HD 49385 computed with a large spacing of
|
| Open with DEXTER | |
The pattern we observe in Fig. 7
is the one we expect to observe for low-degree high-radial-order modes
in solar-like pulsators: two main ridges separated by about half a
large
spacing corresponding to ![]() and
and ![]() modes, and alongside the
modes, and alongside the ![]() ridge a fainter one corresponding to
ridge a fainter one corresponding to ![]() modes.
It then seems reasonable to identify the ridges as follows: neighboring ridges A and B correspond to
modes.
It then seems reasonable to identify the ridges as follows: neighboring ridges A and B correspond to ![]() and
and ![]() modes, respectively, and ridge C
to
modes, respectively, and ridge C
to ![]() modes. We note that Mosser & Appourchaux (2009) and Bedding & Kjeldsen (2010)
obtained the same identification for the degrees of the ridges using
different approaches.
The following analysis is based on this identification. However, since
the previous analyses of CoRoT solar-like targets encountered
ambiguity indentifying the modes (see Barban et al. 2009, García et al. 2009), we decided to also consider the possibility of the alternate identification
(for which ridge C corresponds to
modes. We note that Mosser & Appourchaux (2009) and Bedding & Kjeldsen (2010)
obtained the same identification for the degrees of the ridges using
different approaches.
The following analysis is based on this identification. However, since
the previous analyses of CoRoT solar-like targets encountered
ambiguity indentifying the modes (see Barban et al. 2009, García et al. 2009), we decided to also consider the possibility of the alternate identification
(for which ridge C corresponds to ![]() modes), which is discussed in Sect. 5.3.4.
modes), which is discussed in Sect. 5.3.4.
![\begin{figure}
\par\includegraphics[width=9cm,clip]{13490fg8.ps}
\end{figure}](/articles/aa/full_html/2010/07/aa13490-09/img97.png)
|
Figure 8:
Échelle diagram of the peaks with a significance greater than 95% in the power spectrum smoothed over n=15 bins ( |
| Open with DEXTER | |
Figure 7 also shows fainter peaks outside the identified ridges. We here study their significance by testing the H0 hypothesis
in the frequency range of the oscillations.
Because we searched for short-lived modes, we binned the power spectrum over n bins, as prescribed in Appourchaux (2004). The size of the boxcar (n=15 bins ![]()
![]() Hz)
for the binning was chosen to approximately match the expected linewidth for the p modes in solar-like pulsators.
In this case, the noise is distributed as a
Hz)
for the binning was chosen to approximately match the expected linewidth for the p modes in solar-like pulsators.
In this case, the noise is distributed as a ![]() with 2n degrees of freedom.
We then applied the H0 hypothesis, i.e. we supposed that the observations are due to pure noise.
For each peak we computed the probability p that pure noise is able to reach the height of the peak over the whole studied window.
Low values of p indicate a poor compatibility between the observations and noise, and the significance of the peaks is defined as 1-p.
We show in Fig. 8 all the peaks with a significance higher than 95%.
with 2n degrees of freedom.
We then applied the H0 hypothesis, i.e. we supposed that the observations are due to pure noise.
For each peak we computed the probability p that pure noise is able to reach the height of the peak over the whole studied window.
Low values of p indicate a poor compatibility between the observations and noise, and the significance of the peaks is defined as 1-p.
We show in Fig. 8 all the peaks with a significance higher than 95%.
We notice four peaks which appear with a significance above 98%, and lie outside the identified ridges.
They are labeled as ![]() ,
,
![]() ,
,
![]() and
and ![]() on Fig. 8.
The peak
on Fig. 8.
The peak ![]() ,
clearly outside the pattern expected from asymptotic theory, could
correspond to a mixed mode, given that HD 49385 is an evolved
object.
The peak
,
clearly outside the pattern expected from asymptotic theory, could
correspond to a mixed mode, given that HD 49385 is an evolved
object.
The peak ![]() might be an
might be an ![]() mode, assuming that the curvature of ridge B changes at low frequency.
This hypothesis seems to be corroborated by the fact that such a change exists in ridge C.
However, a more precise inspection shows that including
mode, assuming that the curvature of ridge B changes at low frequency.
This hypothesis seems to be corroborated by the fact that such a change exists in ridge C.
However, a more precise inspection shows that including ![]() in ridge B generates an abrupt step in the
in ridge B generates an abrupt step in the ![]() large separation, whereas the
large separation, whereas the
![]() large separation varies quite smoothly. The peak
large separation varies quite smoothly. The peak ![]() could also be an
could also be an ![]() mixed mode in avoided crossing.
Indeed, at low frequency, the
mixed mode in avoided crossing.
Indeed, at low frequency, the ![]() and
and ![]() ridges have different curvatures. This can
be seen in Fig. 7 and will be confirmed by the large separation profiles derived from the fitted mode frequencies (see
Sect. 5.3.2). It was shown in Deheuvels & Michel (2009) that a low-degree
ridges have different curvatures. This can
be seen in Fig. 7 and will be confirmed by the large separation profiles derived from the fitted mode frequencies (see
Sect. 5.3.2). It was shown in Deheuvels & Michel (2009) that a low-degree ![]() avoided crossing creates a characteristic
distortion in the ridge of degree
avoided crossing creates a characteristic
distortion in the ridge of degree ![]() .
If we assume that
.
If we assume that ![]() is an
is an ![]() mixed mode in avoided crossing, the expected curvature of the
mixed mode in avoided crossing, the expected curvature of the ![]() ridge is very similar to that of the observed ridge. We cannot
establish this identification more firmly at this stage though. Because
of the uncertainty regarding the identification of the
ridge is very similar to that of the observed ridge. We cannot
establish this identification more firmly at this stage though. Because
of the uncertainty regarding the identification of the ![]() mode, we preferred to consider and fit it individually (see Sect. 5.3).
The peaks
mode, we preferred to consider and fit it individually (see Sect. 5.3).
The peaks ![]() and
and ![]() are located at about 7
are located at about 7 ![]() Hz on the left of ridge C.
We studied the possibility for these peaks to correspond to mixed modes.
In this case, they would have to be of different degree
Hz on the left of ridge C.
We studied the possibility for these peaks to correspond to mixed modes.
In this case, they would have to be of different degree ![]() .
Indeed, g modes of same degree and
increasing radial order have frequencies increasingly close to each other. Two mixed
modes of same degree
.
Indeed, g modes of same degree and
increasing radial order have frequencies increasingly close to each other. Two mixed
modes of same degree ![]() spaced by
spaced by ![]() would imply many more mixed modes in the
ridge of degree
would imply many more mixed modes in the
ridge of degree ![]() at lower frequency. It is clear from ridges
at lower frequency. It is clear from ridges ![]() and
and ![]() that this is not
the case. And if
that this is not
the case. And if ![]() and
and ![]() were mixed modes of different degree,
we would expect them to have different amplitudes, which does not seem to be the case.
Their position in the échelle diagram on the left of ridge C suggests that they could also be
were mixed modes of different degree,
we would expect them to have different amplitudes, which does not seem to be the case.
Their position in the échelle diagram on the left of ridge C suggests that they could also be ![]() modes.
Several reasons led us to favor this identification. First, these two modes appear vertically aligned in the échelle diagram
and around the maximum of the oscillations,
i.e. at the place where it is most likely to observe
modes.
Several reasons led us to favor this identification. First, these two modes appear vertically aligned in the échelle diagram
and around the maximum of the oscillations,
i.e. at the place where it is most likely to observe ![]() modes if they are present.
Then,
modes if they are present.
Then, ![]() and
and ![]() might be part of a fainter ridge (referred to as ridge D), because
other peaks, which have a lower significance but seem to follow the
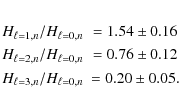
alignment, appear in Fig. 7. Finally, the distance between ridges C and D is also consistent
with this identification. Indeed, the asymptotic theory gives an expression for the average distance between the ridges
might be part of a fainter ridge (referred to as ridge D), because
other peaks, which have a lower significance but seem to follow the
alignment, appear in Fig. 7. Finally, the distance between ridges C and D is also consistent
with this identification. Indeed, the asymptotic theory gives an expression for the average distance between the ridges
| (1) |
where the expression of D0 is found in Christensen-Dalsgaard (2003). By definition, the quantity
The significance is an efficient tool to select peaks, but
it is not a guarantee for the detection of a signal, as stressed in Appourchaux et al. (2009). To confirm the existence of a signal, one needs to
compute the posterior probability
P(H0|X=x). The details of the calculation along with the
assumptions we make are given in Appendix B.
For ![]() and
and ![]() ,
assumed to be mixed modes, we found
posterior probabilities of 0.001% and 8.7%, respectively. These peaks are therefore probably due to signal.
The larger posterior probability found for
,
assumed to be mixed modes, we found
posterior probabilities of 0.001% and 8.7%, respectively. These peaks are therefore probably due to signal.
The larger posterior probability found for ![]() is caused by the fact that the expected profile of mixed modes was built with very conservative priors .
For
is caused by the fact that the expected profile of mixed modes was built with very conservative priors .
For ![]() and
and ![]() ,
assumed to correspond to
,
assumed to correspond to ![]() modes, we obtained a very low posterior probability (1.4% and 1.1%,
respectively), indicating that these peaks are highly likely due to
signal, and a good compatibility
between their observed profiles and the expected profile of
modes, we obtained a very low posterior probability (1.4% and 1.1%,
respectively), indicating that these peaks are highly likely due to
signal, and a good compatibility
between their observed profiles and the expected profile of ![]() modes for HD 49385. This confirms our identification for
modes for HD 49385. This confirms our identification for ![]() and
and ![]() .
It is the first time that
.
It is the first time that ![]() modes can be detected in a solar-like pulsator (other than the Sun). We explain in Sect. 5.3.2 why HD 49385 was a particularly favorable target to detect
modes can be detected in a solar-like pulsator (other than the Sun). We explain in Sect. 5.3.2 why HD 49385 was a particularly favorable target to detect ![]() modes.
modes.
We remark that ridge D could also be seen as the m=+1 component of the rotationally
splitted ![]() mode. This hypothesis is studied in Sect. 5.3.4.
mode. This hypothesis is studied in Sect. 5.3.4.
5.3 Extraction of p mode parameters
5.3.1 Method
Solar-like oscillations are the result of stochastic excitations of p
modes in the convective envelope. They respond to the equation of a
forced, damped and randomly excitated harmonic oscillator (see Duvall & Harvey 1986).
Therefore their signature in the power spectrum can be modeled as
Lorentzian profiles with a linewidth proportional to the inverse of the
mode lifetimes,
added to the background and perturbated by a multiplicative noise
following a ![]() distribution with two degrees of freedom. We used a maximum
likelihood estimation (MLE) to determine the most probable parameters of the observed p modes (see Anderson et al. 1990). This method was already
applied to determine p-mode parameters for the Sun (Toutain & Froehlich 1992; Appourchaux et al. 1998) as well as for CoRoT solar-like targets
(Appourchaux et al. 2008; Barban et al. 2009; García et al. 2009).
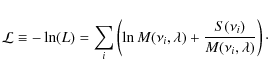
As described in Anderson et al. (1990), the likelihood L is defined as the product of the probability density of each frequency bin
distribution with two degrees of freedom. We used a maximum
likelihood estimation (MLE) to determine the most probable parameters of the observed p modes (see Anderson et al. 1990). This method was already
applied to determine p-mode parameters for the Sun (Toutain & Froehlich 1992; Appourchaux et al. 1998) as well as for CoRoT solar-like targets
(Appourchaux et al. 2008; Barban et al. 2009; García et al. 2009).
As described in Anderson et al. (1990), the likelihood L is defined as the product of the probability density of each frequency bin ![]() of the power spectrum
of the power spectrum
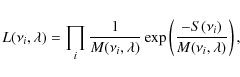
|
(2) |
where S is the observed power spectrum, M the model described above, and
|
(3) |
As mentioned above, perturbations remain in the power spectrum at frequencies corresponding to combinations of the harmonics of the orbital frequency and those of the day. Some of these perturbations can be seen in the frequency domain of the oscillations. We therefore gave a null weight to the corresponding bins so that our estimates of the p-mode parameters are not influenced by those peaks.
We estimated the background with a power law to describe the granulation component, as prescribed by Harvey (1985). Prior to the fit of the p-mode parameters,
we fitted a profile of the type
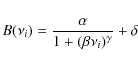
|
(4) |
on the power spectrum, excluding the frequency domain of the p-mode oscillations to avoid any bias, with
The analysis of HD 49933, which was the first solar-like CoRoT
target, showed that a global fit of all the modes gave more robust
estimates of the mode parameters
(see Appourchaux et al. 2008). We therefore fitted modes simultaneously on a frequency range corresponding to nine overtones in the power spectrum.
The assumptions made for the fit are the same as in Appourchaux et al. (2008). We briefly recall them here.
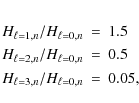
The splitting was assumed to be constant over the frequency range of the oscillations, and the ![]() components of non-radial modes were supposed to be symmetrical
with respect to the m=0 component.
We sliced the power spectrum in
components of non-radial modes were supposed to be symmetrical
with respect to the m=0 component.
We sliced the power spectrum in ![]() -wide intervals, in which the linewidth is assumed to be the same for all modes, and where only the height of the
-wide intervals, in which the linewidth is assumed to be the same for all modes, and where only the height of the ![]() mode (
mode (
![]() )
is fitted. The heights of non-radial modes are determined from those of the
)
is fitted. The heights of non-radial modes are determined from those of the ![]() mode. Assuming an equal repartition of the energy in the modes of different degrees
mode. Assuming an equal repartition of the energy in the modes of different degrees ![]() ,
and taking
the value of the limb darkening for this star into account, we obtain
,
and taking
the value of the limb darkening for this star into account, we obtain
where
5.3.2 Mode parameters estimates
Five teams worked independently on the extraction of the p-mode parameters and applied the method we described in Sect. 5.3.1 to fit the four ridges
associated to
![]() modes. As was done in previous analyses of this type, we present in the following section
one set of reference results, and we use results from the other teams to cross-check them and comment the robustness of the
solution. The reference results of the fit are given in Tables 3 and 4.
modes. As was done in previous analyses of this type, we present in the following section
one set of reference results, and we use results from the other teams to cross-check them and comment the robustness of the
solution. The reference results of the fit are given in Tables 3 and 4.
Table 3: Reference results for the parameters of the radial p modes.
![\begin{figure}
\par\includegraphics[width=9cm,clip]{13490fg9.ps}\vspace*{2.5mm}
\end{figure}](/articles/aa/full_html/2010/07/aa13490-09/img162.png)
|
Figure 9:
Large separation profiles derived from the fitted frequencies of the |
| Open with DEXTER | |
Mode frequencies
There is a very good agreement between the different teams on the fitted mode eigenfrequencies. Only two frequencies in theAt
![]() Hz, the
Hz, the ![]() mode is found merged together with the
mode is found merged together with the ![]() mode. This could be because the signal-to-noise ratio decreases
when reaching the edges of the fitted domain. Indeed, with a lower
signal-to-noise ratio, the analysis of previous CoRoT targets yielded
several
mode. This could be because the signal-to-noise ratio decreases
when reaching the edges of the fitted domain. Indeed, with a lower
signal-to-noise ratio, the analysis of previous CoRoT targets yielded
several ![]() modes merged with
the neighboring
modes merged with
the neighboring ![]() mode (see Appourchaux et al. 2008; Barban et al. 2009). However, the
mode (see Appourchaux et al. 2008; Barban et al. 2009). However, the ![]() mode might also have been shifted because of
an
mode might also have been shifted because of
an ![]() mixed mode in the neighborhood.
mixed mode in the neighborhood.
Figure 9 shows the large separation profiles derived from the fitted frequencies of the ![]() and
and ![]() modes.
It appears, as mentioned in Sect. 5.2, that the
modes.
It appears, as mentioned in Sect. 5.2, that the ![]() and
and ![]() ridges have a different curvature at low frequency,
which might be caused by a low-frequency avoided crossing.
ridges have a different curvature at low frequency,
which might be caused by a low-frequency avoided crossing.
![\begin{figure}
\par\includegraphics[width=9cm,clip]{13490fg10.ps}\vspace*{1mm}
\end{figure}](/articles/aa/full_html/2010/07/aa13490-09/img165.png)
|
Figure 10:
Échelle diagram of the fitted modes. The colors correspond to the following degrees: blue |
| Open with DEXTER | |
Mode linewidths
Figure 11 shows the
linewidths of the fitted modes. As was observed in the Sun, the
linewidths of the modes increase with frequency and are almost constant
around the maximum
of the signal. They are larger than those of the Sun by a factor 2. The
lifetimes ![]() of the modes can be deduced from the linewidth by the relation
of the modes can be deduced from the linewidth by the relation
![]() .
For HD 49385 they range from about one day to two days. By
comparison the mode lifetimes are shorter in other CoRoT solar-like
pulsators,
e.g. for HD 181420 (about six hours for the shortest ones, and 12
hours around the maximum of the signal).
.
For HD 49385 they range from about one day to two days. By
comparison the mode lifetimes are shorter in other CoRoT solar-like
pulsators,
e.g. for HD 181420 (about six hours for the shortest ones, and 12
hours around the maximum of the signal).
It appears that one of the fitted intervals (
![]() Hz for the
Hz for the ![]() mode) has a linewidth somewhat larger than what could be expected considering
the linewidths of neighboring orders (see Fig. 11). Indeed, the
mode) has a linewidth somewhat larger than what could be expected considering
the linewidths of neighboring orders (see Fig. 11). Indeed, the ![]() mode of this interval (
mode of this interval (
![]() Hz) is larger than the other modes in the neighborhood.
Hz) is larger than the other modes in the neighborhood.
![\begin{figure}
\par\includegraphics[width=9cm,clip]{13490fg11.ps}\vspace*{2mm}
\end{figure}](/articles/aa/full_html/2010/07/aa13490-09/img169.png)
|
Figure 11:
Linewidths of the fitted modes with 1- |
| Open with DEXTER | |
Mode heights and amplitudes
As was mentioned before, we fixed the ratios of heights beween modes of different degrees ![]() in our fit. Because HD 49385 is the first CoRoT target for which the
in our fit. Because HD 49385 is the first CoRoT target for which the ![]() and
and ![]() ridges
are clearly distinct in the échelle diagram, we had the opportunity to
check the chosen height ratios, which are those usually adopted in this
type of analysis. We performed a new fit releasing the height ratios
and found
ridges
are clearly distinct in the échelle diagram, we had the opportunity to
check the chosen height ratios, which are those usually adopted in this
type of analysis. We performed a new fit releasing the height ratios
and found
For
From the heights and linewidths of the modes we derived the amplitudes (in ppm), given by
![]() .
To estimate the error bars on this quantity,
we took into account the anticorrelation which exists between the
determination of the height and the linewidth. The mode amplitudes are
represented for
.
To estimate the error bars on this quantity,
we took into account the anticorrelation which exists between the
determination of the height and the linewidth. The mode amplitudes are
represented for ![]() modes as a function
of frequency in Fig. 12.
They range from 3.6 ppm to 5.4 ppm. However, these estimates correspond
to instrumental values. Taking into account the instrumental response
functions of CoRoT (as described in Michel et al. 2009), they can be converted into intrinsic bolometric amplitudes per radial mode by multiplying them by a factor 1.032.
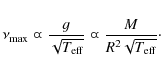
The obtained amplitudes are consistent with the prediction of the maximum amplitudes using scaling laws (
modes as a function
of frequency in Fig. 12.
They range from 3.6 ppm to 5.4 ppm. However, these estimates correspond
to instrumental values. Taking into account the instrumental response
functions of CoRoT (as described in Michel et al. 2009), they can be converted into intrinsic bolometric amplitudes per radial mode by multiplying them by a factor 1.032.
The obtained amplitudes are consistent with the prediction of the maximum amplitudes using scaling laws (
![]() ,
see Appendix A).
The star HD 49385 is then quite specific among the other
solar-like pulsators observed with CoRoT for which amplitudes were
found significantly lower than the predicted ones
(see Appourchaux et al. 2008; Barban et al. 2009; García et al. 2009; Michel et al. 2008).
,
see Appendix A).
The star HD 49385 is then quite specific among the other
solar-like pulsators observed with CoRoT for which amplitudes were
found significantly lower than the predicted ones
(see Appourchaux et al. 2008; Barban et al. 2009; García et al. 2009; Michel et al. 2008).
The signal-to-noise (SNR) ratio of each mode computed from the fitted height and the background estimated in Sect. 5.3.1 is given in Table 3.
The SNR is found to be very small for the fitted ![]() modes (about 0.25 at the maximum of the signal). However, when releasing the height ratios, we find
modes (about 0.25 at the maximum of the signal). However, when releasing the height ratios, we find
![]() .
The SNR of the
.
The SNR of the ![]() modes should be closer to 1 at the maximum of the signal.
modes should be closer to 1 at the maximum of the signal.
![\begin{figure}
\par\includegraphics[width=9cm,clip]{13490fg12.ps}\vspace*{2mm}
\end{figure}](/articles/aa/full_html/2010/07/aa13490-09/img174.png)
|
Figure 12:
Amplitudes of the fitted modes with 1- |
| Open with DEXTER | |
Table 4: Reference results for the parameters of the non-radial p modes (symbols are the same as in Table 3).
Splitting and inclination angle estimates
Most of the fits we performed converge toward a null value of the splitting and consequently an undefined value of the inclination angle. This can correspond to two different cases:- The star could be seen almost pole-on, i.e. with an inclination angle close to
 .
In that case the
.
In that case the  components of the non-radial
modes are not visible, and we therefore cannot estimate the splitting. However, the measured
components of the non-radial
modes are not visible, and we therefore cannot estimate the splitting. However, the measured  of the object and the estimate of the stellar radius R allow us to give constraints
on the splitting
of the object and the estimate of the stellar radius R allow us to give constraints
on the splitting
 through the relation
For a low inclination angle we expect higher values of the rotational splitting (e.g. Hz for i lower than
 ).
).
- We could also explain this result by a low value of the splitting compared to the linewidth of the modes, so that the fits are unable to separate the components of the non-radial modes. Equation 5 shows that a small rotational splitting corresponds to a high inclination angle.
In both cases, the effect of the rotational splitting on the observed mode profiles is weak.
Indeed, either the angle is small, and the ![]() components of the multiplets have very small amplitudes compared
to the m=0 component, or the splitting is small, and the m components are mixed together. We note that this favors the detection of lower degree modes and therefore justifies
why
components of the multiplets have very small amplitudes compared
to the m=0 component, or the splitting is small, and the m components are mixed together. We note that this favors the detection of lower degree modes and therefore justifies
why ![]() modes seem to be detected in HD 49385, while they were not in previously analyzed CoRoT targets.
modes seem to be detected in HD 49385, while they were not in previously analyzed CoRoT targets.
5.3.3 Possible mixed modes parameter estimates
The position of HD 49385 in the HR diagram suggests that it either reaches the end of the main sequence or lies shortly after it. The star HD 49385 is therefore evolved and its acoustic spectrum may contain mixed modes, i.e. modes which have a g-mode behavior in the deep interior and a p-mode behavior below the surface (see Scuflaire 1974). The mixed modes are known to experience the so-called avoided crossing phenomenon, during which their frequency does not follow the asymptotic approximation and they can be located out of the ridges (Unno et al. 1989). It was already noticed (e.g. Dziembowski & Pamyatnykh 1991) that the detection of these modes could yield a very valuable constraint on the size of the convective core.
As was noticed in Sect. 5.1, two peaks are detected in the power spectrum with a confidence level above 95% and are not located
within any of the observed ridges in the échelle diagram (namely ![]() and
and ![]() ).
They could be the signature of mixed modes. We note that if the peak
).
They could be the signature of mixed modes. We note that if the peak ![]() ,
found at
,
found at
![]() Hz is an
Hz is an ![]() mixed
mode in avoided crossing, it could explain why the
mixed
mode in avoided crossing, it could explain why the ![]() p mode at
p mode at
![]() Hz seems not to follow the curvature of the
Hz seems not to follow the curvature of the ![]() ridge.
We fitted these peaks as Lorentzian profiles with free frequencies,
heights and linewidths. Because the mixed modes have a g-mode character
near the center,
their inertia is larger, and we expect them to have a longer lifetime
and therefore a smaller linewidth than regular modes.
We obtained the results given in Table 5. We notice that the fitted frequencies have small error bars, but the other parameters are ill-determined.
ridge.
We fitted these peaks as Lorentzian profiles with free frequencies,
heights and linewidths. Because the mixed modes have a g-mode character
near the center,
their inertia is larger, and we expect them to have a longer lifetime
and therefore a smaller linewidth than regular modes.
We obtained the results given in Table 5. We notice that the fitted frequencies have small error bars, but the other parameters are ill-determined.
Table 5: Results of a Lorentzian fit performed on the peaks identified as potential mixed modes.
5.3.4 Other mode identification scenarii
Table 6: Reference results for the parameters of the radial p modes for the alternate identification (symbols are the same as in Table 3).
![\begin{figure}
\par\includegraphics[width=9cm,clip]{13490fg13.ps}\vspace*{2mm}
\end{figure}](/articles/aa/full_html/2010/07/aa13490-09/img260.png)
|
Figure 13:
Frequency shift
|
| Open with DEXTER | |
Can ridge D be the m=+1 component of the  modes?
Still considering the identification preferred in this paper (i.e. ridge C corresponding to However, we ran models representative of HD 49385 and found that with this rotation frequency the ![]() components of
non-radial multiplets are no longer symmetric with respect to the m=0 component.
To treat this case correctly, we therefore need to take this asymmetry into account in our fits.
components of
non-radial multiplets are no longer symmetric with respect to the m=0 component.
To treat this case correctly, we therefore need to take this asymmetry into account in our fits.
For this purpose, we studied this asymmetry on evolutionary models reproducing
the
![]() and L that we obtained for HD 49385 in Sect. 2.1 and with different angular velocities.
The models were computed with the evolutionary code CESAM2k (Morel 1997)
and the eigenfrequencies were derived from them with the oscillation code FILOU (Suárez & Goupil 2008).
They showed that the effects of asymmetry should be non-negligible even for values of the splitting as low as a few
and L that we obtained for HD 49385 in Sect. 2.1 and with different angular velocities.
The models were computed with the evolutionary code CESAM2k (Morel 1997)
and the eigenfrequencies were derived from them with the oscillation code FILOU (Suárez & Goupil 2008).
They showed that the effects of asymmetry should be non-negligible even for values of the splitting as low as a few ![]() Hz.
We describe the asymmetry of the
Hz.
We describe the asymmetry of the ![]() components of a mode of degree
components of a mode of degree ![]() and order n by the shift
and order n by the shift
![]() defined as
defined as
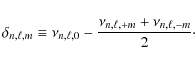
These shifts are represented in Fig. 13 for a model representative of HD 49385 for eigenmodes in the frequency range of the detected oscillations (
| (7) |
where n0 corresponds to the order where the signal is maximal (n0=17). For
| (8) |
This adds two free parameters to the fit per fitted
The obtained results for the eigenfrequencies, heights, linewidths and amplitudes of modes of degrees
![]() all lie within the 1-
all lie within the 1-![]() error bars of those
given in Table 3. The fit converges toward a splitting of
error bars of those
given in Table 3. The fit converges toward a splitting of
![]() Hz and an angle of
Hz and an angle of
![]() .
As expected, ridge D is fitted as the m=+1 component of the
.
As expected, ridge D is fitted as the m=+1 component of the ![]() modes.
The obtained rotational shift is such that
modes.
The obtained rotational shift is such that
![]() Hz per order n, and
Hz per order n, and
![]() Hz.
However, using Eq. (5) and the fitted values of the splitting and the angle, we obtain
Hz.
However, using Eq. (5) and the fitted values of the splitting and the angle, we obtain
![]() km s-1.
This result is not compatible with the firm upper limit of 5 km s-1 established for
km s-1.
This result is not compatible with the firm upper limit of 5 km s-1 established for ![]() in the spectroscopic analysis (see Sect. 2.2).
in the spectroscopic analysis (see Sect. 2.2).
Can ridge C correspond to  modes?
As was said in Sect. 5.1,
for the sake of completeness and in the light of previous analyses of
p-mode oscillations in solar-like pulsators, we decided to also
investigate the
alternate identification. In this case, ridges C and D correspond to We fitted the modes exactly the same way it was done before. The results are given in Tables 6 and 7, and an échelle diagram of the fitted
modes is shown in Fig. 14.
The linewidths, heights and amplitudes are very comparable with those
obtained in the first identification. We obtain a splitting of
![]() Hz and an angle of
Hz and an angle of
![]() ,
which is consistent with the idea that ridges A and B are indeed identified as
,
which is consistent with the idea that ridges A and B are indeed identified as
![]() modes because they
are separated by about twice the fitted splitting. Using Eq. (5) as before, these fitted values of the splitting and angle give an estimate of
modes because they
are separated by about twice the fitted splitting. Using Eq. (5) as before, these fitted values of the splitting and angle give an estimate of
![]() km s-1, in complete
disagreement with the measured
km s-1, in complete
disagreement with the measured
![]() km s-1.
km s-1.
The alternate identifications we considered lead to major disagreements with the measured ![]() and were therefore rejected. This confirms the identification
we adopted in Sect. 5.2 to perform the global fit of the p-mode parameters.
and were therefore rejected. This confirms the identification
we adopted in Sect. 5.2 to perform the global fit of the p-mode parameters.
![\begin{figure}
\par\includegraphics[width=9cm,clip]{13490fg14.ps}\vspace*{3.7mm}
\end{figure}](/articles/aa/full_html/2010/07/aa13490-09/img277.png)
|
Figure 14: Échelle diagram for the fitted modes of the alternate identification. Same symbols as in Fig. 10. |
| Open with DEXTER | |
Table 7: Reference results for the parameters of the non-radial p modes for the alternate identification (symbols are the same as in Table 3).
6 Conclusion
The star HD 49385 was characterized from both CoRoT seismic observations and NARVAL spectroscopic data. The atmospheric parameters of the star were derived and the 137-day-long photometric time series was analyzed.A clear series of peaks associated to p modes was detected in the
power spectrum around 1 mHz.
Up to now, the CoRoT solar-like pulsators presented some ambiguities in
the identification of ridges corresponding to different degrees ![]() .
Here three very clear ridges appear in the échelle diagram, which were readily identified as
.
Here three very clear ridges appear in the échelle diagram, which were readily identified as ![]() ,
1 and 2 modes. The
,
1 and 2 modes. The ![]() ridge appears clearly distinct from the
ridge appears clearly distinct from the ![]() ridge in the échelle diagram.
Furthermore, two peaks, part of a fainter ridge, were found to be significant and compatible with the
characteristics we expect for
ridge in the échelle diagram.
Furthermore, two peaks, part of a fainter ridge, were found to be significant and compatible with the
characteristics we expect for ![]() modes in HD 49385. This probably constitutes the first photometric detection of
modes in HD 49385. This probably constitutes the first photometric detection of ![]() modes in a
solar-like pulsating star (other than the Sun).
modes in a
solar-like pulsating star (other than the Sun).
We performed a global fit over nine radial orders with degrees ranging from ![]() to
to ![]() modes (simultaneous
fit of 36 individual modes). We obtained precise estimates of the mode frequencies (uncertainty of about
modes (simultaneous
fit of 36 individual modes). We obtained precise estimates of the mode frequencies (uncertainty of about ![]() Hz for radial modes at the maximum of the signal).
The obtained value of the maximum amplitude for
Hz for radial modes at the maximum of the signal).
The obtained value of the maximum amplitude for ![]() modes (
modes (![]() ppm) is consistent
with the estimate deduced from Samadi et al. (2007b), unlike the other CoRoT solar-like pulsators (e.g. Appourchaux et al. 2008).
ppm) is consistent
with the estimate deduced from Samadi et al. (2007b), unlike the other CoRoT solar-like pulsators (e.g. Appourchaux et al. 2008).
We found no evidence of a rotational splitting of the modes. This can
be explained either by a small inclination angle or by a low rotational
velocity
(inducing a small rotational splitting compared to the linewidth of the
modes).
In passing we stress that even for very slow rotators (rotational
splitting as low as a few ![]() Hz) the
Hz) the ![]() components of non-radial multiplets
are not expected to be symmetrical with respect to the m=0 component. We proposed a simple way of treating this assymetry in future analyses of solar-like pulsators.
components of non-radial multiplets
are not expected to be symmetrical with respect to the m=0 component. We proposed a simple way of treating this assymetry in future analyses of solar-like pulsators.
The p modes of HD 49385 were found to have lifetimes ranging from
about one day to two days, i.e. somewhat shorter than the mode
lifetimes in the Sun, but significantly larger than those
of the previously observed CoRoT solar-like targets. This explains why
the spectrum of HD 49385 is much clearer than for previous CoRoT
pulsators, for which the large mode linewidths
made it harder to separate the ![]() ridge from the
ridge from the ![]() ridge. The results obtained for HD 49385 confirm that the linewidths of the modes in G-type pulsators are
smaller than those of F-type pulsators, making their analysis easier.
ridge. The results obtained for HD 49385 confirm that the linewidths of the modes in G-type pulsators are
smaller than those of F-type pulsators, making their analysis easier.
The very high quality of the spectrum also enabled us to detect significant peaks outside the identified ridges. These
peaks were found to be compatible with mixed modes, whose presence can be expected in the spectrum of evolved objects
such as HD 49385.
The existence of mixed modes in avoided crossing can explain some specific behaviors we observe in the low-frequency
eigenmodes. In particular we found that the ![]() ridge is distorted compared to the
ridge is distorted compared to the ![]() ridge at low frequency.
Deheuvels & Michel (2009) showed that this type of distortion could be associated with
a low-degree mixed mode in avoided crossing. The identification of the
mode
ridge at low frequency.
Deheuvels & Michel (2009) showed that this type of distortion could be associated with
a low-degree mixed mode in avoided crossing. The identification of the
mode ![]() as an
as an ![]() mixed mode would be consistent with the observed pattern.
Other features like the
mixed mode would be consistent with the observed pattern.
Other features like the ![]() mode
found to overlap the
mode
found to overlap the ![]() mode (around 855
mode (around 855 ![]() Hz) might also result from avoided crossing phenomena.
This needs to be further investigated in the seismic interpretation of this star.
Hz) might also result from avoided crossing phenomena.
This needs to be further investigated in the seismic interpretation of this star.
This work was supported by the Centre National d'Etudes Spatiales (CNES). We thank M.-A. Dupret for providing estimates of the mode linewidths for HD 49385, computed with the non-adiabatic pulstion code MAD. I.W. Roxburgh and G. Verner thank the UK Science and Technology Facilities Council for support under grant PP/E001793/1
Appendix A: Estimate of the expected amplitudes for the oscillations in HD 49385
Scaling laws give an estimate of the amplitude of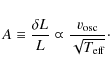
We assume that the frequency at the maximum of the signal
Samadi et al. (2007b) obtained
Inserting Eqs. (A.2) and (A.3) into Eq. (A.1) we obtain
|
(A.4) |
With the spectroscopic measure of the temperature
Appendix B: Computation of the posterior probability
By applying the Bayes theorem and assuming an equiprobability of H0 and H1, Appourchaux et al. (2009) obtained the following expression for the posterior probability
of the H0 hypothesis given the observed data:
The expression of P(x|H0) for a spectrum binned over n bins is given in Appourchaux (2004)
where
Among the four studied peaks, two are assumed to be ![]() modes around the maximum of the signal (
modes around the maximum of the signal (![]() and
and ![]() ).
To obtain an expression for P(x|H1), we need an estimate of the expected height and linewidth of
).
To obtain an expression for P(x|H1), we need an estimate of the expected height and linewidth of ![]() modes.
modes.
An estimate of the expected mode linewidths of HD 49385 was
computed with the non-adiabatic pulsation code MAD combined with a 1D
model reproducing
the effective temperature, the luminosity and the ![]() of the object in the same way as done in Appourchaux et al. (2009).
We obtain around the maximum of the signal a linewidth between
1
of the object in the same way as done in Appourchaux et al. (2009).
We obtain around the maximum of the signal a linewidth between
1 ![]() Hz and 2.5
Hz and 2.5 ![]() Hz. We adopt a uniform prior for the linewidth, taking into account an uncertainty factor in the theoretical model:
we assume that the maximum linewidth is twice as large as that given from the models (
Hz. We adopt a uniform prior for the linewidth, taking into account an uncertainty factor in the theoretical model:
we assume that the maximum linewidth is twice as large as that given from the models (
![]() [0,5]
[0,5] ![]() Hz).
Hz).
The height of the ![]() modes can be deduced from the amplitude of
modes can be deduced from the amplitude of ![]() modes through the relation
modes through the relation
|
(B.3) |
for an angle of inclination i. The visibility factors
Based on Appourchaux et al. (2009) we obtain the following expression for the probability of the observed data given the signal
where
Inserting Eqs. (B.2) and (B.4) into Eq. (B.1), we obtain for ![]() and
and ![]() a posterior probability of 1.4% and 1.1%, respectively.
a posterior probability of 1.4% and 1.1%, respectively.
Two peaks are assumed to be the signature of mixed modes (![]() and
and ![]() ). For this type of modes, a part of the energy is located in the g-mode cavity and the inertia is larger.
We therefore expect a smaller linewidth for these modes. But we can have no clue of their degree
). For this type of modes, a part of the energy is located in the g-mode cavity and the inertia is larger.
We therefore expect a smaller linewidth for these modes. But we can have no clue of their degree ![]() .
Because both their amplitudes and their linewidths greatly depend on
.
Because both their amplitudes and their linewidths greatly depend on ![]() ,
we use very conservative priors: uniform priors on the amplitude of the mode
(
,
we use very conservative priors: uniform priors on the amplitude of the mode
(![]() [
[
![]() ]
ppm) and on the linewidth (
]
ppm) and on the linewidth (
![]() [0,5]
[0,5] ![]() Hz).
Hz).
We obtain posterior probabilities of 0.001% and 8.7% for ![]() and
and ![]() ,
respectively.
,
respectively.
References
- Anderson, E. R., Duvall, Jr., T. L., & Jefferies, S. M. 1990, ApJ, 364, 699 [NASA ADS] [CrossRef] [Google Scholar]
- Appourchaux, T. 2004, A&A, 428, 1039 [NASA ADS] [CrossRef] [EDP Sciences] [Google Scholar]
- Appourchaux, T., Gizon, L., & Rabello-Soares, M.-C. 1998, A&AS, 132, 107 [NASA ADS] [CrossRef] [EDP Sciences] [Google Scholar]
- Appourchaux, T., Michel, E., Auvergne, M., et al. 2008, A&A, 488, 705 [NASA ADS] [CrossRef] [EDP Sciences] [Google Scholar]
- Appourchaux, T., Samadi, R., & Dupret, M. A. 2009, A&A, 506, 1 [NASA ADS] [CrossRef] [EDP Sciences] [Google Scholar]
- Asplund, M. 2005, ARA&A, 43, 481 [NASA ADS] [CrossRef] [Google Scholar]
- Auvergne, M., Bodin, P., Boisnard, L., et al. 2009, A&A, 506, 411 [NASA ADS] [CrossRef] [EDP Sciences] [Google Scholar]
- Baglin, A., Auvergne, M., Barge, P., et al. 2006, in ESA SP 1306, ed. M. Fridlund, A. Baglin, J. Lochard, & L. Conroy, 33 [Google Scholar]
- Ballot, J., García, R. A., & Lambert, P. 2006, MNRAS, 369, 1281 [NASA ADS] [CrossRef] [Google Scholar]
- Barban, C., Deheuvels, S., Baudin, F., et al. 2009, A&A, 506, 51 [NASA ADS] [CrossRef] [EDP Sciences] [Google Scholar]
- Basu, S., Christensen-Dalsgaard, J., Howe, R. et al. 2003, ApJ, 591, 432 [NASA ADS] [CrossRef] [Google Scholar]
- Bedding, T. R., & Kjeldsen, H. 2010, Commun. Asteroseismol., 161, 3 [NASA ADS] [CrossRef] [Google Scholar]
- Bessell, M. S., Castelli, F., & Plez, B. 1998, A&A, 333, 231 [NASA ADS] [Google Scholar]
- Boesgaard, A. M., Stephens, A., & Deliyannis, C. P. 2005, ApJ, 633, 398 [NASA ADS] [CrossRef] [Google Scholar]
- Bruntt, H. 2009, A&A, 506, 235 [NASA ADS] [CrossRef] [EDP Sciences] [Google Scholar]
- Bruntt, H., De Cat, P., & Aerts, C. 2008, A&A, 478, 487 [NASA ADS] [CrossRef] [EDP Sciences] [Google Scholar]
- Christensen-Dalsgaard, J. 2003, Lect. Not. Stellar Oscillat. [Google Scholar]
- Christensen-Dalsgaard, J., Gough, D. O., & Thompson, M. J. 1991, ApJ, 378, 413 [NASA ADS] [CrossRef] [Google Scholar]
- Deheuvels, S., & Michel, E. 2009, Ap&SS, 241 [Google Scholar]
- Duvall, Jr., T. L., & Harvey, J. W. 1986, in NATO ASIC Proc. 169: Seismology of the Sun and the Distant Stars, ed. D. O. Gough, 105 [Google Scholar]
- Dziembowski, W. A., & Pamyatnykh, A. A. 1991, A&A, 248, L11 [NASA ADS] [Google Scholar]
- García, R. A., Régulo, C., Samadi, R., et al. 2009, A&A, 506, 41 [NASA ADS] [CrossRef] [EDP Sciences] [Google Scholar]
- Ghezzi, L., Cunha, K., Smith, V. V., et al. 2009, ApJ, 698, 451 [NASA ADS] [CrossRef] [Google Scholar]
- Gizon, L., & Solanki, S. K. 2003, ApJ, 589, 1009 [NASA ADS] [CrossRef] [Google Scholar]
- Harvey, J. 1985, in Future Missions in Solar, Heliospheric & Space Plasma Physics, ed. E. Rolfe & B. Battrick, ESA SP, 235, 199 [Google Scholar]
- Hauck, B., & Mermilliod, M. 1998, A&AS, 129, 431 [NASA ADS] [CrossRef] [EDP Sciences] [Google Scholar]
- Kjeldsen, H., & Bedding, T. R. 1995, A&A, 293, 87 [NASA ADS] [Google Scholar]
- Kovtyukh, V. V., Soubiran, C., & Belik, S. I. 2004, A&A, 427, 933 [NASA ADS] [CrossRef] [EDP Sciences] [Google Scholar]
- Kupka, F., & Bruntt, H. 2001, Using TEMPLOGG for determining stellar parameters of MONS targets, ed. C. Sterken (C), 39 [Google Scholar]
- Kurucz, R. L., Furenlid, I., Brault, J., & Testerman, L. 1984, Solar flux atlas from 296 to 1300 nm, ed. R. L. Kurucz, I. Furenlid, J. Brault, & L. Testerman [Google Scholar]
- Mathur, S., Eff-Darwich, A., García, R. A., & Turck-Chièze, S. 2008, A&A, 484, 517 [NASA ADS] [CrossRef] [EDP Sciences] [Google Scholar]
- Mathur, S., García, R. A., Régulo, C., et al. 2010, A&A, 511, A46 [NASA ADS] [CrossRef] [EDP Sciences] [Google Scholar]
- Michel, E., Baglin, A., Auvergne, M., et al. 2008, Science, 322, 558 [NASA ADS] [CrossRef] [PubMed] [Google Scholar]
- Michel, E., Samadi, R., Baudin, F., et al. 2009, A&A, 495, 979 [NASA ADS] [CrossRef] [EDP Sciences] [Google Scholar]
- Morel, P. 1997, A&AS, 124, 597 [NASA ADS] [CrossRef] [EDP Sciences] [MathSciNet] [PubMed] [Google Scholar]
- Mosser, B., & Appourchaux, T. 2009, A&A, 508, 877 [NASA ADS] [CrossRef] [EDP Sciences] [Google Scholar]
- Mosser, B., Baudin, F., Lanza, A. F., et al. 2009a, A&A, 506, 245 [NASA ADS] [CrossRef] [EDP Sciences] [Google Scholar]
- Mosser, B., Michel, E., Appourchaux, T., et al. 2009b, A&A, 506, 33 [NASA ADS] [CrossRef] [EDP Sciences] [Google Scholar]
- Ramírez, I., & Meléndez, J. 2005, ApJ, 626, 465 [Google Scholar]
- Rogers, N. Y. 1995, Commun. Asteroseismol., 78, 1 [Google Scholar]
- Samadi, R., Fialho, F., Costa, J. E. S., et al. 2007a, [astro-ph/0703354] [Google Scholar]
- Samadi, R., Georgobiani, D., Trampedach, R., et al. 2007b, A&A, 463, 297 [NASA ADS] [CrossRef] [EDP Sciences] [Google Scholar]
- Scuflaire, R. 1974, A&A, 36, 107 [NASA ADS] [Google Scholar]
- Suárez, J. C., & Goupil, M. J. 2008, Ap&SS, 316, 155 [NASA ADS] [CrossRef] [Google Scholar]
- Thompson, M. J., Christensen-Dalsgaard, J., Miesch, M. S., & Toomre, J. 2003, ARA&A, 41, 599 [NASA ADS] [CrossRef] [Google Scholar]
- Torrence, C., & Compo, G. P. 1998, Bull. Am. Meteorol. Soc., 79, 61 [Google Scholar]
- Toutain, T., & Froehlich, C. 1992, A&A, 257, 287 [NASA ADS] [Google Scholar]
- Turck-Chièze, S., Couvidat, S., Kosovichev, A. G., et al. 2001, ApJ, 555, L69 [NASA ADS] [CrossRef] [Google Scholar]
- Unno, W., Osaki, Y., Ando, H., Saio, H., & Shibahashi, H. 1989, Nonradial oscillations of stars (University of Tokyo Press), 2nd ed. [Google Scholar]
- Valenti, J. A., & Piskunov, N. 1996, A&AS, 118, 595 [NASA ADS] [CrossRef] [EDP Sciences] [Google Scholar]
- van Leeuwen, F. 2007, A&A, 474, 653 [NASA ADS] [CrossRef] [EDP Sciences] [Google Scholar]
Footnotes
- ... HD 49385
- Based on data obtained from the CoRoT (Convection, Rotation and planetary Transits) space mission, developed by the French Space agency CNES in collaboration with the Science Programs of ESA, Austria, Belgium, Brazil, Germany and Spain.
- ...
- Based on data obtained using the Télescope Bernard Lyot at Observatoire du Pic du Midi, CNRS and Université Paul Sabatier, France.
- ... CoRoT
- The CoRoT space mission, launched on 2006 December 27, was delopped an d is operated by the CNES with participation of the Science Programs of ESA; ESA's RSSD, Austria, Belgium, Brazil, Germany and Spain.
All Tables
Table 1: Spectroscopic parameters of HD 49385.
Table 2: Abundances of 22 elements in HD 49385 relative to the Sun.
Table 3: Reference results for the parameters of the radial p modes.
Table 4: Reference results for the parameters of the non-radial p modes (symbols are the same as in Table 3).
Table 5: Results of a Lorentzian fit performed on the peaks identified as potential mixed modes.
Table 6: Reference results for the parameters of the radial p modes for the alternate identification (symbols are the same as in Table 3).
Table 7: Reference results for the parameters of the non-radial p modes for the alternate identification (symbols are the same as in Table 3).
All Figures
| |
Figure 1:
Relative abundances of 22 elements measured in HD 49385.
Open and solid circles are mean values for neutral and
singly ionized lines, respectively.
The yellow horizontal bar marks the mean metalicity with 1- |
| Open with DEXTER | |
| In the text | |
|
|
Figure 2:
Example of the |
| Open with DEXTER | |
| In the text | |
|
|
Figure 3:
The upper panel shows the fit of three synthetic profiles
to the observed line (marked by open circles). Each profile was
convolved with different combinations of |
| Open with DEXTER | |
| In the text | |
|
|
Figure 4: Lightcurve of 137 days of CoRoT observations on HD 49385, detrended using instrumental information. |
| Open with DEXTER | |
| In the text | |
|
|
Figure 5:
Power spectrum of 137 days of CoRoT data for HD 49385. The peaks indicated by arrows are from left to right: the 14- |
| Open with DEXTER | |
| In the text | |
|
|
Figure 6:
Smoothed power spectrum of HD 49385 (with a 10 |
| Open with DEXTER | |
| In the text | |
|
|
Figure 7:
Échelle diagram of HD 49385 computed with a large spacing of
|
| Open with DEXTER | |
| In the text | |
|
|
Figure 8:
Échelle diagram of the peaks with a significance greater than 95% in the power spectrum smoothed over n=15 bins ( |
| Open with DEXTER | |
| In the text | |
|
|
Figure 9:
Large separation profiles derived from the fitted frequencies of the |
| Open with DEXTER | |
| In the text | |
|
|
Figure 10:
Échelle diagram of the fitted modes. The colors correspond to the following degrees: blue |
| Open with DEXTER | |
| In the text | |
|
|
Figure 11:
Linewidths of the fitted modes with 1- |
| Open with DEXTER | |
| In the text | |
|
|
Figure 12:
Amplitudes of the fitted modes with 1- |
| Open with DEXTER | |
| In the text | |
|
|
Figure 13:
Frequency shift
|
| Open with DEXTER | |
| In the text | |
|
|
Figure 14: Échelle diagram for the fitted modes of the alternate identification. Same symbols as in Fig. 10. |
| Open with DEXTER | |
| In the text | |
Copyright ESO 2010
Current usage metrics show cumulative count of Article Views (full-text article views including HTML views, PDF and ePub downloads, according to the available data) and Abstracts Views on Vision4Press platform.
Data correspond to usage on the plateform after 2015. The current usage metrics is available 48-96 hours after online publication and is updated daily on week days.
Initial download of the metrics may take a while.