| Issue |
A&A
Volume 515, June 2010
|
|
|---|---|---|
| Article Number | A85 | |
| Number of page(s) | 7 | |
| Section | Astronomical instrumentation | |
| DOI | https://doi.org/10.1051/0004-6361/200913302 | |
| Published online | 11 June 2010 | |
Imaging performance of multi-etalon bidimensional spectrometers
A. Righini1 - F. Cavallini2 - K. P. Reardon2,3
1 - Department of Physics and Astronomy![]() ,
University of Florence, Largo E. Fermi 2, 50125 Florence, Italy
,
University of Florence, Largo E. Fermi 2, 50125 Florence, Italy
2 - INAF - Osservatorio Astrofisico di Arcetri, Largo E. Fermi 5, 50125
Florence, Italy
3 - Astrophysics Research Centre, Queen's University, Belfast, BT7 1NN,
Northern Ireland, UK
Received 16 September 2009 / Accepted 26 December 2009
Abstract
Aims. In recent years, several new solar and
nighttime panoramic spectrometers based on Fabry-Perot interferometers
have been successfully developed. In this paper we evaluate the imaging
performance of the two types of mountings that have been adopted, telecentric
and classic, in particular trying to understand
which one might be more suitable for future large-aperture solar
telescopes.
Methods. Numerical code was written to simulate the
behavior of such spectrometers, on the basis of the theory of Fourier
optics. This code was used to simulate different instrument
configurations and was tested on previous results obtained either
analytically or numerically by other authors.
Results. Calculations of the system MTF and Strehl
ratios show that both mountings may perform very close to theoretical
expectations. However, gap irregularities in the interferometers may
alter the optical quality of the monochromatic images. In the case of
the classical mounting in a collimated beam, it is possible to
partially compensate for the resulting errors in the wavefront emerging
from the interferometers with a suitable phase plate. We also performed
an observational test of the optical quality delivered by the IBIS
interferometer installed at the Dunn Solar Telescope of the National
Solar Observatory, with the results substantially confirming the
calculations.
Conclusions. It follows from our results that both
mountings may be efficiently used for solar bidimensional spectroscopy.
The final choice depends on the tradeoff between factors such as image
quality, field of view, and acceptable wavelength shift.
Key words: instrumentation: spectrographs - instrumentation: high angular resolution - instrumentation: interferometers - Sun: general
1 Introduction
The Fabry-Perot interferometer (FPI) has several advantageous properties that have led to its broad use in astronomical instrumentation. Successful implementations such as TAURUS (Taylor & Atherton 1980) and HIFI (Bland & Tully 1989) have led to many more recent examples, including 3DII (Ishigaki et al. 2004) on Subaru, OSIRIS (Cepa et al. 2003) on GTC, PFIS (Burgh et al. 2003) on SALT, as well as MSASI (Yoshikawa et al. 2007) for BepiColombo and TFI (Doyon et al. 2008) for JWST.
Combining multiple FPI in series can produce higher spectral
resolution, spectral purity, and free spectral range than with a single
FPI. Several nighttime instruments have been developed using dual-FPI (Nagayama
et al. 2006; Mack et al. 1963; Mentuch
et al. 2008), but this approach has seen the most
widespread application in solar physics, where very high spectral
resolutions (
![]() )
are routinely required. Indeed, at such resolutions, the increased free
spectral range of multi-etalon systems is important because it allows
normal interference filters (0.3-1 nm FWHM) to be
used for order selection. Ramsay
et al. (1970) describe an original implementation of
a solar bidimensional spectrometer, but recently many multi-etalon
devices have been successfully developed Kentischer et al. 1998;
Puschmann
et al. 2006; Cavallini 2006; Scharmer et al. 2008
driven by their currently unique capabilities for integral field
spectroscopy in solar physics. This type of instrument allows for a
detailed investigation of the three-dimensional relationship among
quantities such as velocity, temperature, and magnetic field,
describing the state of the plasma in different solar structures.
)
are routinely required. Indeed, at such resolutions, the increased free
spectral range of multi-etalon systems is important because it allows
normal interference filters (0.3-1 nm FWHM) to be
used for order selection. Ramsay
et al. (1970) describe an original implementation of
a solar bidimensional spectrometer, but recently many multi-etalon
devices have been successfully developed Kentischer et al. 1998;
Puschmann
et al. 2006; Cavallini 2006; Scharmer et al. 2008
driven by their currently unique capabilities for integral field
spectroscopy in solar physics. This type of instrument allows for a
detailed investigation of the three-dimensional relationship among
quantities such as velocity, temperature, and magnetic field,
describing the state of the plasma in different solar structures.
However, the presence of one or more FPIs in the optical path also produces unwanted effects on both the spectroscopic and imaging performance for instruments using either the classic mount (CM) or the telecentric mount (TM). In particular, the TM is systematically affected by phase errors and by a wavelength-dependent pupil apodization, even for a perfect interferometer, which reduce the overall image quality (Beckers 1998). In addition, the flatness errors of the interferometer plates, inherent in any real FPI, will broaden the instrumental profile and impair the optical quality in the CM, while producing field-dependent instrumental profiles in the TM.
Several studies have been carried out in the past to evaluate the broadening of the instrumental profile in CM due to plate defects, while fewer efforts have been made to investigate their effects on image quality. Steel (1967) and Ramsay (1969) made a first evaluation of these effects, limited to the case of parabolic and planar distributions of errors. Beckers (1998), von der Lühe & Kentischer (2000), and Scharmer (2006) examined the imaging properties of a multi-interferometer in both classic and telecentric mounts. Moreover, Martinez Pillet et al. (2004) and Alvarez-Herrero et al. (2006) have recently carried out a detailed study of the image quality of a dual Fabry-Perot in CM for the IMaX instrument of the Sunrise mission.
In the case of the TM, the systematic imaging degradation can be calculated and largely controlled in the design phase by acting on the optics and on the interferometer parameters, while in CM the spectroscopical and the imaging effects due to the plate defects can be evaluated only when the cavity errors and their spatial distribution on the interferometer area are known. Usually the FPI manufacturer specifies the peak-to-valley value of the large-scale cavity errors, but neither their spatial distribution nor the coating roughness are typically provided.
During the design of the Interferometric BIdimensional Spectrometer (IBIS; Cavallini 2006, hereinafter Paper I), a detailed evaluation of the advantages and disadvantages in both imaging and spectroscopic performance (assuming a mainly parabolic error) was carried out, leading to the choice of the classic mount. The spacings and the reflectivity of the IBIS FPIs were chosen based on the spectroscopic requirements as the best compromise between spectral resolution, parasitic light, and transmittance. To optimize the image quality, only two FPI were used and the area illuminated by the pupil image was limited to a central 33 mm circle out of the full 50 mm diameter of the FPI, a compromise between optical quality and the obtainable field of view. In the end, an f-number of 110 was chosen in the tradeoff between field of view and instrumental blueshift. IBIS was successfully installed and has been operated at the Dunn Solar Telescope (DST) of the US National Solar Observatory since 2003. The quality of the images obtained with the instrument (see, for example, Fig. 4 in Cauzzi et al. 2008), suggests that the assumed hypotheses about the cavity-error effects on the image quality are qualitatively correct.
By using a frequency-stabilized HeNe laser, the spatial distribution of the cavity defects for the two FPIs of IBIS were measured in detail, and this information was used to calculate the overall instrumental profile as well as other instrumental parameters (Reardon & Cavallini 2008, hereinafter referred to as Paper II).
In this paper, we utilize these measured, large-scale cavity errors to calculate the modulation transfer functions (MTF) and Strehl ratios using Fourier optics for both telecentric (Sect. 2) and classic mountings (Sect. 3). We apply these techniques to the evaluation of the theoretical imaging performance of two existing solar, FPI-based instruments, TESOS and IBIS. We also show the result of an experimental evaluation of the actual IBIS performance with measurements of the MTF carried out using the images of a knife edge and of a sinusoidal target located in the main focal plane of the telescope (Sect. 4).
2 The telecentric mount
In TM (Fig. 1) the focal plane virtually coincides with the interferometer plates. Generally, however, it is not possible to install the interferometer in the primary focus of the telescope so an optical relay system is used. This system is composed of a series of lenses that transfer the focal plane of the telescope onto the interferometer plates (see Fig. 1, in Paper I). The first one of these lenses forms the image of the telescope entrance pupil and removes the solar image to infinity, and the second one forms the solar image and removes the pupil to infinity. In this optical set up, each image point is the vertex of a cone of rays, where each ray direction biunivocally corresponds to a point on the pupil. If we consider that the FPI spectral transmission varies according to the angle of incidence, the result is that it superimposes the well-known ring pattern on the pupil image, the aspect of which depends on the assumed working wavelength and f-number. However, this terminology is not strictly appropriate, since the FPI acts both as an amplitude and phase mask, as will be shown later. To reduce the apodizing effect of the ring pattern on the entrance pupil and to achieve the required spatial resolution on the final image plane, instrument designers try to keep the f-number of the optical system as large as possible.
| Figure 1:
The telecentric mount (TM), in which the interferometer is
placed at the focal plane. Each image point is formed by a cone of rays
that is differently filtered and phase delayed by the interferometer. |
|
| Open with DEXTER | |
The optical behavior of the telecentric mount can be simulated
by writing a code based on the scalar theory of diffraction and Fourier
optics (Goodman 1968). Let us
first assume the strictly monochromatic case, where we may define a
working wavelength ![]() .
Let
.
Let ![]() be the field distribution on the system focal plane, where the bold
symbol indicates a complex quantity and x0,y0
are coordinates.
be the field distribution on the system focal plane, where the bold
symbol indicates a complex quantity and x0,y0
are coordinates. ![]() can be either the electric or magnetic field and may be expressed as
the Fourier integral of its spatial spectrum
can be either the electric or magnetic field and may be expressed as
the Fourier integral of its spatial spectrum ![]() ,
where fx,fy
are the spatial frequencies on the focal plane and j
is the imaginary unit:
,
where fx,fy
are the spatial frequencies on the focal plane and j
is the imaginary unit:
![\begin{displaymath}\vec{U}(x_0,y_0)= \int _{-\infty}^{\infty} \int _{-\infty}^{\...
...,f_y)\exp[-2{\rm j}\pi (f_xx_0+f_yy_0)]~{\rm d}f_x~{\rm d}f_y.
\end{displaymath}](/articles/aa/full_html/2010/07/aa13302-09/img13.png)
Each component of the spectrum
![\begin{displaymath}\vec{E}(x,y,z) = \vec{A}(\alpha, \beta, \gamma)\exp\left[-{\rm j}\frac{2\pi}{\lambda} (\alpha x+\beta y + \gamma z)\right].
\end{displaymath}](/articles/aa/full_html/2010/07/aa13302-09/img16.png)
|
(2) |
From a well-known property of the cosine directors,
and assuming that
it follows that Eq. (1) may be interpreted as expressing the field on the focal plane as the sum of a bundle of plane waves of suitable amplitude, called angular spectrum. We recall that
The angular spectrum ![]() for an optically perfect system is simply a circle function defined on
the entrance pupil plane of the equivalent single lens telescope,
valued 1 inside and 0 outside the entrance pupil. The pupil coordinates
x1,y1
are
for an optically perfect system is simply a circle function defined on
the entrance pupil plane of the equivalent single lens telescope,
valued 1 inside and 0 outside the entrance pupil. The pupil coordinates
x1,y1
are
where F is the system equivalent focal length (Goodman 1968). To evaluate the effects of the interferometer, this spectrum, which is a complex function of the spatial frequencies fx and fy, should be multiplied by the FPI transmission profile, which is also a function of fx,fy through
The transmission function of the interferometer may be written
in complex form as
![\begin{displaymath}{\cal T} =T\frac{1-R\exp[-{\rm j}\delta]}{1+R^{2}-2R \cos \delta},
\end{displaymath}](/articles/aa/full_html/2010/07/aa13302-09/img23.png)
where
while T and R are the square of the field transmittance and reflectivity of each surface.
Consider the complex number product between ![]() ,
,
![]() ,
and
,
and ![]() ,
where
,
where ![]() is an arbitrary phase plate that may be introduced if needed (see
Eq. (5)).
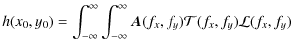
This product should be transformed again to obtain the system PSF h(x0,y0)
on the focal plane in the monochromatic and perfectly coherent case:
is an arbitrary phase plate that may be introduced if needed (see
Eq. (5)).
This product should be transformed again to obtain the system PSF h(x0,y0)
on the focal plane in the monochromatic and perfectly coherent case:
|
||
![$\displaystyle \exp[-{\rm j}2\pi (f_xx_0+f_yy_0)]~{\rm d}f_x~{\rm d}f_y.$](/articles/aa/full_html/2010/07/aa13302-09/img29.png)
|
(4) |
This theory strictly holds for monochromatic and coherent radiation, but, as shown by Goodman (1968), it also works for polychromatic radiation, provided that the bandwidth
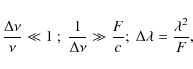
where c is the speed of light. In the case of polichromatic radiation, it is possible also to define a non-coherent PSF, which is simply the square of the coherent one. Therefore we split all the wavelength range admitted by the instrument into a series of spectral channels, assuming that inside each channel the coherent and incoherent PSFs may be calculated as above. Considering F as the reduced DST focal length resulting on the secondary IBIS focal plane, the limiting width of each spectral channel is about 0.2 mÅ. However, in the following calculation, a channel width that is four times larger has been assumed, since the practice has shown that the above conditions may be relaxed. Furthermore, in the systems under study here, all the interference phenomena controlling the secondary image formation take place on much smaller scales than those of the relay lenses inside the solar spectrometers. In ray tracing language, this means that we are considering equal vergences in the conic bundle of rays forming each image point which, in telecentric mount, originate in a single point of the entrance pupil, removed to infinity by the optics. From these equations it is clear why the interferometer modifies the image spatial spectrum, since it filters plane waves depending on their angle
![\begin{displaymath}
{\cal L}(x_1,y_1)={\rm circ}(x_1,y_1)\exp\left[-{\rm j}2\pi \frac{x^{2}_{1}+y^{2}_{1}}{n_f}\right],
\end{displaymath}](/articles/aa/full_html/2010/07/aa13302-09/img32.png)
where

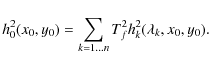
Usually, FPI-based bidimensional spectrometers use two or three interferometers mounted in series to increase the system free spectral range (FSR), which should be such that a single passband may be isolated with a suitable narrow-band interference filter. These systems do not show infinite rejection outside of the interferometer peak transmittance, therefore we should consider that the signal in the focal plane is the integral of image brightness on a large number of spectral channels. Let us call
|
(6) |
The system modulation transfer function (MTF) will then be computed as the Fourier transform of h02(x0, y0), extending the MTF definition for perfectly incoherent systems. In the case of multiple interferometers, the system complex transmission function will be the product of the single interferometer transmission functions. We discuss below the effect of interferometer optical errors in TM, which may be considered as a spurious phase plate located on the focal plane.
2.1 TESOS: a case study
We show a case study of TESOS (Telecentric Etalon SOlar Spectrometer), a telecentric system built by Kipenheuer Institute (Kentischer et al. 1998; Tritschler et al. 2002) and installed at the Vacuum Tower Telescope on Temerife. We suppose that the three interferometers do not have any physical thickness and that all are coincident with the focal plane. Practically, this set up could be obtained by re-imaging the solar image separately on each interferometer. While this is not the precise configuration used by TESOS, it is more straightforward to model. Once the interferometer spacings and the prefilter profile have been assigned, the code tunes all the three interferometers in order to align their passbands, and then performs the calculations of the PSF and of the MTF. We assume a working wavelength of 5000 Å and an f-number which ranges from 64 to 512. The results we finally obtained are very close to those quoted by Scharmer (2006) both before (Table 1, fourth column) and after (Table 2, third column) correction for the defocusing effect.
Table 1:
Strehl ratio vs. f-number of TESOS without
refocusing (
![]() Å).
Å).
Table 2:
Strehl ratio vs. f-number of TESOS after image
refocusing using a lens characterized by its Fresnel number (
![]() Å).
Å).
Plate defects of the interferometer with amplitudes comparable
to those measured in Paper II have only a minor effect on the
image quality. From the point of view of the fourier Optics, the
interferometer in TM can be considered as a phase plate located between
the lens and the focal plane. In this case, the field distribution on
the focal plane, apart from a quadratic phase effect canceled when
squaring, is the Fourier transform of that part of the phase plate that
is subtended by the projected lens aperture on the interferometer. This
area will increase if the FPI are moved away from the focal plane for
technical reasons. For typical illuminated areas of a few millimeters,
the interferometer surfaces are practically perfect. For the FPI
measured in Paper II, the surface errors over such an area are
typically ![]() or better in the central 30 mm of the plates. The
microroughness measured in Paper II was found to have a normal
distribution with an RMS of 9 Å, with half of the observed
microroughness occurring on scales below our 33
or better in the central 30 mm of the plates. The
microroughness measured in Paper II was found to have a normal
distribution with an RMS of 9 Å, with half of the observed
microroughness occurring on scales below our 33 ![]() m resolution
element on the FPI plates. Because of the scaling effects, this
microroughness will operate primarily on the low-frequency part of the
image spatial spectrum. If the projected pupil on the interferometer is
spread over only a few defects of the plate's spacing, these will
behave as large patches on the entrance pupil and will act on the
spatial component of the spectrum connected with that size.
m resolution
element on the FPI plates. Because of the scaling effects, this
microroughness will operate primarily on the low-frequency part of the
image spatial spectrum. If the projected pupil on the interferometer is
spread over only a few defects of the plate's spacing, these will
behave as large patches on the entrance pupil and will act on the
spatial component of the spectrum connected with that size.
3 The classic mount
The so-called classic mount may be viewed schematically as placing an enlarged interferometer in front of the entrance pupil of the telescope, which may be considered for the sake of clarity as a single lens having the diameter of the entrance pupil and the effective focal length of the real telescope (Fig. 2).
| Figure 2:
The classic mount (CM), with the interferometer placed at the system
entrance pupil. The image is not spectroscopically homogeneous but the
bandwidth is not affected from the system f-number.
|
|
| Open with DEXTER | |
In this case, the field distribution on the image plane is simply the Fourier transform of the field distribution on the lens. If the lens and FPI are both optically perfect, the field and the intensity PSFs will be those predicted by the diffraction theory for a plane wave passing through a circular aperture, since an ideal FPI does not change the planarity of the incoming wavefront. The phase shift affecting rays not parallel to the optical axis (Scharmer 2006) introduces a phase factor that only depends on the focal plane coordinates and is therefore canceled when evaluating the intensity. If we add a narrow band filter to our system, with a bandwidth less than one FSR, we would observe a transmission ring system superimposed on the image of the sky, as predicted by the FPI theory. In the case of a continuous source in the sky, the size of the central bull eye and the spatial thickness of the rings depend on the prefilter pass band, but the radiation impinging on each pixel has a spectral distribution given by the Airy function (James & Sternberg 1969). The peak of the spectral Airy function depends on the pixel position on the focal plane. We are therefore in the presence of a spectral shift on the image plane, which must be considered in the data evaluation process.
Let us consider now the case of a real FPI
affected by plate defects that modulate the spacing as a function of
the pupil coordinates. In this case, when considering the action of the
FPI on the real and imaginary part of the incoming wave, as described
by the interferometer complex transmission function (Eq. (3)), we observe an
aberrated wavefront on the front surface of the telescope equivalent
lens. The system will therefore suffer from aberration effects, which
can be computed if the distribution of the interferometer spacing
defects is known. If we suppose that the interferometer may be
considered as an honeycomb of elemental FPIs (Bousquet
1969), each one having its spacing, the overall MTF may be
computed by using the usual toolbox of the Fourier optics (Goodman 1968). We have therefore
written a computer program that essentially evaluates the bidimensional
Fourier transform of the system complex pupil function when an
aberrated FPI is placed in front of it, supposing a plane wave
impinging on the telescope. The same problem has been analytically
solved by Ramsay (1969)
supposing a parabolical defect affecting the interferometer spacing.
Ramsay Eq. (34) gives the central intensity I(0)
of the intensity point spread function (which is also the integral of
the system MTF), as
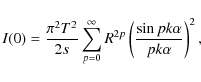
|
(7) |
where
Finally, in the case of two or more real interferometers mounted in series in front of the entrance pupil, the wavefront impinging on the lens will have its phase sequentially distorted by all the interferometers. The wavefront amplitude will also be modulated by transmittance fluctuations because the uncorrelated gap errors of the different FPI will result in a local detuning and transmission profile misalignment, producing a loss of throughput (mutual masking). For these reasons it is important to know the spatial distribution of the cavity defects of each FPI to evaluate the quality of the monochromatic images that will be obtained on the final focal plane of an instrument utilizing multiple FPI.
3.1 IBIS: a case study
The optical layout of IBIS has been extensively detailed in Paper I. In brief, it can be considered as an afocal optical system formed by: the DST, the adaptive optics system, the first collimating lens, the two interferometers mounted in series, the imaging lens, and a narrow band filter, in order to cancel the implicit spectral multiplicity of the optical system. Some of the essential parameters of the system are listed in Table 3. The distribution of the spacing fluctuations at large and small scales was determined for each FPI as described in Paper II.
Table 3: IBIS instrumental parameters.
To simulate the optical effects of the cavity errors, the code considers that a plane wave, impinging on the system entrance pupil, is aberrated in phase and filtered in amplitude by both interferometers, previously tuned with an intensity maximization procedure equal to what is actually used for IBIS. The spatial distribution of the impinging wave on the imaging lens is Fourier-transformed to obtain the field PSF on the IBIS focal plane, and then squared to obtain the intensity PSF. The Fourier transform of the PSF gives the system MTF. However, before this last step, we must consider that the radiation is not as monochromatic as required by Fourier optics. We therefore divide the allowed wavelength range into a series of contiguous intervals, such that the radiation in each interval is not coherent with the radiation belonging to adjacent intervals (the approach already utilized for TM). Under this assumption, we may simply sum the intensity PSFs computed for each wavelength channel, and then the integrated PSF may be Fourier-transformed to obtain the overall MTF. The result is shown in (Fig. 3) where we plot only two traces of the MTF along the horizontal (fx) and vertical (fy) axes. Using these nominal parameters for IBIS, we obtain a Strehl ratio of 0.886, which is good but doesn't fully match the experience using the instrument.
However, the shape of the wavefront error introduced by the IBIS interferometer plates is roughly parabolic, and hence the dominant effect is that of a shift of the location of the image plane. This can be compensated by introducing a numerical lens to achieve an optimal focusing. For the IBIS configuration, the best focus has been obtained using a lens of -0.14 Fresnel number). This is equivalent to the procedure followed by an observer trying to find the sharpest image. With this simple and straightforward correction, the Strehl ratio for IBIS increases to 0.949. The improvement in the MTF can be seen clearly in Fig. 4, where we plot the MTF defect (MTFd) as a negative number (i.e. indicating the difference between aberrated and theoretical MTF at each spatial frequency). The lowest curve shows the MTFd without any compensation, while the second curve from the bottom is the one achieved with only this refocusing.
![\begin{figure}
\par\includegraphics[width=6.0 cm, angle=-90]{13302f3.ps}
\end{figure}](/articles/aa/full_html/2010/07/aa13302-09/img46.png)
|
Figure 3:
Computed IBIS modulation transfer function, including cavity errors,
compared to the theoretical MTF for an incoherent system with a perfect
circular aperture (solid). The computed MTF has different radial
profiles. Plotted here are the the upper part of the vertical profile
(dotted) and the left part of the horizontal profile (dashed).
The plotted MTF is for |
| Open with DEXTER | |
![\begin{figure}
\par\includegraphics[width=6.0 cm, angle=-90,clip]{13302f4.ps}
\end{figure}](/articles/aa/full_html/2010/07/aa13302-09/img47.png)
|
Figure 4: Computed IBIS modulation transfer function defect, calculated as the difference from the theoretical MTF for a 762 mm aperture. From bottom to top: native IBIS MTF without refocusing (solid), native IBS MTF with refocusing (short dash), IBS MTF after compensation of the wavefront errors induced by interferometer plates errors (long dash), IBIS MTF with both phase compensation and refocusing (dotted), and finally, IBIS MTF only considering masking effects (dot dash). |
| Open with DEXTER | |
![\begin{figure}
\par\includegraphics[width=6.0 cm, angle=-90,clip]{13302f5.ps}\vspace*{2mm}
\end{figure}](/articles/aa/full_html/2010/07/aa13302-09/img48.png)
|
Figure 5:
Solid line: measured IBIS MTF obtained by evaluating the Fourier
transform of the derivative of an observed intensity profile of a step
intensity function on the object plane. Squares: experimental MTF
evaluated using a sinusoidal target in an object plane (errors are
comparable to the size of the squares). Dashed line: computed MTF for
the aberrated FPI after best refocusing. The measurements and the
calculations were carried out at |
| Open with DEXTER | |
Since the FPI gap errors are typically caused by the
underlying shape of the plates or by the structure of the multilayer
coating, we can assume that the phase deformations that these errors
produce on the wavefront are stable in time. Therefore, in principle, a
further correction could be achieved by compensating for these
deformations with a suitable phase plate computed for the central
wavelength of the transmission profile. This phase plate may be
obtained by simply recording the phase variations ![]() of the wavefront after the FPI, and then correcting the aberrated
wavefront multiplying the field by a factor
of the wavefront after the FPI, and then correcting the aberrated
wavefront multiplying the field by a factor ![]() .
Such a phase plate would be wavelength-dependent even within a
prefilter spectral range, and it might therefore be speculated that a
better compensation could be achieved using a different correcting
phase plate than was computed for the uncorrected system at the peak
transmission. If we perform this correction, the result is very good,
as shown in Fig. 4
(third curve from the bottom); the Strehl ratio rises
to 0.964. The frequency distribution of the MTFd is altered
depending on the type of correction applied. Most of the correction at
high spatial frequencies is achieved with the refocusing, while the
phase-plate correction seems to operate primarily at the intermediate
frequencies.
.
Such a phase plate would be wavelength-dependent even within a
prefilter spectral range, and it might therefore be speculated that a
better compensation could be achieved using a different correcting
phase plate than was computed for the uncorrected system at the peak
transmission. If we perform this correction, the result is very good,
as shown in Fig. 4
(third curve from the bottom); the Strehl ratio rises
to 0.964. The frequency distribution of the MTFd is altered
depending on the type of correction applied. Most of the correction at
high spatial frequencies is achieved with the refocusing, while the
phase-plate correction seems to operate primarily at the intermediate
frequencies.
We may also combine these two approaches, considering that even in the case of phase compensation, the observer would try to obtain the best focus, but the gain is very small: from 0.964 to 0.969 in Strehl ratio (see the fourth curve from the bottom in Fig. 4). This result suggests that the assumed phase plate has the correct form.
Table 4: IBIS Strehl ratios for different modeled configurations.
Last but not least, we point out that about 50% of the total MTF defect arises from the mutual masking effect mentioned previously (Sect. 3). To understand this result, let us consider that the wavefront coming through both interferometers also has a field amplitude distribution component. If in this numerical experiment we set the phase distribution to a constant zero value, then we retain only this field amplitude distribution. The field distributions in each channel depend on the assumed spectral distribution of the impinging radiation, which has been assumed to be a continuum for this study. We then obtain the top curve in Fig. 4, which corresponds to a Strehl number of 0.980. This last effect could in principle be corrected by introducing a transmission mask to restore uniform transmission over the pupil, but this may be difficult to construct and could exact a significant price in terms of reduced total transmission. As in the case of the correcting phase plate, the optimal mask should be computed for each adopted prefilter. We conclude by noting that refocusing recovers most of the MTFd in the crucial high-frequency range (50-70 cycles/mm in our optical set up).
![\begin{figure}
\par\includegraphics[width=6.0 cm,clip]{13302f6.ps}
\vspace*{4mm}
\end{figure}](/articles/aa/full_html/2010/07/aa13302-09/img51.png)
|
Figure 6:
Contour plot @ |
| Open with DEXTER | |
From these numerical experiments, we can draw the following
conclusions, also summarized in Table 4:
a) the best IBIS optical quality typically cannot exceed
Strehl 0.98 due the residual intensity masking; b) a simple
refocusing (achieved here with the numerical lens introduced in the
optical path) can improve the Strehl ratio of IBIS from 0.886 to 0.949
(at ![]() Å); c) with
suitable devices acting on the wavefront, it would be possible to
correct the interferometer aberrations up to 0.969. The optimal
wavefront correction could be achieved with an active mirror acting as
a tunable phase plate modulated by suitable software during the
wavelength scanning.
Å); c) with
suitable devices acting on the wavefront, it would be possible to
correct the interferometer aberrations up to 0.969. The optimal
wavefront correction could be achieved with an active mirror acting as
a tunable phase plate modulated by suitable software during the
wavelength scanning.
4 MTF measurement
We made several attempts to evaluate experimentally the IBIS MTF at the focal plane of the DST. It is not simple to devise an MTF calibration procedure that reasonably resembles the actual operating conditions of the instrument. We made a first attempt by using a sinusoidal target placed in the focal plane of the telescope and illuminated by a defocused and moving solar image. As an alternative approach, we used the edges of the black square included in the standard USAF target placed in the same telescope focal plane, again moving the background solar image. The Fourier transform of the first derivative of the edge intensity profiles allows evaluation of vertical and horizontal MTFs.The overall result shown in Fig. 5 in the case of the 8542 Å transmission band shows that, at least at this wavelength, IBIS operates substantially at its theoretical spatial resolving power. The small increase at low-frequencies in the experimental MTF, in comparison to the computed MTF, might be ascribed to a certain degree of coherence present in the optical path, which could be introduced by the defocusing of the incident solar image. The calculated Strehl ratios at 8542 Å are also shown in the 3rd column of Table 4.
5 Conclusions
Imaging spectrometers based on Fabry-Perot interferometers have a series of important characteristics that has motivated their increasing use in astronomical instrumentation. By combining full spectral information with short-exposure images, with the latter permitting application of post-facto image reconstruction, they have proven to be a powerful tool for solar physics.
However, FPI can be very sensitive to a range of issues concerning their fabrication and alignment, many of which are exacerbated in multi-etalon systems. These include the spacing errors, both large and small scale, of the FPI plates, ghost reflections between interferometers, parallelism and alignment of the FPI plates, thermal stability, and the proper tuning of the different FPI passbands. These need to be carefully addressed in the development of instrumentation that seeks to simultaneously optimize spectral and spatial performance. We directly discussed many of these issues in Papers I and II, and the results obtained with IBIS show that the these problems have been suitably controlled. The work in this third paper extends the effort to address the question of optical quality achievable with instruments of this type.
We developed a general code based on Fourier optics to
evaluate the optical quality of a real multi-etalon
imaging spectrometer, both in telecentric and in classic mounts, using
the distributions of cavity errors actually measured for the two FPI
used in IBIS. The results are in good accordance with those obtained by
other authors for TM and CM for some particular forms of cavity
defects. Moreover, the results were compared with direct measurements
of the instrumental MTF and found to agree. We find that IBIS has a
Strehl ratio ![]() 0.95
which, in principle, could be further improved up to 0.97 by means of a
suitable phase plate. We confirm that TESOS achieves a similar optical
quality only for an f-number greater than
0.95
which, in principle, could be further improved up to 0.97 by means of a
suitable phase plate. We confirm that TESOS achieves a similar optical
quality only for an f-number greater than ![]() 256
(Table 2).
256
(Table 2).
This demonstrates that both the telecentric and classic mounts may be effectively used for bidimensional spectroscopy and that their difference apparently lies in the spatial multiplicity (i.e. field size). For a given telescope aperture, the achievable field-of-view depends on the FPI useful area and the f-number of the incident beam. In the case of the CM, the f-number is limited by the tradeoff with the maximum wavelength shift that can be tolerated on the focal plane, while in TM, the f-number is dictated by with the minimum allowed optical quality. On the other hand, large-scale plate gap errors limit the FPI useful area in the case of the CM, in a tradeoff with minimum admitted optical quality. In TM, the same tradeoff in useful area is made with the maximum local detuning that can be tolerated on the focal plane.
Therefore, neither of the two mounts is better in principle. The choice between them first requires a measurement of the actual inteferometer cavity errors, and then an approach, similar to the one described here, allowing us to realistically evaluate their spectroscopic and imaging performance. The results of these calculations can then be compared with the required instrumental characteristics to determine the preferred configuration. Such a preliminary study will be mandatory in the case of imaging spectrometers using large diameter etalons, where the cavity defects may increase and their role on the overall instrument performance become more critical.
AcknowledgementsThe authors are indebted to G. Scharmer and the anonymous referee for their comments on the manuscript. IBIS was developed by INAF/OAA with contributions from the University of Florence, the University of Rome, MIUR, and MAE, and is operated with support of the National Solar Observatory. The NSO is operated by the Association of Universities for Research in Astronomy, Inc., under cooperative agreement with the National Science Foundation. This work was funded in part by MIUR and by the European Commission through the European Solar Telescope Design Study. This research made use of NASA's Astrophysics Data System.
References
- Alvarez-Herrero, A., Belenguer, T., Pastor, C., et al. 2006, in SPIE Conf. Ser., ed. J. C. Mather, H. A. MacEwen, & M. W. M. de Graauw, 6265, 74 [Google Scholar]
- Beckers, J. M. 1998, A&AS, 129, 191 [NASA ADS] [CrossRef] [EDP Sciences] [Google Scholar]
- Bland, J., & Tully, R. B. 1989, AJ, 98, 723 [NASA ADS] [CrossRef] [Google Scholar]
- Bousquet, P. 1969, Spectroscopie instrumentale (Dunod Universite, Paris: Dunod) [Google Scholar]
- Burgh, E. B., Nordsieck, K. H., Kobulnicky, H. A., et al. 2003, in SPIE Conf. Ser. 4841, ed. M. Iye, & A. F. M. Moorwood, 1463 [Google Scholar]
- Cauzzi, G., Reardon K. P., Unitenbrock, H., et al. 2008, A&A, 480, 515 [NASA ADS] [CrossRef] [EDP Sciences] [Google Scholar]
- Cavallini, F. 2006, Sol. Phys., 236, 415 [NASA ADS] [CrossRef] [Google Scholar]
- Cepa, J., Aguiar-Gonzalez, M., Bland-Hawthorn, J., et al. 2003, in SPIE Conf. Ser. 4841, ed. M. Iye, & A. F. M. Moorwood, 1739 [Google Scholar]
- Doyon, R. Rowlands, N. Hutchings, J., et al. 2008 in SPIE Conf. Ser. 7010, ed. J. Oschmann, M. W. M. de Graauw, & H. A. MacEwan, 70100X [Google Scholar]
- Goodman, J. W. 1968, Introduction to Fourier optics (Introduction to Fourier optics, 2nd edn. (New York: McGraw-Hill, Series: McGraw-Hill series in electrical and computer engineering ; Electromagnetics. ISBN: 0070242542 [Google Scholar]
- Ishigaki, T., Hayashi, T., Ohtani, H., et al. 2004, PASJ, 56, 723 [NASA ADS] [Google Scholar]
- James, J. F., & Sternberg, R. S. 1969, The design of optical spectrometers (London: Chapman and Hall) [Google Scholar]
- Kentischer, T. J., Schmidt, W., Sigwarth, M., & Uexkuell, M. V. 1998, A&A, 340, 569 [NASA ADS] [Google Scholar]
- Mack, J. E., McNutt, D. P., Roester, F. L., & Chabbal, R. 1963, Appl. Opt., 2, 873 [NASA ADS] [CrossRef] [Google Scholar]
- Martinez Pillet, V., Bonet, J. A., Collados, M., et al. 2004, in SPIE Conf. Ser. 5487, ed. J. C. Mather, 1152 [Google Scholar]
- Mentuch, E., Scott, A., Abraham, R., et al. 2008, in SPIE Conf. Ser. 7014, ed. I. S. McLean & M. M. Casali, 701476 [Google Scholar]
- Nagayama, T., Nagata, T., Zenno, T., et al. 2006, in SPIE Conf. Ser. 6269, ed. I. S. McLean & M. Iye, 626948 [Google Scholar]
- Puschmann, K. G., Kneer, F., Seelemann, T., & Wittmann, A. D. 2006, A&A, 451, 1151 [NASA ADS] [CrossRef] [EDP Sciences] [Google Scholar]
- Ramsay, J. V. 1969, Appl. Opt., 8, 569 [NASA ADS] [CrossRef] [PubMed] [Google Scholar]
- Ramsay, J. V., Kobler, H., & Mugridge, E. G. V. 1970, Sol. Phys., 12, 492 [NASA ADS] [CrossRef] [Google Scholar]
- Reardon, K. P., & Cavallini, F. 2008, A&A, 481, 897 [NASA ADS] [CrossRef] [EDP Sciences] [Google Scholar]
- Scharmer, G. B. 2006, A&A, 447, 1111 [NASA ADS] [CrossRef] [EDP Sciences] [Google Scholar]
- Scharmer, G. B., Narayan, G., Hillberg, T., et al. 2008, ApJ, 689, L69 [NASA ADS] [CrossRef] [Google Scholar]
- Steel, W. H. 1967, Interferometry (Cambridge Monographs on Physics, Cambridge: University Press) [Google Scholar]
- Taylor, K., & Atherton, P. D. 1980, MNRAS, 191, 675 [NASA ADS] [Google Scholar]
- Tritschler, A., Schmidt, W., Langhans, K., & Kentischer, T. 2002, Sol. Phys., 211, 17 [NASA ADS] [CrossRef] [Google Scholar]
- von der Lühe, O., & Kentischer, T. J. 2000, A&AS, 146, 499 [NASA ADS] [CrossRef] [EDP Sciences] [Google Scholar]
- Yoshikawa, I., Kameda, S., Matsuura, K., et al. 2007, Planet. Space Sci., 55, 1622 [NASA ADS] [CrossRef] [Google Scholar]
Footnotes
All Tables
Table 1:
Strehl ratio vs. f-number of TESOS without
refocusing (
![]() Å).
Å).
Table 2:
Strehl ratio vs. f-number of TESOS after image
refocusing using a lens characterized by its Fresnel number (
![]() Å).
Å).
Table 3: IBIS instrumental parameters.
Table 4: IBIS Strehl ratios for different modeled configurations.
All Figures
| |
Figure 1:
The telecentric mount (TM), in which the interferometer is
placed at the focal plane. Each image point is formed by a cone of rays
that is differently filtered and phase delayed by the interferometer. |
| Open with DEXTER | |
| In the text | |
| |
Figure 2:
The classic mount (CM), with the interferometer placed at the system
entrance pupil. The image is not spectroscopically homogeneous but the
bandwidth is not affected from the system f-number.
|
| Open with DEXTER | |
| In the text | |
|
|
Figure 3:
Computed IBIS modulation transfer function, including cavity errors,
compared to the theoretical MTF for an incoherent system with a perfect
circular aperture (solid). The computed MTF has different radial
profiles. Plotted here are the the upper part of the vertical profile
(dotted) and the left part of the horizontal profile (dashed).
The plotted MTF is for |
| Open with DEXTER | |
| In the text | |
|
|
Figure 4: Computed IBIS modulation transfer function defect, calculated as the difference from the theoretical MTF for a 762 mm aperture. From bottom to top: native IBIS MTF without refocusing (solid), native IBS MTF with refocusing (short dash), IBS MTF after compensation of the wavefront errors induced by interferometer plates errors (long dash), IBIS MTF with both phase compensation and refocusing (dotted), and finally, IBIS MTF only considering masking effects (dot dash). |
| Open with DEXTER | |
| In the text | |
|
|
Figure 5:
Solid line: measured IBIS MTF obtained by evaluating the Fourier
transform of the derivative of an observed intensity profile of a step
intensity function on the object plane. Squares: experimental MTF
evaluated using a sinusoidal target in an object plane (errors are
comparable to the size of the squares). Dashed line: computed MTF for
the aberrated FPI after best refocusing. The measurements and the
calculations were carried out at |
| Open with DEXTER | |
| In the text | |
|
|
Figure 6:
Contour plot @ |
| Open with DEXTER | |
| In the text | |
Copyright ESO 2010
Current usage metrics show cumulative count of Article Views (full-text article views including HTML views, PDF and ePub downloads, according to the available data) and Abstracts Views on Vision4Press platform.
Data correspond to usage on the plateform after 2015. The current usage metrics is available 48-96 hours after online publication and is updated daily on week days.
Initial download of the metrics may take a while.