| Issue |
A&A
Volume 515, June 2010
|
|
|---|---|---|
| Article Number | A10 | |
| Number of page(s) | 10 | |
| Section | Stellar structure and evolution | |
| DOI | https://doi.org/10.1051/0004-6361/200912951 | |
| Published online | 28 May 2010 | |
Is there a highly magnetized neutron star in GX 301-2?
V. Doroshenko1 - A. Santangelo1 - V. Suleimanov1,5 - I. Kreykenbohm2,3 - R. Staubert1 - C. Ferrigno1,4 - D. Klochkov1
1 - Institut für Astronomie und Astrophysik, Sand 1, 72076 Tübingen, Germany
2 - Dr. Karl Remeis-Sternwarte, Sternwartstrasse 7, 96049 Bamberg, Germany
3 -
Erlangen Centre for Astroparticle Physics (ECAP), Erwin-Rommel-Strasse 1, 91058 Erlangen, Germany
4 - ISDC Data Centre for Astrophysics, Chemin d'Écogia 16, 1290 Versoix, Switzerland
5 - Kazan State University, Kremlevskaya 18, 420008, Kazan, Russia
Received 21 July 2009 / Accepted 17 February 2010
Abstract
We present the results of an in-depth study of the long-period X-ray pulsar
GX 301-2. Using archival data of INTEGRAL, RXTE
ASM, and CGRO BATSE, we study the spectral and timing properties
of the source. Comparison of our timing results with previously published
work reveals a secular decay of the orbital period at a rate of
![]()
![]() ,
which is an order of
magnitude faster than for other known systems. We argue that this is
probably result either of the apsidal motion or of gravitational coupling
of the matter lost by the optical companion with the neutron star, although
current observations do not allow us to distinguish between those
possibilities. We also propose a model to explain the observed long pulse
period. We find that a very strong magnetic field
,
which is an order of
magnitude faster than for other known systems. We argue that this is
probably result either of the apsidal motion or of gravitational coupling
of the matter lost by the optical companion with the neutron star, although
current observations do not allow us to distinguish between those
possibilities. We also propose a model to explain the observed long pulse
period. We find that a very strong magnetic field
![]() G can
explain the observed pulse period in the framework of existing models for
torques affecting the neutron star. We show that the apparent contradiction
with the magnetic field strength
G can
explain the observed pulse period in the framework of existing models for
torques affecting the neutron star. We show that the apparent contradiction
with the magnetic field strength
![]() G
derived from the observed cyclotron line position may be resolved if the
line formation region resides in a tall accretion column of
height
G
derived from the observed cyclotron line position may be resolved if the
line formation region resides in a tall accretion column of
height ![]() 2.5-3
2.5-3
![]() .
The color temperature measured from
the spectrum suggests that such a column may indeed be present, and our
estimates show that its height is sufficient to explain the observed
cyclotron line position.
.
The color temperature measured from
the spectrum suggests that such a column may indeed be present, and our
estimates show that its height is sufficient to explain the observed
cyclotron line position.
Key words: pulsars: individual: GX 301-2 - stars: neutron - binaries: general
1 Introduction
GX 301-2 (also known as 4U 1223-62) is a high-mass X-ray binary
system, consisting of a neutron star orbiting the early B-type
optical companion Wray 977. The neutron star is a ![]() 680 s X-ray pulsar
(White et al. 1976), accreting from the dense wind of the optical
companion. The wind's mass-loss rate of the optical component is one of the
highest known in the galaxy:
680 s X-ray pulsar
(White et al. 1976), accreting from the dense wind of the optical
companion. The wind's mass-loss rate of the optical component is one of the
highest known in the galaxy:
![]() (Kaper et al. 2006). Because the terminal
velocity of the wind is very low (
(Kaper et al. 2006). Because the terminal
velocity of the wind is very low (
![]() ,
Kaper et al. 2006), the accretion rate is high enough to explain the observed
luminosity of
,
Kaper et al. 2006), the accretion rate is high enough to explain the observed
luminosity of
![]() .
The distance to the source is estimated to be between
.
The distance to the source is estimated to be between
![]() kpc (Parkes et al. 1980) and
5.3 kpc (Kaper et al. 1995), depending on the spectral
classification of Wray 977. The latest estimate is
3 kpc (Kaper et al. 2006). The orbit is highly eccentric with an
eccentricity of
kpc (Parkes et al. 1980) and
5.3 kpc (Kaper et al. 1995), depending on the spectral
classification of Wray 977. The latest estimate is
3 kpc (Kaper et al. 2006). The orbit is highly eccentric with an
eccentricity of
![]() 0.5 and an orbital period of
0.5 and an orbital period of
![]() d (Koh et al. 1997). The absence of X-ray
eclipses despite the large radius (
d (Koh et al. 1997). The absence of X-ray
eclipses despite the large radius (
![]() )
of Wray 977
(Parkes et al. 1980) constrains the inclination angle in the range
)
of Wray 977
(Parkes et al. 1980) constrains the inclination angle in the range
![]() with a best-fit value of
with a best-fit value of
![]() (Kaper et al. 2006; Leahy & Kostka 2008). The source
exhibits regular X-ray flares about 1-2 d before the periastron passage
(orbital phase
(Kaper et al. 2006; Leahy & Kostka 2008). The source
exhibits regular X-ray flares about 1-2 d before the periastron passage
(orbital phase ![]() 0.95). There is also an indication of a second flare
at orbital phase
0.95). There is also an indication of a second flare
at orbital phase ![]() 0.5 (Koh et al. 1997). Several hypotheses have
been proposed to explain the observed orbital lightcurve, including a
circumstellar disk (Koh et al. 1997) and a quasi-stable accretion
stream (Leahy & Kostka 2008). Similar to other wind accreting systems, the
pulse period behavior of GX 301-2 on short time scales is
described well by a random walk model (de Kool & Anzer 1993).
GX 301-2 exhibits a long-term pulse period evolution as well. The
observed pulse period remained
0.5 (Koh et al. 1997). Several hypotheses have
been proposed to explain the observed orbital lightcurve, including a
circumstellar disk (Koh et al. 1997) and a quasi-stable accretion
stream (Leahy & Kostka 2008). Similar to other wind accreting systems, the
pulse period behavior of GX 301-2 on short time scales is
described well by a random walk model (de Kool & Anzer 1993).
GX 301-2 exhibits a long-term pulse period evolution as well. The
observed pulse period remained
![]() 700 s until 1984 when it
began to decrease during a rapid spin-up episode observed by BATSE
(Bildsten et al. 1997; Koh et al. 1997). The spin-up trend reversed in 1993
(Pravdo & Ghosh 2001) and ever since the pulse period has been increasing
(Kreykenbohm et al. 2004; La Barbera et al. 2005).
700 s until 1984 when it
began to decrease during a rapid spin-up episode observed by BATSE
(Bildsten et al. 1997; Koh et al. 1997). The spin-up trend reversed in 1993
(Pravdo & Ghosh 2001) and ever since the pulse period has been increasing
(Kreykenbohm et al. 2004; La Barbera et al. 2005).
The X-ray spectrum of the GX 301-2 is rich in features. The lower
energy range is subject to heavy and variable photoelectric absorption
(White et al. 1976). As shown by Kreykenbohm et al. (2004) and
La Barbera et al. (2005), a partial covering model with two absorption
columns is required to describe the spectrum. There is a complex of iron
lines at ![]() 6.4 to 7.1 keV (Watanabe et al. 2003). A high-energy
cutoff at
6.4 to 7.1 keV (Watanabe et al. 2003). A high-energy
cutoff at ![]() keV, together with a deep and broad cyclotron
resonance scattering feature (CRSF) at
keV, together with a deep and broad cyclotron
resonance scattering feature (CRSF) at ![]() 30-45 keV, is present at
higher energies (Kreykenbohm et al. 2004; Orlandini et al. 2000; Makishima & Mihara 1992; La Barbera et al. 2005). The CRSF is highly variable with pulse phase, and it
exhibits interesting correlations with the continuum
parameters (Kreykenbohm et al. 2004).
30-45 keV, is present at
higher energies (Kreykenbohm et al. 2004; Orlandini et al. 2000; Makishima & Mihara 1992; La Barbera et al. 2005). The CRSF is highly variable with pulse phase, and it
exhibits interesting correlations with the continuum
parameters (Kreykenbohm et al. 2004).
The nature of accreting pulsars with long pulse periods is still poorly
understood. Because of the low moment of inertia of the neutron star, the
accelerating torque of the accreted matter can spin up a neutron star very
efficiently. Braking torques are then required to explain the observed long
pulse periods. It is commonly assumed that the observed pulse period is
determined by the equality of torques affecting the neutron star or relaxes
to the value determined by this equality. Braking torques are generally
associated with the coupling of the neutron star's magnetic field with the
surrounding plasma. The drag force depends on the relative linear speed of
field lines at certain effective radius, which in turn depends on the
magnetic field strength. The efficiency of braking decreases for slowly
rotating and weakly magnetized neutron stars so a strong field (up to
1015 G, Shakura 1975) is required to spin down a
slowly rotating accreting X-ray pulsar even further. This results in an
apparent contradiction with field estimates obtained from the CRSF centroid
energy, which is
![]() in the case of GX 301-2 and in the same order of magnitude as for other sources.
in the case of GX 301-2 and in the same order of magnitude as for other sources.
Table 1: Pulse period values obtained with archival INTEGRAL data.
Table 2: Pointed observations of GX 301-2 by INTEGRAL, with an updated ephemeris to calculate the orbital phase.
We suggest that this contradiction may be resolved if the line-forming region resides in an accretion column of significant height (Basko & Sunyaev 1976), comparable to the neutron star radius. We investigate this hypothesis using INTEGRAL and BATSE observations to study the spectral and timing properties of GX 301-2.
2 Observations and data selection
The International Gamma-Ray Astronomy Laboratory (INTEGRAL)
launched in October 2002 by the European Space Agency (ESA) is equipped
with 3 co-aligned coded mask instruments: IBIS (Imager onboard the
INTEGRAL Satellite, Ubertini et al. 2003), JEM-X
(Joint European X-ray Monitor, Lund et al. 2003), and SPI
(Spectrometer on INTEGRAL, Vedrenne et al. 2003). Because
of limited SPI sensitivity for variable sources, we rely on data
from IBIS (the ISGRI layer) and JEM-X in this
paper. Among the INTEGRAL instruments, IBIS has the
largest field of view and, therefore, the highest probability of observing
the source. We used a total of 554 available public pointings with
GX 301-2 within the IBIS half-coded field of view for the
pulse period determination (i.e. for Table 1). These data
include a long observation that covers ![]() 60% of the orbital cycle and
is long enough to allow binary ephemeris estimation (283 pointings in
INTEGRAL revolutions 322-330). Three dedicated observations (see
Table 2) were also performed during the pre-periastron flare
and were used to study the spectrum of the source.
60% of the orbital cycle and
is long enough to allow binary ephemeris estimation (283 pointings in
INTEGRAL revolutions 322-330). Three dedicated observations (see
Table 2) were also performed during the pre-periastron flare
and were used to study the spectrum of the source.
We also used results provided by the ASM/RXTE teams at MIT and at the RXTE SOF and GOF at NASA's GSFC and CGRO BATSE pulsar DISCLA histories data by Bildsten et al. (1997) to study the long-term evolution of the spin period.
3 Observational results
3.1 Timing analysis
To derive the intrinsic pulse period of the source, the lightcurve must be
corrected for Doppler delays due to the orbital motion of the source and
the satellite. Phase connection or pulse time arrival analysis is a precise
timing technique, based on measuring arrival times of individual pulses or
groups of pulses (Staubert et al. 2009). It allows to determine the Doppler
delays and therefore the orbital parameters of the system. A fixed phase of
the pulsating flux from a pulsar is observed at times
(Nagase et al. 1982):
referred to as Time Of Arrival (TOA), where P0,
Using archival ISGRI observations and the standard OSA 6.1 software provided by ISDC![]() , we
constructed lightcurves with 20 s time bins in the energy range
20-40 keV and determined the pulse arrival times (each pulse profile
obtained by folding
, we
constructed lightcurves with 20 s time bins in the energy range
20-40 keV and determined the pulse arrival times (each pulse profile
obtained by folding ![]() 20 individual pulses) for data from revolutions 322-330 using a technique similar to the one by Koh et al. (1997). This
is the only INTEGRAL observation to cover a significant fraction
of the orbital cycle, and it allows estimation of binary parameters. We
then used Eq. (1) to determine P,
20 individual pulses) for data from revolutions 322-330 using a technique similar to the one by Koh et al. (1997). This
is the only INTEGRAL observation to cover a significant fraction
of the orbital cycle, and it allows estimation of binary parameters. We
then used Eq. (1) to determine P, ![]() and
and
![]() .
The other orbital parameters were fixed to values reported
by Koh et al. (1997). Our best-fit values are
.
The other orbital parameters were fixed to values reported
by Koh et al. (1997). Our best-fit values are
![]() ,
,
![]() at the epoch 53523.8, and
at the epoch 53523.8, and
![]() MJD. All
uncertainties are at
MJD. All
uncertainties are at ![]() confidence level unless otherwise stated.
Pulse delays from the orbital motion and residuals of the best-fit are
plotted in Fig. 1.
Comparing our
confidence level unless otherwise stated.
Pulse delays from the orbital motion and residuals of the best-fit are
plotted in Fig. 1.
Comparing our
![]() value with the historical values reported by
White & Swank (1984), Sato et al. (1986) and Koh et al. (1997) allows estimation of the orbital period. Inclusion of our measurement requires introducing of a secular change to
the orbital period. The quality of the fit improves
significantly
value with the historical values reported by
White & Swank (1984), Sato et al. (1986) and Koh et al. (1997) allows estimation of the orbital period. Inclusion of our measurement requires introducing of a secular change to
the orbital period. The quality of the fit improves
significantly![]() . The residuals to fit both with and without
inclusion of a secular change are plotted in Fig. 2. Our
best fit values are
. The residuals to fit both with and without
inclusion of a secular change are plotted in Fig. 2. Our
best fit values are
![]() d and
d and
![]() at the reference time reported by Sato et al. (1986):
at the reference time reported by Sato et al. (1986):
![]() .
This estimate is consistent with the
direct measurements of the orbital period both by Sato et al. (1986) and
by Koh et al. (1997).
.
This estimate is consistent with the
direct measurements of the orbital period both by Sato et al. (1986) and
by Koh et al. (1997).
![\begin{figure}
\par\includegraphics[width=8.5cm,clip]{12951fg0.eps}
\vspace*{1.5mm}
\end{figure}](/articles/aa/full_html/2010/07/aa12951-09/img49.png)
|
Figure 1: Time delays of pulse arrival times induced by the orbital motion. Changes due to the intrinsic variation of the spin period are subtracted. best-fit residuals are also shown. The best-fit periastron passage time is marked with a vertical line. The folded RXTE ASM orbital profile with the pre-periastron flare is plotted in gray. |
| Open with DEXTER | |
![\begin{figure}
\par\includegraphics[width=8cm,clip]{12951fg1.eps}
\vspace*{1.5mm}
\end{figure}](/articles/aa/full_html/2010/07/aa12951-09/img50.png)
|
Figure 2: Residuals to fit over periastron passage times for orbital period with (circles) and without (triangles) inclusion of the orbital period derivative. |
| Open with DEXTER | |
It should be emphasized that the commonly used value of
![]() d by Koh et al. (1997) was obtained by
comparison of the
d by Koh et al. (1997) was obtained by
comparison of the
![]() values as well (the authors compared
their value to that by Sato et al. (1986) under the assumption of a
constant orbital period). On the other hand, all published measurements
including ours are consistently described when an orbital period derivative
is included. For the time of the INTEGRAL observation, the
predicted orbital period is
values as well (the authors compared
their value to that by Sato et al. (1986) under the assumption of a
constant orbital period). On the other hand, all published measurements
including ours are consistently described when an orbital period derivative
is included. For the time of the INTEGRAL observation, the
predicted orbital period is ![]() 41.472 d. The periastron passage
time measured with the orbital period value fixed to this prediction does
not change significantly:
41.472 d. The periastron passage
time measured with the orbital period value fixed to this prediction does
not change significantly:
![]() MJD.
MJD.
Because the pre-periastron flare in the orbital lightcurve of the source is
associated with the periastron passage time, an additional check can be
made using the long-term lightcurve of the source. We split a 10-year long
RXTE ASM barycentered daily lightcurve of GX 301-2 (all
bands combined) into parts of ![]() 5 orbital cycles in length and folded
each part with the orbital period
5 orbital cycles in length and folded
each part with the orbital period
![]() d to obtain a
series of orbital profiles. The relative phase shifts and the associated
orbital periods were then determined in the same way as for the pulse
period. The best-fit value for a constant period is
d to obtain a
series of orbital profiles. The relative phase shifts and the associated
orbital periods were then determined in the same way as for the pulse
period. The best-fit value for a constant period is
![]() d. The mean value of the orbital period,
calculated using
d. The mean value of the orbital period,
calculated using
![]() and
and
![]() obtained
above, is consistent with the observed value at the time of the
ASM observations, although an orbital period derivative is not
formally required by the ASM data alone.
obtained
above, is consistent with the observed value at the time of the
ASM observations, although an orbital period derivative is not
formally required by the ASM data alone.
A set of pulse period measurements with epoch folding was performed with
the updated ephemeris. We grouped all available INTEGRAL data by
the observation time by the ``k-means'' clustering algorithm (MacQueen 1967). The number of groups was chosen such
that the mean number of X-ray pulses within one group was ![]() 50. We
searched for pulsations in each of the groups with epoch
folding (Larsson 1996). A few groups where no pulsations were
found because of insufficient statistics were rejected afterwards. The
results are listed in Table 1 and plotted in
Fig. 3 together with historical values for clarity. On
average, GX 301-2 continues to spindown after the first
INTEGRAL observation of the source.
50. We
searched for pulsations in each of the groups with epoch
folding (Larsson 1996). A few groups where no pulsations were
found because of insufficient statistics were rejected afterwards. The
results are listed in Table 1 and plotted in
Fig. 3 together with historical values for clarity. On
average, GX 301-2 continues to spindown after the first
INTEGRAL observation of the source.
![\begin{figure}
\par\includegraphics[width=8.5cm,clip]{12951fg2.eps}\vspace*{1.5mm}
\end{figure}](/articles/aa/full_html/2010/07/aa12951-09/img56.png)
|
Figure 3: Long-term pulse period evolution of GX 301-2. |
| Open with DEXTER | |
3.2 Spectral analysis
The observations listed in Table 2 were used to obtain the broadband spectrum of the source. Since all three observations were made at almost the same orbital phase, we combined all data to have better statistics. We used the standard OSA 6.1 pipeline for spectral extraction. A systematic error of 1% for all ISGRI and of 2% for all JEM-X spectra was assigned as suggested in the OSA documentation.
Spectra of X-ray pulsars are usually described with phenomenological
multi-component models. The continuum of GX 301-2 was been modeled
with a cut-off power law modified at low energy by photoelectric
absorption. An iron emission ![]() line was been also observed. In
fact, there is a complex of iron lines at
line was been also observed. In
fact, there is a complex of iron lines at
![]() 6.4
6.4 ![]() 7.1 keV (Watanabe et al. 2003; La Barbera et al. 2005) in the
spectrum of GX 301-2. These are not resolved with JEM-X.
We therefore used a simple Gaussian-shaped profile with larger width to
formally describe this feature.
7.1 keV (Watanabe et al. 2003; La Barbera et al. 2005) in the
spectrum of GX 301-2. These are not resolved with JEM-X.
We therefore used a simple Gaussian-shaped profile with larger width to
formally describe this feature.
The photoelectric absorption of the source's spectrum is strongly variable, and at least two absorption columns are identified. Part of the X-ray emission is thought to be strongly absorbed close to the neutron star, while all emission from this region is also subject to absorption in the overall stellar wind of the optical companion. A model describing this physical situation is the absorbed partial covering model (Kreykenbohm et al. 2004; La Barbera et al. 2005).
From a more physical point of view, the spectrum of an accreting pulsar is
believed to be mainly the result of a Comptonization processes of thermal
photons in the accretion column and in the neutron star atmosphere. The
emerging spectrum depends on the optical depth and generally has a
power-law shape, with a cut-off at an energy corresponding to the
temperature of the Comptonizing medium
(![]()
![]() ,
Sunyaev & Titarchuk 1980). Phenomenological models aim at
describing this shape regardless of the optical depth. For
GX 301-2 two models have been used in literature.
La Barbera et al. (2005) adopted a modified ``high energy'' cut-off,
while Kreykenbohm et al. (2004) used a so-called Fermi-Dirac cut-off. As
discussed in Doroshenko et al. (2008), both models describe the INTEGRAL data
well with parameters close to the published ones. It is somewhat difficult,
however, to interpret these results from a physical point of view. We
therefore focus here on a different description.
,
Sunyaev & Titarchuk 1980). Phenomenological models aim at
describing this shape regardless of the optical depth. For
GX 301-2 two models have been used in literature.
La Barbera et al. (2005) adopted a modified ``high energy'' cut-off,
while Kreykenbohm et al. (2004) used a so-called Fermi-Dirac cut-off. As
discussed in Doroshenko et al. (2008), both models describe the INTEGRAL data
well with parameters close to the published ones. It is somewhat difficult,
however, to interpret these results from a physical point of view. We
therefore focus here on a different description.
One of the first physical models to describe Comptonization spectra was
proposed by Sunyaev & Titarchuk (1980). Compton scattering in strong magnetic
field is a more complicated
problem (Meszaros & Nagel 1985; Lyubarsky 1986), but for the saturated
case (
![]() )
a blackbody-like spectrum is formed in both
cases (Lyubarsky 1986). The Sunyaev & Titarchuk (1980)
model is included in the standard XSPEC distribution as
COMPST. Free parameters include the electron temperature of the
medium
)
a blackbody-like spectrum is formed in both
cases (Lyubarsky 1986). The Sunyaev & Titarchuk (1980)
model is included in the standard XSPEC distribution as
COMPST. Free parameters include the electron temperature of the
medium ![]() ,
optical depth
,
optical depth
![]() ,
and normalization
,
and normalization
![]() .
We used
this model because it contains the least number of free parameters and
produces identical results to more complex models for GX 301-2.
The pulse-phase averaged spectrum was extracted and fitted with the
partially absorbed COMPST model. The fit results are listed in
Table 3. Since the optical depth of the Comptonizing medium
is very high, we verified that a simple black body model provides an
equally good description of the data. The unabsorbed source flux in the
same energy range is
.
We used
this model because it contains the least number of free parameters and
produces identical results to more complex models for GX 301-2.
The pulse-phase averaged spectrum was extracted and fitted with the
partially absorbed COMPST model. The fit results are listed in
Table 3. Since the optical depth of the Comptonizing medium
is very high, we verified that a simple black body model provides an
equally good description of the data. The unabsorbed source flux in the
same energy range is ![]()
![]() erg cm-2 s-1 in both models.
erg cm-2 s-1 in both models.
A CRSF was necessary in the fit. This was included assuming a Gaussian-shaped profile. With the inclusion of the line the
![]() dropped from
dropped from ![]() 3.8 (depending on the model) to values around 1.2 (see
Table 3).
3.8 (depending on the model) to values around 1.2 (see
Table 3).
Table 3: Fit results for phase averaged spectra. Uncertainties are expressed at 90% confidence level.
4 Discussion
4.1 Orbital period evolution
Our estimate of the rate of orbital period decay
![]() exceeds that of other known sources at least by one order of magnitude.
Previous detections include Cen X-3
(
exceeds that of other known sources at least by one order of magnitude.
Previous detections include Cen X-3
(
![]() (Bagot 1996, and references therein), SMC X-1
(
(Bagot 1996, and references therein), SMC X-1
(
![]() )
and Her X-1 with
)
and Her X-1 with
![]() (Staubert et al. 2009).
GX 301-2 is very different from all these systems. It is younger
and has a highly eccentric orbit, while other systems have almost
circular orbits. Both real and apparent changes in the orbital period
are expected to be greater for an eccentric orbit.
(Staubert et al. 2009).
GX 301-2 is very different from all these systems. It is younger
and has a highly eccentric orbit, while other systems have almost
circular orbits. Both real and apparent changes in the orbital period
are expected to be greater for an eccentric orbit.
We measured the rate of decay of the orbit by comparing the times of
several periastron-passages. Those are determined by fitting the observed
pulse delays as a function of orbital phase, and they may in principle be
correlated with other model parameters, particularly with the longitude of
periastron due to apsidal motion. The span of our data used for the pulse
time arrival analysis does not allow both
![]() and
and ![]() to be
reliably constrained simultaneously. All published estimates of
to be
reliably constrained simultaneously. All published estimates of ![]() are
also consistent with each other within uncertainties, but still we
cannot rule out that apsidal motion contributes to the observed
apparent change in the orbital period.
are
also consistent with each other within uncertainties, but still we
cannot rule out that apsidal motion contributes to the observed
apparent change in the orbital period.
![\begin{figure}
\par\includegraphics[width=8.2cm,clip]{12951fg3.eps}
\end{figure}](/articles/aa/full_html/2010/07/aa12951-09/img97.png)
|
Figure 4:
Unfolded spectrum and residuals for the COMPST model without (dotted line and second panel) and with the inclusion (solid line and bottom panel) of a CRSF at |
| Open with DEXTER | |
The eccentric orbit and very strong mass transfer in the system (the mass
loss by the optical component is
![]() ,
Kaper et al. 2006) suggest that some intrinsic changes in the orbital period are also expected.
,
Kaper et al. 2006) suggest that some intrinsic changes in the orbital period are also expected.
The optical companion is much heavier than the neutron star and contributes almost nothing to the orbital angular momentum of the system. Direct mass loss via the stellar wind by the optical companion therefore does not lead to significant loss of the angular momentum. The optical star becomes less massive, leading to a longer orbital period (Hilditch 2001), which is the opposite of what is observed, although the rate of such change is very low.
To explain the decrease in the orbital period, one has to assume that the material carrying the angular momentum away must come from the vicinity of the neutron star, since it is the neutron star's orbital motion that represents the bulk of the angular momentum in the system. We can see two mechanisms that could be responsible for the loss of angular momentum. First, material of the stellar wind that is streaming by the neutron star feels the gravitational pull of the moving neutron star. Only a fraction of this material is eventually accreted onto the neutron star, and the larger part is leaving the binary system and carrying some angular momentum away, since the interaction with the neutron star changed its trajectory. Second, before the matter is accreted onto the neutron star, it interacts with the neutron star's magnetosphere (leading to spin-up and spin-down of the neutron star, as will be discussed below). However, the interaction with the magnetosphere may also lead to a magnetically driven outflow of material (Lovelace et al. 1999; Klochkov et al. 2009; Illarionov & Kompaneets 1990), again carrying angular momentum away. In addition, tidal coupling of the rotational frequency of the optical star with the orbital frequency could play some role, although estimates by Leahy & Kostka (2008) and Hilditch (2001) suggest that, despite the high eccentricity, this is probably not very efficient. The details of the mass transfer and angular momentum loss in this system are not understood well, and more observations are required to secure the rate of change in the orbital period.
4.2 Torque balance and magnetic moment of the neutron star
The evolution of the spin frequency of the neutron star gives insight
into the interaction of the accretion flow with the neutron star. The
rotational dynamics is determined by the equation
|
(2) |
where K+ and K- are the acceleration and deceleration torques, where
Two rapid spin-up episodes observed by Koh et al. (1997) indicate that a long lived accretion disk may sometimes form in GX 301-2. Both episodes are characterized by an increased source flux, which implies an increased accretion rate. The infrequent occurrence of such episodes argues against the hypothesis that they are triggered by tidal overflows at periastron (see Layton et al. 1998) and suggests that mass loss episodes of Wray 977 may be responsible for them (Koh et al. 1997). As concluded by Koh et al. (1997), the pulse period decrease in 1984-1992 can be attributed entirely to similar spin-up episodes, while most of the time the neutron star accretes from the wind, and no net change of the pulse period is observed. It is therefore important to understand the torque balance in this case. This is why we focus on wind-accretion models.
In the case of quasi-spherical accretion from a stellar wind the
accelerating torque can be expressed as (Davies et al. 1979)
where

|
(4) |
where B is the field strength, R,M are the neutron star radius and mass, and
There are several models for the deceleration torque. According
to Davies et al. (1979) and Bisnovatyi-Kogan (1991), an
asymmetric magnetosphere of the accreting pulsar produces turbulent
viscosity in the nearby wind, which brakes the neutron star:

where
|
(6) |
Instead, Illarionov & Kompaneets (1990) explain the spin down as a result of the efficient angular momentum transfer from the rotating magnetosphere of the accreting star to an outflowing stream of magnetized matter. This outflow is said to be a result of the heating of the accreting matter by hard X-ray emission from the pulsar through Compton scattering. The outflow is focused within a certain solid angle owing the anisotropy of the pulsar emission. It has a lower density than the surrounding accreting matter due to the higher temperature, thus it is driven out by the buoyancy force. Angular momentum gain from the accreting gas is balanced by angular momentum loss via the outflow, enabling a spin-down of the neutron star under certain circumstances. In this model,
where
The torque balance, hence the rotational frequency derivative, depends on
![]() ,
so one has to investigate this dependence to study the
rotational dynamics. Since the longest continuous pulse frequency
monitoring campaign (
,
so one has to investigate this dependence to study the
rotational dynamics. Since the longest continuous pulse frequency
monitoring campaign (![]() 10 yr) for this source was carried out
with BATSE (Bildsten et al. 1997), we used the data products available
at the
CGRO mission web-page
10 yr) for this source was carried out
with BATSE (Bildsten et al. 1997), we used the data products available
at the
CGRO mission web-page![]() .
The pulse frequency and pulse frequency derivative histories are provided
for the entire BATSE lifetime. Both were determined for a set of
.
The pulse frequency and pulse frequency derivative histories are provided
for the entire BATSE lifetime. Both were determined for a set of
![]() 4 d intervals using the phase connection technique assuming the
ephemeris by Koh et al. (1997) for binary-motion corrections
(see Bildsten et al. 1997; Koh et al. 1997 for details). The
corresponding BATSE pulsed flux in the 20-50 keV energy range,
averaged over the interval is also provided.
4 d intervals using the phase connection technique assuming the
ephemeris by Koh et al. (1997) for binary-motion corrections
(see Bildsten et al. 1997; Koh et al. 1997 for details). The
corresponding BATSE pulsed flux in the 20-50 keV energy range,
averaged over the interval is also provided.
Contrary to the report by Inam & Baykal (2000), a correlation between the
angular frequency derivative (
![]() )
and the flux
(see Fig. 5) was found (Pearson correlation coefficient 0.96, null hypotheses probability
)
and the flux
(see Fig. 5) was found (Pearson correlation coefficient 0.96, null hypotheses probability
![]() ).
).
The discrepancy between our findings and the ones reported in
Inam & Baykal (2000) lie in their method of estimating frequency
derivatives. With the BATSE data set that we used,
Inam & Baykal (2000) estimate pulse frequency derivatives by grouping the
provided frequency values in intervals of ![]() 30 d and averaging between
the left and right frequency derivatives calculated using these values for
each interval. This approach is incorrect because it assumes that the
frequency values provided by Koh et al. (1997) alone characterize the
average pulse frequency during the corresponding observation time, while
the average pulse frequency also depends on the frequency derivative
included in the fit and on the observation length. For this approach to
work it is required to remove the frequency derivative in the fit for the
pulse arrival times in the raw BATSE data, which was not done by
Inam & Baykal (2000). There is also a second point to question in their
analysis. To obtain values of the first derivative, Inam & Baykal (2000)
use frequency values on intervals of
30 d and averaging between
the left and right frequency derivatives calculated using these values for
each interval. This approach is incorrect because it assumes that the
frequency values provided by Koh et al. (1997) alone characterize the
average pulse frequency during the corresponding observation time, while
the average pulse frequency also depends on the frequency derivative
included in the fit and on the observation length. For this approach to
work it is required to remove the frequency derivative in the fit for the
pulse arrival times in the raw BATSE data, which was not done by
Inam & Baykal (2000). There is also a second point to question in their
analysis. To obtain values of the first derivative, Inam & Baykal (2000)
use frequency values on intervals of ![]() 30 d, comparable to the orbital
period of the system. Both the pulse frequency and the flux are known to
change on much shorter time scales in GX 301-2. Averaging on such a long
interval smoothes out most of the flux and pulse frequency variations,
making it difficult to find the correlation between the two quantities.
30 d, comparable to the orbital
period of the system. Both the pulse frequency and the flux are known to
change on much shorter time scales in GX 301-2. Averaging on such a long
interval smoothes out most of the flux and pulse frequency variations,
making it difficult to find the correlation between the two quantities.
On the other hand, we used
![]() and flux values directly measured
for each observation with phase connection. The points in
Fig. 5 were obtained by averaging provided frequency
derivative values of points with flux in a given range. The standard error
was used as an uncertainty estimate. We excluded both spin-up episodes
observed by Koh et al. (1997) (i.e. MJD 48440-48463 and
MJD 49230-49245) and intervals where pulsations were not detected
reliably (see Koh et al. 1997) from the further analysis.
and flux values directly measured
for each observation with phase connection. The points in
Fig. 5 were obtained by averaging provided frequency
derivative values of points with flux in a given range. The standard error
was used as an uncertainty estimate. We excluded both spin-up episodes
observed by Koh et al. (1997) (i.e. MJD 48440-48463 and
MJD 49230-49245) and intervals where pulsations were not detected
reliably (see Koh et al. 1997) from the further analysis.
To investigate the accretion models and compare them to the data, we need
to express the accretion rate as a function of the count rate, not a
trivial task. The conversion depends on the distance, radiative efficiency
of accretion, and beaming factor. We assumed that the mean source flux
derived from the spectra obtained with the INTEGRAL pointed
observations corresponds to the mean BATSE count-rate at the same
orbital phase. Then we assumed a conversion factor of
1037 erg s
![]() g s-1 which corresponds to the
radiative efficiency of accretion
g s-1 which corresponds to the
radiative efficiency of accretion ![]() 10%,
10%,
![]() )
to estimate the accretion rate. The
distance to the source is uncertain so the derived value should account for
the spread of the estimates (1.4-5.3 kpc). Apparently, K+, hence the torque balance, depends significantly on the efficiency of angular momentum transfer kw and on the relative velocity of the neutron star and the wind.
)
to estimate the accretion rate. The
distance to the source is uncertain so the derived value should account for
the spread of the estimates (1.4-5.3 kpc). Apparently, K+, hence the torque balance, depends significantly on the efficiency of angular momentum transfer kw and on the relative velocity of the neutron star and the wind.
The orbit of GX 301-2 is eccentric, so the orbital speed of the neutron
star changes significantly along the orbit. The wind, on the other hand, is
also accelerated from the sound speed at the surface of Wray 977
(![]() 10 km s-1) to a terminal velocity of 300-400 km s-1at infinity (Castor et al. 1975):
10 km s-1) to a terminal velocity of 300-400 km s-1at infinity (Castor et al. 1975):

|
(8) |
where v0 is the velocity at the surface of the star close to the sound speed,
|
(9) |
where
The absolute value of kw cannot be arbitrarily small, otherwise the
source will not be able to spin up, while this is clearly the case
when the flux exceeds a certain value. The value of kw can, therefore, be
estimated using the observed frequency derivative over accretion rate
dependence. We only measure flux, so the accretion rate and kw are
parametrized by the assumed distance. For each distance in the range of
published estimates from 1.4 to 5.3 kpc, we calculated the accretion rate
and estimated kw and B as free parameters of models defined by
Eqs. (3)-(7) where we assumed
![]() ,
R = 106 cm,
,
R = 106 cm,
![]() g cm2,
g cm2,
![]() km s-1, k = 2/3, and
km s-1, k = 2/3, and
![]() .
The estimated values
are presented in Fig. 7. The kw range is in line with
estimates obtained by Ho (1989) and with later claims that the
average amount of angular momentum transferred from the wind to the neutron
star is relatively small (Ruffert 1997; Ruffert et al. 1992). It is
likely that the mechanisms to generate the braking torques assumed in the
models may act simultaneously, so we attempted to find the magnetic field
required in this case by including both torques. The required field
strength, however, is not significantly reduced and still exceeds
1014 G (see Fig. 7).
.
The estimated values
are presented in Fig. 7. The kw range is in line with
estimates obtained by Ho (1989) and with later claims that the
average amount of angular momentum transferred from the wind to the neutron
star is relatively small (Ruffert 1997; Ruffert et al. 1992). It is
likely that the mechanisms to generate the braking torques assumed in the
models may act simultaneously, so we attempted to find the magnetic field
required in this case by including both torques. The required field
strength, however, is not significantly reduced and still exceeds
1014 G (see Fig. 7).
![\begin{figure}
\par\includegraphics[width=8.8cm,clip]{12951fg4.eps} \vspace*{3mm}
\end{figure}](/articles/aa/full_html/2010/07/aa12951-09/img127.png)
|
Figure 5: Angular frequency derivative correlation with flux. Flux is BATSE-pulsed flux in the 20-40 keV energy range. BATSE DISCLA data provided by Bildsten et al. (1997) on the GGRO mission page are used to obtain the plot. Example of fitting Illarionov & Kompaneets (1990) (solid black) and Davies et al. (1979); Davidson & Ostriker (1973); Bisnovatyi-Kogan (1991) (dashed red) models for an assumed distance of 3 kpc is plotted. Top axis shows the estimated accretion rate for this distance. The vertical line indicates the mean flux during the observation. Shaded area represents average relative velocity of the neutron star and wind for a given flux bin (right scale). |
| Open with DEXTER | |
It is important to emphasize that the frequency derivative and therefore
torque affecting the neutron star are consistent with zero for the average
source flux. This means that, for the average conditions during the
observations, the period is close to a so-called equilibrium period (i.e.
when the torques are balanced). This is also in line with the long-term
pulse period evolution (see Fig. 3). The knowledge of the
equilibrium period allows estimation of the magnetic field for the average
luminosity even without knowing the exact dependency of torque with
luminosity. For example, for the Davidson & Ostriker (1973),
Davies et al. (1979), Bisnovatyi-Kogan (1991) model in the case
of torque equivalence, the field strength may be expressed as
| B | 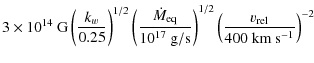
|
(10) | |
|
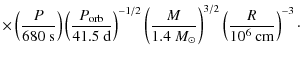
The equivalent equation for the Illarionov & Kompaneets (1990) model is
| B | 
|
(11) | |
|
Both values are in the same order of magnitude with estimates by Lipunov (1982). The strength of the magnetic field calculated under the assumption of an equilibrium period using the models for systems accreting from the persistent disk (Ghosh & Lamb 1979; Lovelace et al. 1999) is even stronger (
![\begin{figure}
\par\includegraphics[width=8.8cm,clip]{12951fg5.eps}
\end{figure}](/articles/aa/full_html/2010/07/aa12951-09/img133.png)
|
Figure 6:
Sketch of the GX 301-2 system.
The relative speed of the neutron star and wind, the orbital velocity of the
neutron star, and the intrinsic velocity of the wind close to the neutron
star are plotted as a function of the orbital phase. Velocities are
normalized to maximal relative velocity |
| Open with DEXTER | |
4.3 Implications of the strong magnetic field
As shown above, a very strong magnetic field is required to explain
the long pulse period of the GX 301-2. Other authors (Li & van den Heuvel 1999)
argue that a long-period pulsating source might be a relic of magnetar
evolutionary phase, when the field is strong enough to sufficiently spin
the neutron star down, and demonstrate the feasibility of this scenario for
2S 0114+650. However, this does not apply to GX 301-2, since the
source is in torque equilibrium and therefore the field has to be very
strong presently, unless there are some unidentified braking torques. The
observed CRSF energy, on the other hand, corresponds to a field of
![]() G, which contradicts our previous
conclusion.
G, which contradicts our previous
conclusion.
We suggest that it may be resolved if the line-forming region is situated
far above the neutron star's surface (i.e. in the accretion column). To
reconcile a surface field of ![]() 1014 G with the one derived from the
observed CRSF energy, one must assume that the CRSF is formed at height
1014 G with the one derived from the
observed CRSF energy, one must assume that the CRSF is formed at height
![]() (see Fig. 8).
(see Fig. 8).
The accretion column rises owing to the radiation pressure when the flux
from the hotspot on the neutron star surface becomes comparable to a
critical flux (local Eddington luminosity). The column height increases
with the accretion rate to allow the excess energy to radiate away from the
side surface. The observed color temperature 4-5 keV of the
GX 301-2 spectrum suggests that the accretion column is likely to
form in this source. Indeed, the effective critical temperature, which
corresponds to the critical flux, is
![]() keV for standard
neutron star parameters (
keV for standard
neutron star parameters (
![]() ,
R =106 cm) and solar
composition of the accreting matter. The observed spectrum is expected to
be close to the diluted Plank spectrum BE:
,
R =106 cm) and solar
composition of the accreting matter. The observed spectrum is expected to
be close to the diluted Plank spectrum BE:
![]() ,
with a color temperature
,
with a color temperature
![]() and a hardness factor
and a hardness factor
![]() -2 because of the Compton
scattering (Pavlov et al. 1991). This qualitative picture is similar in the
case of Compton scattering in the strong magnetic
field (Lyubarsky 1986), so the measured color temperature
probably corresponds to a critical effective temperature at the neutron
star surface (or at a certain height above the surface, but in this case
the temperature at the surface is expected to be even higher, so the
accretion column forms anyway).
-2 because of the Compton
scattering (Pavlov et al. 1991). This qualitative picture is similar in the
case of Compton scattering in the strong magnetic
field (Lyubarsky 1986), so the measured color temperature
probably corresponds to a critical effective temperature at the neutron
star surface (or at a certain height above the surface, but in this case
the temperature at the surface is expected to be even higher, so the
accretion column forms anyway).
It is possible to estimate the height of the accretion column, and it turns
out to be compatible with the requirement mentioned above:
![]() .
Indeed, the accretion column base radius can be
estimated from the neutron star magnetic moment
.
Indeed, the accretion column base radius can be
estimated from the neutron star magnetic moment
![]() (Lipunov 1987). The
magnetospheric radius is
(Lipunov 1987). The
magnetospheric radius is ![]()
![]() cm for a magnetic field
in the range
1012-1014 G. The corresponding radius of the column
base is 200-500 m. The accretion column height may then be
estimated using cylindrical geometry, and the critical effective temperature
from the observed luminosity
cm for a magnetic field
in the range
1012-1014 G. The corresponding radius of the column
base is 200-500 m. The accretion column height may then be
estimated using cylindrical geometry, and the critical effective temperature
from the observed luminosity
![]() erg s-1
erg s-1![]()
![]() .
This
simple estimate gives
.
This
simple estimate gives
![]() km (for
B = 1012-1014 G and
km (for
B = 1012-1014 G and
![]() g s-1). More elaborate calculations by
Basko & Sunyaev (1976), and Lyubarsky & Sunyaev (1988) give similar results (depending on the assumed accretion column geometry).
g s-1). More elaborate calculations by
Basko & Sunyaev (1976), and Lyubarsky & Sunyaev (1988) give similar results (depending on the assumed accretion column geometry).
![\begin{figure}
\par\includegraphics[width=8.5cm,clip]{12951fg6.eps}
\vspace*{3mm}
\end{figure}](/articles/aa/full_html/2010/07/aa12951-09/img148.png)
|
Figure 7: Results of fitting frequency derivative - flux correlation (see Fig. 5) with Illarionov & Kompaneets (1990) (solid), Davidson & Ostriker (1973), Davies et al. (1979), Bisnovatyi-Kogan (1991) (dashed) and a model with both braking torques in place (dotted) depending on assumed distance, hence mean accretion rate. The required magnetic field strength B ( bottom panel) depends on the efficiency of angular momentum transfer kw ( top panel), which is constrained by the fit. |
| Open with DEXTER | |
As shown by Basko & Sunyaev (1976, see Fig. 4 and accompanying discussion#, the amount of energy released by a unit of height of the accretion column is almost constant, so a significant part of emission comes from the outer parts of it. The contribution of the outer parts is especially important because the inner parts of the column are more easily obscured by the neutron star. It is natural to assume that X-ray emission and cyclotron line formation regions coincide, so the whole column contributes to the formation of the CRSF. The magnetic field strength and the other physical properties depend on height, so a mix of cyclotron lines coming from regions with different physical properties are observed (Nishimura 2008). The contribution of the outer parts of the column to the cyclotron line formation is especially important because the field there is weaker, so the line is observed at lower energies, which makes it easier to detect.
The formation of the pulse profile and the spectrum of a tall accretion column has not yet been understood and is beyond the scope of this work, although some characteristic features may be reckoned. The color temperature in the column increases towards the neutron star surface. The inner and hotter parts of the column are more likely to be obscured by the neutron star, so the pulse fraction increases with temperature (hence energy). For certain pulse phases, the inner parts of the column are obscured by the neutron star, and we can see only the outer, relatively cool parts, while a larger part of the column is seen at other phases. The pulse fraction is also expected to decrease with the increase in the column height and therefore with the source luminosity, which is indeed the case for GX 301-2 (Lutovinov & Tsygankov 2009).
![\begin{figure}
\par\includegraphics[width=8.5cm,clip]{12951fg7.eps}\vspace*{2mm}\vspace*{3mm}
\end{figure}](/articles/aa/full_html/2010/07/aa12951-09/img149.png)
|
Figure 8: Sketch of a radiation-dominated accretion column. Temperature and magnetic field strength increase towards the neutron star surface. |
| Open with DEXTER | |
The magnetic field strength increases towards the neutron star, so one can expect the centroid energy of the CRSF to be anti-correlated with total column height (hence luminosity) and correlated with the effective color temperature (or the cutoff energy, which is believed to be proportional to temperature). The latter is indeed the case for GX 301-2, as reported by Kreykenbohm et al. (2004, see Table 3#, while the correlation of the line energy with the luminosity is not confirmed because the cyclotron line was never detected outside of the pre-periastron flare.
When the vertical span of the observed part of the column is short, the line width is also expected to be smaller. In contrast, the line becomes wider when a larger part of the column is observed as the magnetic field increases by an order of magnitude from the column top to the bottom. This could explain the ``line width - line energy'' correlation reported by Kreykenbohm et al. (2004) for GX 301-2 and also by Coburn et al. (2002) for several other sources. As was concluded by Coburn et al. (2002), the observed correlation is independent of the spectral model used and is not affected by selection effects. It can therefore be considered as an intrinsic correlation between CRSF parameters. The proposed scenario with a tall accretion column explains it and complements the explanation of this correlation by Coburn et al. (2002), who attribute it to a change in the viewing angle with respect to the magnetic field (see also Meszaros 1992).
The cyclotron line formation in a tall column with temperature gradient was
investigated in detail by Nishimura (2008) with similar
conclusions. He considered a surface field of ![]() 1012 G and about
an order of magnitude less at the top of the accretion column. Both the
height of the column and the range of the physical parameters within it are
expected to be greater for a stronger surface field, but the results should
be similar. Detailed modeling of the accretion column which accounts for
light-bending and beaming is, however, required to clarify the expected
shape, and pulse-phase dependence of the spectrum. The pulse profile shape
and phase dependence of the spectrum in GX 301-2 (Kreykenbohm et al. 2004) is similar to other luminous
slow-pulsating sources like Vela X-1 (Heindl et al. 2004) and
4U 1538-52 (Robba et al. 2001). Common spectral features include a
correlation of CRSF energy with the width and with the cutoff energy
(which characterizes the continuum temperature) in phase-resolved spectra,
so the discussion above may also be relevant for these objects.
1012 G and about
an order of magnitude less at the top of the accretion column. Both the
height of the column and the range of the physical parameters within it are
expected to be greater for a stronger surface field, but the results should
be similar. Detailed modeling of the accretion column which accounts for
light-bending and beaming is, however, required to clarify the expected
shape, and pulse-phase dependence of the spectrum. The pulse profile shape
and phase dependence of the spectrum in GX 301-2 (Kreykenbohm et al. 2004) is similar to other luminous
slow-pulsating sources like Vela X-1 (Heindl et al. 2004) and
4U 1538-52 (Robba et al. 2001). Common spectral features include a
correlation of CRSF energy with the width and with the cutoff energy
(which characterizes the continuum temperature) in phase-resolved spectra,
so the discussion above may also be relevant for these objects.
It is worth noting that the mass of the optical counterpart is very high, so one can expect that the second supernova explosion in the system may take place before the magnetic field decays significantly. Such an explosion will most likely disrupt the system and leave an isolated neutron star with a magnetar-like magnetic field and the long pulse period. The observational appearance of such an object is unclear. The strong magnetic field might power a magnetar-like emission, however, known magnetars (i.e. soft gamma-repeaters and anomalous X-ray pulsars) have much shorter pulse periods.
5 Summary and conclusions
In this work we studied the timing and spectral properties of GX 301-2 using the archival data of INTEGRAL and data products of CGRO BATSE and RXTE ASM. An orbital-period's secular change was detected and the pulse period history since May 2005 determined. This shows a steady spin-down trend. The apparent rate of decay of the orbital period is about an order of magnitude higher than for other known sources. We argue that this is probably caused by angular momentum loss by material expelled from the vicinity of the neutron star to the outside world. However, we cannot at this time exclude some contribution from a possible apsidal motion to the observational appearance.
Results of our spectral analysis are consistent with previous works, although we find that the spectrum is described well not only with phenomenological models, but also with a saturated comptonization model.
We discussed a possible scenario to explain the long pulse period and
long spin-down trends observed despite steady accretion of matter and
angular momentum onto the neutron star. We studied the balance of the
torques affecting the neutron star using BATSE/DISCLA data by
Bildsten et al. (1997) and find that the rotational frequency
derivative is correlated with the flux. We also find that the frequency
derivative is zero for the average count rate, which is a signature that
the observed pulse period reflects torque equilibrium during the
observations' time span. The scenario invoked by Li & van den Heuvel (1999) to
explain the long period of 2S 0114+650 cannot therefore be applied
to GX 301-2 since the observed pulse period is close to equilibrium.
We investigated several published torque models to constrain the magnetic
field strength and found that all of them require the field to be
![]() 1014 G. The magnetic field strength derived from the observed
CRSF energy turns out to be
1014 G. The magnetic field strength derived from the observed
CRSF energy turns out to be ![]()
![]() G, i.e. at least an order
of magnitude less than from the timing. We argue that this can be
explained if the line-forming region resides high up in the accretion
column. We show that the accretion column as high as
G, i.e. at least an order
of magnitude less than from the timing. We argue that this can be
explained if the line-forming region resides high up in the accretion
column. We show that the accretion column as high as ![]() 25-30 km is
expected to form in GX 301-2 in the framework of
the Basko & Sunyaev (1976) model and that it is sufficient to reconcile the
very strong field at the surface with the observed cyclotron line energy.
Following the scenario proposed by Nishimura (2008), we conclude
that these correlations may be explained qualitatively by a simultaneous
change of height and vertical span of the observed region with pulse phase
if the line-forming region resides in a tall accretion column with a
temperature gradient. The quantitive description of the spectrum with a
model such as the one developed by Nishimura (2008) and detailed pulse profile formation modeling is, however, required to confirm this
scenario.
25-30 km is
expected to form in GX 301-2 in the framework of
the Basko & Sunyaev (1976) model and that it is sufficient to reconcile the
very strong field at the surface with the observed cyclotron line energy.
Following the scenario proposed by Nishimura (2008), we conclude
that these correlations may be explained qualitatively by a simultaneous
change of height and vertical span of the observed region with pulse phase
if the line-forming region resides in a tall accretion column with a
temperature gradient. The quantitive description of the spectrum with a
model such as the one developed by Nishimura (2008) and detailed pulse profile formation modeling is, however, required to confirm this
scenario.
An alternative scenario is that the long pulse period is explained by the presence of some unidentified braking torque, which is less dependent on magnetic field strength, and the CRSF pulse phase variability is attributed, as concluded by Kreykenbohm et al. (2004), to multipole field components.
We sincerely wish to thank N. Shakura, K. Postnov, and the anonymous referee for the useful comments and discussions, which helped to improve the paper. V.D., D.K., and C.F thank the DFG for financial support (grants DLR 50 OR 0702 and DLR 50 OG 0601). V.S. thanks the DFG for financial support (grant SFB/Transregio 7 ``Gravitational Wave Astronomy''), and for partial support the RBRF(grant 09-02-97013-p-povolzh'e-a). We also acknowledge the support of the International Space Science Institute (Bern). This research is based on observations with INTEGRAL, an ESA project with the instruments and science data center funded by ESA member states (especially the PI countries: Denmark, France, Germany, Italy, Switzerland, Spain), the Czech Republic, and Poland, with the participation of Russia and the USA.
References
- Bagot, P. 1996, A&A, 314, 576 [NASA ADS] [Google Scholar]
- Basko, M. M., & Sunyaev, R. A. 1976, MNRAS, 175, 395 [NASA ADS] [CrossRef] [Google Scholar]
- Bildsten, L., Chakrabarty, D., Chiu, J., et al. 1997, ApJS, 113, 367 [NASA ADS] [CrossRef] [Google Scholar]
- Bisnovatyi-Kogan, G. S. 1991, A&A, 245, 528 [NASA ADS] [Google Scholar]
- Castor, J. I., Abbott, D. C., & Klein, R. I. 1975, ApJ, 195, 157 [NASA ADS] [CrossRef] [Google Scholar]
- Coburn, W., Heindl, W. A., Rothschild, R. E., et al. 2002, ApJ, 580, 394 [NASA ADS] [CrossRef] [Google Scholar]
- Davidson, K., & Ostriker, J. P. 1973, ApJ, 179, 585 [NASA ADS] [CrossRef] [Google Scholar]
- Davies, R. E., Fabian, A. C., & Pringle, J. E. 1979, MNRAS, 186, 779 [NASA ADS] [CrossRef] [Google Scholar]
- de Kool, M., & Anzer, U. 1993, MNRAS, 262, 726 [NASA ADS] [Google Scholar]
- Doroshenko, V., Staubert, R., Kreykenbohm, I., Santangelo, A., & Ferrigno, C. 2008, in PoS(Integral08)115, 7th INTEGRAL Workshop [Google Scholar]
- Fryxell, B. A., & Taam, R. E. 1988, ApJ, 335, 862 [NASA ADS] [CrossRef] [Google Scholar]
- Ghosh, P., & Lamb, F. K. 1979, ApJ, 234, 296 [NASA ADS] [CrossRef] [Google Scholar]
- Heindl, W. A., Rothschild, R. E., Coburn, W., et al. 2004, in X-ray Timing 2003, 714, 323 [Google Scholar]
- Hilditch, R. W. 2001, An Introduction to Close Binary Stars, ed. R. W. Hilditch [Google Scholar]
- Ho, C. 1989, MNRAS, 236, 299 [NASA ADS] [Google Scholar]
- Illarionov, A. F., & Kompaneets, D. A. 1990, MNRAS, 247, 219 [NASA ADS] [Google Scholar]
- Inam, S. Ç., & Baykal, A. 2000, A&A, 353, 617 [NASA ADS] [Google Scholar]
- Kaper, L., Lamers, H. J. G. L. M., Ruymaekers, E., van den Heuvel, E. P. J., & Zuidervijk, E. J. 1995, A&A, 300, 446 [NASA ADS] [Google Scholar]
- Kaper, L., van der Meer, A., & Najarro, F. 2006, A&A, 457, 595 [NASA ADS] [CrossRef] [EDP Sciences] [Google Scholar]
- Klochkov, D., Staubert, R., Postnov, K., Shakura, N., & Santangelo, A. 2009, A&A, 506, 1261 [NASA ADS] [CrossRef] [EDP Sciences] [Google Scholar]
- Koh, D. T., Bildsten, L., Chakrabarty, D., et al. 1997, ApJ, 479, 933 [NASA ADS] [CrossRef] [Google Scholar]
- Kreykenbohm, I., Wilms, J., Coburn, W., et al. 2004, A&A, 427, 975 [NASA ADS] [CrossRef] [EDP Sciences] [Google Scholar]
- La Barbera, A., Segreto, A., Santangelo, A., Kreykenbohm, I., & Orlandini, M. 2005, A&A, 438, 617 [NASA ADS] [CrossRef] [EDP Sciences] [Google Scholar]
- Larsson, S. 1996, A&AS, 117, 197 [Google Scholar]
- Layton, J. T., Blondin, J. M., Owen, M. P., et al. 1998, New Astron., 3, 111 [NASA ADS] [CrossRef] [Google Scholar]
- Leahy, D. A., & Kostka, M. 2008, MNRAS, 384, 747 [NASA ADS] [CrossRef] [Google Scholar]
- Li, X.-D., & van den Heuvel, E. P. J. 1999, ApJ, 513, L45 [NASA ADS] [CrossRef] [Google Scholar]
- Lipunov, V. M. 1982, AZh, 59, 888 [NASA ADS] [Google Scholar]
- Lipunov, V. M. 1987, The astrophysics of neutron stars [Google Scholar]
- Lipunov, V. M., Börner, G., & Wadhwa, R. S. 1992, Astrophysics of Neutron Stars, ed. V. M. Lipunov, G. Börner, & R. S. Wadhwa [Google Scholar]
- Lovelace, R. V. E., Romanova, M. M., & Bisnovatyi-Kogan, G. S. 1999, ApJ, 514, 368 [NASA ADS] [CrossRef] [Google Scholar]
- Lund, N., Budtz-Jørgensen, C., Westergaard, N. J., et al. 2003, A&A, 411, L231 [NASA ADS] [CrossRef] [EDP Sciences] [Google Scholar]
- Lutovinov, A. A., & Tsygankov, S. S. 2009, Astron. Lett., 35, 433 [NASA ADS] [CrossRef] [Google Scholar]
- Lyubarsky, Y. E. 1986, Astrophysics, 25, 577 [NASA ADS] [CrossRef] [Google Scholar]
- Lyubarsky, Y. E., & Sunyaev, R. A. 1988, Pis'ma Astron. Zh., 14, 920 [Google Scholar]
- MacQueen, J. 1967, in Proc.Berkeley Sympos. Math. Statist. [Google Scholar]
- Makishima, K., & Mihara, T. 1992, in Frontiers Science Series, Proceedings of the Yamada Conference XXVIII [Google Scholar]
- Meszaros, P. 1992, High-energy radiation from magnetized neutron stars, ed. P. Meszaros [Google Scholar]
- Meszaros, P., & Nagel, W. 1985, ApJ, 299, 138 [CrossRef] [Google Scholar]
- Nagase, F., Hayakawa, S., Kunieda, H., et al. 1982, ApJ, 263, 814 [NASA ADS] [CrossRef] [Google Scholar]
- Nishimura, O. 2008, ApJ, 672, 1127 [NASA ADS] [CrossRef] [Google Scholar]
- Orlandini, M., dal Fiume, D., Frontera, F., et al. 2000, Adv. Space Res., 25, 417 [NASA ADS] [CrossRef] [Google Scholar]
- Parkes, G. E., Culhane, J. L., Mason, K. O., et al. 1980, MNRAS, 191, 547 [NASA ADS] [CrossRef] [Google Scholar]
- Pavlov, G. G., Shibanov, I. A., & Zavlin, V. E. 1991, MNRAS, 253, 193 [NASA ADS] [CrossRef] [Google Scholar]
- Pravdo, S. H., & Ghosh, P. 2001, ApJ, 554, 383 [NASA ADS] [CrossRef] [Google Scholar]
- Robba, N. R., Burderi, L., Di Salvo, T., Iaria, R., & Cusumano, G. 2001, ApJ, 562, 950 [NASA ADS] [CrossRef] [Google Scholar]
- Ruffert, M. 1997, A&A, 317, 793 [NASA ADS] [Google Scholar]
- Ruffert, M., Arnett, D., & Shankar, A. 1992, in BAAS, 24, BAAS, 1258 [Google Scholar]
- Sato, N., Nagase, F., Kawai, N., et al. 1986, ApJ, 304, 241 [NASA ADS] [CrossRef] [Google Scholar]
- Shakura, N. I. 1975, Sov. Astron. Lett., 1, 223 [NASA ADS] [Google Scholar]
- Staubert, R., Klochkov, D., & Wilms, J. 2009, A&A, 500, 883 [NASA ADS] [CrossRef] [EDP Sciences] [Google Scholar]
- Sunyaev, R. A., & Titarchuk, L. G. 1980, A&A, 86, 121 [NASA ADS] [Google Scholar]
- Taam, R. E., & Fryxell, B. A. 1989, ApJ, 339, 297 [NASA ADS] [CrossRef] [Google Scholar]
- Ubertini, P., Lebrun, F., Di Cocco, G., et al. 2003, A&A, 411, L131 [NASA ADS] [CrossRef] [EDP Sciences] [Google Scholar]
- Vedrenne, G., Roques, J.-P., Schönfelder, V., et al. 2003, A&A, 411, L63 [NASA ADS] [CrossRef] [EDP Sciences] [Google Scholar]
- Watanabe, S., Sako, M., Ishida, M., et al. 2003, ApJ, 597, L37 [NASA ADS] [CrossRef] [Google Scholar]
- White, N. E., Mason, K. O., Huckle, H. E., Charles, P. A., & Sanford, P. W. 1976, ApJ, 209, L119 [NASA ADS] [CrossRef] [Google Scholar]
- White, N. E., & Swank, J. H. 1984, ApJ, 287, 856 [NASA ADS] [CrossRef] [Google Scholar]
Footnotes
- ...ISDC
![[*]](/icons/foot_motif.png)
- http://isdc.unige.ch
- ...
significantly
- The
 drops from 52 to 0.52 with an F-test
significance of
drops from 52 to 0.52 with an F-test
significance of  98%.
98%.
- ...web-page
- ftp://heasarc.gsfc.nasa.gov/compton/data/batse/pulsar/histories/DISCLA_histories/gx301m2_psr_hist.fits
All Tables
Table 1: Pulse period values obtained with archival INTEGRAL data.
Table 2: Pointed observations of GX 301-2 by INTEGRAL, with an updated ephemeris to calculate the orbital phase.
Table 3: Fit results for phase averaged spectra. Uncertainties are expressed at 90% confidence level.
All Figures
|
|
Figure 1: Time delays of pulse arrival times induced by the orbital motion. Changes due to the intrinsic variation of the spin period are subtracted. best-fit residuals are also shown. The best-fit periastron passage time is marked with a vertical line. The folded RXTE ASM orbital profile with the pre-periastron flare is plotted in gray. |
| Open with DEXTER | |
| In the text | |
|
|
Figure 2: Residuals to fit over periastron passage times for orbital period with (circles) and without (triangles) inclusion of the orbital period derivative. |
| Open with DEXTER | |
| In the text | |
|
|
Figure 3: Long-term pulse period evolution of GX 301-2. |
| Open with DEXTER | |
| In the text | |
|
|
Figure 4:
Unfolded spectrum and residuals for the COMPST model without (dotted line and second panel) and with the inclusion (solid line and bottom panel) of a CRSF at |
| Open with DEXTER | |
| In the text | |
|
|
Figure 5: Angular frequency derivative correlation with flux. Flux is BATSE-pulsed flux in the 20-40 keV energy range. BATSE DISCLA data provided by Bildsten et al. (1997) on the GGRO mission page are used to obtain the plot. Example of fitting Illarionov & Kompaneets (1990) (solid black) and Davies et al. (1979); Davidson & Ostriker (1973); Bisnovatyi-Kogan (1991) (dashed red) models for an assumed distance of 3 kpc is plotted. Top axis shows the estimated accretion rate for this distance. The vertical line indicates the mean flux during the observation. Shaded area represents average relative velocity of the neutron star and wind for a given flux bin (right scale). |
| Open with DEXTER | |
| In the text | |
|
|
Figure 6:
Sketch of the GX 301-2 system.
The relative speed of the neutron star and wind, the orbital velocity of the
neutron star, and the intrinsic velocity of the wind close to the neutron
star are plotted as a function of the orbital phase. Velocities are
normalized to maximal relative velocity |
| Open with DEXTER | |
| In the text | |
|
|
Figure 7: Results of fitting frequency derivative - flux correlation (see Fig. 5) with Illarionov & Kompaneets (1990) (solid), Davidson & Ostriker (1973), Davies et al. (1979), Bisnovatyi-Kogan (1991) (dashed) and a model with both braking torques in place (dotted) depending on assumed distance, hence mean accretion rate. The required magnetic field strength B ( bottom panel) depends on the efficiency of angular momentum transfer kw ( top panel), which is constrained by the fit. |
| Open with DEXTER | |
| In the text | |
|
|
Figure 8: Sketch of a radiation-dominated accretion column. Temperature and magnetic field strength increase towards the neutron star surface. |
| Open with DEXTER | |
| In the text | |
Copyright ESO 2010
Current usage metrics show cumulative count of Article Views (full-text article views including HTML views, PDF and ePub downloads, according to the available data) and Abstracts Views on Vision4Press platform.
Data correspond to usage on the plateform after 2015. The current usage metrics is available 48-96 hours after online publication and is updated daily on week days.
Initial download of the metrics may take a while.