| Issue |
A&A
Volume 514, May 2010
|
|
|---|---|---|
| Article Number | A83 | |
| Number of page(s) | 8 | |
| Section | Atomic, molecular, and nuclear data | |
| DOI | https://doi.org/10.1051/0004-6361/200913891 | |
| Published online | 26 May 2010 | |
Experimental studies of the dissociative recombination processes for the dimethyl ether ions CD3OCD2+ and (CD3)2OD+
M. Hamberg1 - F. Österdahl1 - R. D. Thomas1 - V. Zhaunerchyk1 - E. Vigren1 - M. Kaminska2 - M. af Ugglas1 - A. Källberg3 - A. Simonsson3 - A. Paál3 - M. Larsson1 - W. D. Geppert1
1 - Department of Physics, Stockholm University, Alba Nova, 106 91
Stockholm, Sweden
2 - Institute of Physics, Jan Kochanowski University, Swietokrzyska 15,
25406 Kielce, Poland
3 - Manne Siegbahn Laboratory, Frescativägen 26, 114 18 Stockholm,
Sweden
Received 16 December 2009 / Accepted 4 February 2010
Abstract
Aims. Determination of branching fractions, cross
sections and thermal rate coefficients for the dissociative
recombination of CD3OCD2+
(0-0.3 eV) and (CD3)2OD+
(0-0.2 eV) at the low relative kinetic energies encountered in
the interstellar medium.
Methods. The measurements were carried out using
merged electron and ion beams at the CRYRING storage ring, Stockholm,
Sweden.
Results. For (CD3)2OD+
we have
experimentally determined the branching fraction for ejection of a
single hydrogen atom in the DR process to be maximally 7% whereas 49%
of the reactions involve the break up of the COC chain into two heavy
fragments and 44% ruptures both C-O bonds. The DR of CD3OCD2+
is dominated by fragmentation of the COC chain into two heavy
fragments. The measured thermal rate constants and cross sections are
![]() cm3 s-1,
cm3 s-1,
![]() cm2
and
cm2
and ![]() cm3 s-1,
cm3 s-1,
![]() cm2
for CD3OCD2+
and (CD3)2OD+,
respectively.
cm2
for CD3OCD2+
and (CD3)2OD+,
respectively.
Key words: astrochemistry - molecular processes - plasmas - methods: laboratory - methods: numerical - ISM: molecules
1 Introduction
One of the most important questions in our understanding of the emergence of life in the universe is how complex molecules such as biomolecule precursors are formed from more simple species and from which degree of complexity planetary conditions are necessary.To date more than 150 molecules and about 20 molecular ions have been detected in the interstellar medium (astrochemistry.net 2009) including molecules with long carbon chains such as HC11N (Bell et al. 1997). Furthermore, laboratory studies of meteoritic material have revealed complex species such as amino acids (Botta 2005). The number of discovered molecules in space is steadily rising, which critically increases the complexity of the chemical models of dark clouds, hot cores and other astronomical objects. These molecules undergo various reactions, e.g. association, ionization, recombination, etc. A small change in the rate of one particular reaction may have a serious impact on the evolution of the environment and significantly change the outcome of a simulation. Therefore, the abundance of important species (e.g. biomolecule precursors) may turn out to be heavily over- or underestimated. Hence, accurate determination of rates and product distributions of astrophysically relevant reactions is a must. Dissociative recombination (DR) reactions have been found to play an especially pivotal role as the final step in the synthesis of many complex molecules in space.
DR is the process where a molecular ion recombines with an electron and the excited neutral molecule formed releases excitation energy by dissociating into neutral fragments. The phenomenon is one of the dominating ion processes in dark interstellar clouds (Thomas 2008; Boger & Sternberg 2006; Florescu-Mitchell & Mitchell 2006), the comae of comets (Haider & Bhardwaj 2005), and also plays an important role in aurorae (Peterson et al. 1994), aeronomical plasmas (Yee et al. 1989), lightning (Smirnova et al. 2002) as well as in man-made plasmas such as those in combustion processes and fusion reactors (Florescu-Mitchell & Mitchell 2006). DR is known to be very efficient at low temperatures and therefore the reaction rates involved have a significant impact on model calculations of interstellar chemistry. The heavy-ion storage ring CRYRING in Stockholm, Sweden is an appropriate tool for investigations of astrophysically relevant DR reactions and has proven successful in doing so for several years, see e.g. Thomas (2008); Al-Khalili et al. (1998); Neau et al. (2000); McCall et al. (2003); Larsson et al. (1995); Hamberg et al. (2005); Larsson et al. (1993); Geppert et al. (2005).
We have undertaken merged ion-electron beam studies into the DR of the fully deuterated isotopologues of the methoxymethyl cation (CD3OCD2+) and the deuteronated dimethyl ether cation ((CD3)2OD+). The unhydronated dimethyl ether (DME) is found in objects known to host complex chemistry such as hot cores and corinos (Cazaux et al. 2003; Sutton et al. 1995; Maret et al. 2004; Groner et al. 1998). On the other hand, it has neither been detected in cold molecular clouds (Peeters et al. 2006; Friberg et al. 1988) nor cometary comae (Crovisier et al. 2004). Both ions also play an important role in alkyl- and proton-transfer reactions between protonated alcohols and ethers (Karpas & Meot-Ner 1989). One example of such reactions is:
| (1) |
Karpas & Meot-Ner (1989) remark that the rate constants for such processes were found to be lower by factors of 10-100 compared with the usual rate constants of
The formation of DME in the interstellar medium has been a
subject of ongoing discussion for many years. Blake et al.
(1987) and Millar et al.
(1991)
argue that DME is most likely produced by synthesis from methyl
alcohol, in which the precursor molecule is first desorbed from dust
particles and then involved in the reaction sequence below to form
protonated DME:
| (2) | |||
| (3) |
DME is finally released by the DR process:
| (4) |
Although methyl formate and dimethyl ether were hitherto assumed to be formed from their protonated ions via DR, this pathway could be expected as having equally low branching fraction as in the case of protonated methanol (Geppert et al. 2006), where DR is dominated by three-body break-up channels and only 3% of the reactions leads to the unprotonated species (6% for the fully deuterated isotopologue). Such behaviour is not unique and has been observed in many H-rich ions, e.g. H3O+ and CH5+ (Semaniak et al. 1998; Jensen et al. 2000). However, Garrod & Herbst (2006) showed with model calculations that dimethyl ether can be produced in a large abundance during the protostellar switch-on phase even when assuming as low a fraction as 1.5% for the final reaction above (this is much less than the value of 50% used in the model of Peeters et al. 2006). The alternative formation route through
In this paper we present the results from experimental studies on the DR of the titular ions to shed light on the formation of dimethyl ether in the interstellar medium.
2 Experiment
The experiments were performed using CRYRING, a heavy ion storage ring at the Manne Siegbahn Laboratory in Stockholm, Sweden. CRYRING consists of twelve straight segments with bending magnets in between and has a circumference ofThe ions were produced from a gas mixture of fully deuterated
dimethyl
ether and pure deuterium using a JIMIS hollow-cathode ion source. They
were then accelerated to 40 keV energy from the source
platform
and mass selected by a bending magnet. After injection into the storage
ring the ions were accelerated further with a driven drift-tube system
until they reached the maximum energy ![]() 96/
96/
![]() meV (where
meV (where ![]() is the ion mass in amu) after about one second. Due to the low pressure
of
is the ion mass in amu) after about one second. Due to the low pressure
of ![]() 10-11 Torr
in the ring, rest-gas collisions are minimized and the ions can be
stored for several seconds.
10-11 Torr
in the ring, rest-gas collisions are minimized and the ions can be
stored for several seconds.
The electron cooler located in one of the straight sections
consists of
a beam of cold electrons (40 mm diameter with 2 meV
transversal energy spread). The electrons are produced by an electron
gun before they are bent in to overlap the ion beam for ![]() 85
cm, which is the actual DR interaction region. The neutral products
from the reaction are unaffected by the bending magnet and thus leave
the ring tangentially and can be detected by an ion-implanted silicon
detector (IID). In the electron cooler the ion translational energy
spread is slightly reduced since the ions experience a drag-force when
they travel faster/slower than the electrons. Practically, the
longitudinal electron cooling time for this ion in CRYRING is on the
order of minutes, and the transversal cooling time is ten times longer
due to the high mass to charge ratio of the ion. Therefore, the
translational cooling mechanism is in principle without effect. Cooling
of internal degrees of freedom (possibly created in the ion source)
proceeds in the electron cooler by electron-induced de-excitation
(super elastic collisions) for non IR-active modes and mostly naturally
through spontaneous photon emission (typically in a timescale
of 0.1-1 s) (Wolf et al.
2003)
for IR-active modes. Cooling is very important in order to mimic
interstellar conditions, since excited states may have different rate
constants than the ground state (Tom et al. 2009).
Due to lack of experimental time and limited beam lifetime, experiments
with different cooling/storage times were not undertaken.
85
cm, which is the actual DR interaction region. The neutral products
from the reaction are unaffected by the bending magnet and thus leave
the ring tangentially and can be detected by an ion-implanted silicon
detector (IID). In the electron cooler the ion translational energy
spread is slightly reduced since the ions experience a drag-force when
they travel faster/slower than the electrons. Practically, the
longitudinal electron cooling time for this ion in CRYRING is on the
order of minutes, and the transversal cooling time is ten times longer
due to the high mass to charge ratio of the ion. Therefore, the
translational cooling mechanism is in principle without effect. Cooling
of internal degrees of freedom (possibly created in the ion source)
proceeds in the electron cooler by electron-induced de-excitation
(super elastic collisions) for non IR-active modes and mostly naturally
through spontaneous photon emission (typically in a timescale
of 0.1-1 s) (Wolf et al.
2003)
for IR-active modes. Cooling is very important in order to mimic
interstellar conditions, since excited states may have different rate
constants than the ground state (Tom et al. 2009).
Due to lack of experimental time and limited beam lifetime, experiments
with different cooling/storage times were not undertaken.
2.1 Branching fractions measurement
The branching fractions for the different reaction channels
were
measured at a nominal collision energy of 0 eV, i.e., when the
electrons and ions travel at the same average velocity. The ion
implanted detector used for detecting the neutral DR fragments records
the kinetic energy which, since the ion velocity of the ring is
well-defined, is directly proportional to the mass of the fragments.
The response time of the detection system is much longer than the
difference in arrival times of the fragments and so individual
fragments are not identified and only one peak corresponding to the
energy of the unfragmented ion is seen in the kinetic energy spectrum.
To solve this issue, a transparent grid with a well-determined
transmission probability
![]() is inserted directly in front of the detector. In this case the signal
splits up into several peaks with energies corresponding to the masses
of the fragments. Due to very small charge to mass ratio of these ions
and the magnetic rigidity of the ring the maximum longitudinal energy
per amu is comparatively low. This heavily diminishes the resolution of
the recorded spectra since the IID has an ideal resolution limit of
is inserted directly in front of the detector. In this case the signal
splits up into several peaks with energies corresponding to the masses
of the fragments. Due to very small charge to mass ratio of these ions
and the magnetic rigidity of the ring the maximum longitudinal energy
per amu is comparatively low. This heavily diminishes the resolution of
the recorded spectra since the IID has an ideal resolution limit of ![]() 25 keV
(for MeV
25 keV
(for MeV ![]() -particles)
and the noise from the preamplifier also contributes to the final width
of the peaks. As a result it is difficult to distinguish between
fragments which differ in mass by 2 amu or less, e.g. one
deuterium atom. Hence we focused on determining the probability of
fragmentation of the bonds between the heavier atoms. The experiment
consisted of four parts:
-particles)
and the noise from the preamplifier also contributes to the final width
of the peaks. As a result it is difficult to distinguish between
fragments which differ in mass by 2 amu or less, e.g. one
deuterium atom. Hence we focused on determining the probability of
fragmentation of the bonds between the heavier atoms. The experiment
consisted of four parts:
- i)
- measurement of the fragment energy spectrum without the
grid and with the electron cooler tuned to
 0 eV;
0 eV;
- ii)
- a spectrum taken without the grid, with the electron cooler
tuned to
 eV.
At that energy the cross section is very small and the count rate is
dominated by background events.
eV.
At that energy the cross section is very small and the count rate is
dominated by background events.
- iii)
- a spectrum taken with the grid inserted in front of the
detector and the electron cooler tuned to 0 eV;
- iv)
- a spectrum with the grid inserted in front of the detector,
and the electron cooler tuned to
 eV.
Again the count rate is very low and consists dominantly of products
from rest gas collisions.
eV.
Again the count rate is very low and consists dominantly of products
from rest gas collisions.
![\begin{figure}
\par\includegraphics[width=9cm,clip]{13891fg1.eps}
\vspace*{2mm}
\end{figure}](/articles/aa/full_html/2010/06/aa13891-09/img17.png)
|
Figure 1: A fragment energy spectrum recorded for (CD3)2OD+ when the grid is not inserted. The large peak to the right is due to particles impacting at full beam energy. The two smaller peaks in the middle are due to losses because of fragments with high transverse energy that miss the detector. The sharp peak at the leftmost position is due to noise in the detector system. |
| Open with DEXTER | |
Subtracting the background spectra (after normalisation to the ion current in the different measurements) from that recorded at 0 eV yields the pure DR fragment energy distribution. As mentioned earlier, only one peak, corresponding to the sum of fragment kinetic energy, should be visible in the spectrum with the grid removed, see Fig. 1. Signals appearing at lower energies (masses) indicate that some of the fragments miss the detector due to a high kinetic energy release.
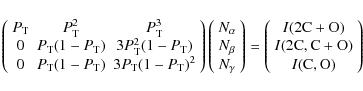
Fragment energy spectra with the grid inserted are obtained in
a similar way and the background-subtracted result is shown in
Fig. 2,
where the peaks correspond to fragments containing one (C or O plus
deuterium atoms), two (those with 2C or C+O plus deuterium atoms) or
three heavy atoms (2C+O plus deuterium atoms). To compute the branching
fractions from the peak intensities and the transmission probability, ![]() ,
the following matrix system was constructed:
,
the following matrix system was constructed:
![\begin{figure}
\par\includegraphics[width=9cm,clip]{13891fg2.eps} \vspace*{-2mm}
\end{figure}](/articles/aa/full_html/2010/06/aa13891-09/img20.png)
|
Figure 2: A fragment energy spectrum recorded for (CD3)2OD+ when the grid is inserted. The three major peaks are due to detection of fragments containing one, two or three heavy atoms, respectively. The sharp peak at the leftmost position is due to noise in the detector system mixed with signal from deuterium fragments. |
| Open with DEXTER | |
![\begin{figure}
\par\includegraphics[width=9cm,clip]{13891fg3.eps} \vspace*{-3mm}
\end{figure}](/articles/aa/full_html/2010/06/aa13891-09/img21.png)
|
Figure 3: Fragment energy spectrum recorded for CD3OCD2+ with the grid inserted. The three major peaks are due to detection of fragments containing one, two or three heavy atoms respectively. The sharp peak at the leftmost position is due to noise in the detector system mixed with signal from deuterium fragments and was not used in the branching fraction derivation. The second peak from the left stems from signal corresponding 4 amu mass (2D). |
| Open with DEXTER | |
where ![]() is the number of counts in each reaction channel,
is the number of counts in each reaction channel, ![]() (leading to zero, one and two bond breakages between heavy fragments,
respectively), and I
is the total number of counts in each peak. For example, each column in
the leftmost matrix corresponds to a reaction channel. In the middle
column
(leading to zero, one and two bond breakages between heavy fragments,
respectively), and I
is the total number of counts in each peak. For example, each column in
the leftmost matrix corresponds to a reaction channel. In the middle
column ![]() is the probability that both heavy products from reaction channel
is the probability that both heavy products from reaction channel ![]() pass through the grid and contribute to the full mass energy peak.
pass through the grid and contribute to the full mass energy peak. ![]() in the second and third rows corresponds to the probability that the
heavier products (containing C2
or CO) passes through the grid while the lighter products
(containing C or O) are stopped by the grid or vice versa. The
results of this matrix evaluation are displayed in Table 1 whereas
all the energetically plausible channels are found in Tables 2
and 3,
respectively.
in the second and third rows corresponds to the probability that the
heavier products (containing C2
or CO) passes through the grid while the lighter products
(containing C or O) are stopped by the grid or vice versa. The
results of this matrix evaluation are displayed in Table 1 whereas
all the energetically plausible channels are found in Tables 2
and 3,
respectively.
There exist losses from the DR of (CD3)2OD+,
illustrated in Fig. 1, as well
as for CD3OCD2+
due to neutral fragments missing the detector. The effect of these
losses on the branching fractions is well within the error bars for the
matrix system (see Table 1)
which have been assessed by varying the integrated area of each peak to
extreme values that were still to be considered reasonable and running
the matrix evaluation with these values. This was done in conjunction
with changing the grid transmission probability within its 3![]() confidence interval
confidence interval ![]() (Neau 2002).
(Neau 2002).
To determine upper limits for the losses, Monte Carlo
simulations were
performed. Assuming that all ions were in their rovibronic ground state
and that all the energy released in the DR reactions are transformed
into the kinetic energy of the fragments one can calculate the maximum
amount of losses for each reaction channel. For a two-body breakup
channel this can be solved analytically. For the three-body breakup
case a similar approach as Müller & Cosby
(1999), Thomas
(2008) and Zhaunerchyk (2008)
was used. For each reaction channel a large amount of DR events were
numerically simulated where the energy distribution as well as the
direction of the outgoing fragments are randomized (fulfilling energy
and momentum conservation laws). For both the two and three-body
breakup cases we extended the simulation to also include an estimated
ion beam width (FWHM = 6 mm, assuming
Gaussian beam profile) and an IID offset (![]() 5 mm).
We also assumed a synchronous breakup processes where all the reaction
products are emitted from the centre of mass at the same time.
5 mm).
We also assumed a synchronous breakup processes where all the reaction
products are emitted from the centre of mass at the same time.
The simulations of the losses indicates that the losses of heavy fragments seen in the spectrum taken with the grid out (see Fig. 1) should be from the DR processes splitting up the COC-chain into two parts (see Tables 2 and 3 respectively). A branching fraction matrix system including the effect of the detected losses from the spectra with the grid out (see Fig. 1) were set up.
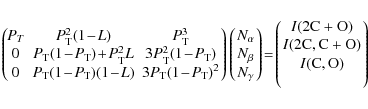
where L, is the loss factor. We have only taken into account losses of one heavy fragment in this system since the amount of losses of two heavy fragments are very small and would not change the outcome substantially. This system is solved iteratively by changing L until the outcome with
Table 1: Branching fraction results for (CD3)2OD+ and CD3OCD2+ respectivelya.
Table 2: Energetically open and plausible reaction channels for the DR of (CD3)2OD+ including those leading to D2 and 2Da.
Table 3: Energetically open and plausible reaction channels for the DR of CD3OCD2+a.
2.2 Cross sections and rate constant determination
In this part of the experiment the electron velocity in the electron
cooler was linearly ramped relative to the ion velocity during the
measurement cycle corresponding to a change in relative kinetic between
![]() 2-2000 meV.
The neutral products deriving from the DR reactions were detected with
the IID and counted with a multi channel scaler (MCS, divided into time
bins of 2 ms) in such a way that each time interval corresponded to a
certain relative kinetic energy. The absolute ion current was measured
using a capacitive pick up immediately after acceleration (Paal et al. 2006).
Neutral particles originating from collisions of the ions with residual
gas particles in the ring were counted by a micro channel plate (MCP)
detector at the end of a straight section in the ring. Since the
intensity of the signals from these background events is directly
proportional to the ion current these signals could be scaled to the
absolute ion current measurements and fitted by a decay curve to yield
the ion current in the ring throughout the whole measurement cycle.
This fit could also be used for background subtraction in the cross
section measurement. The rate coefficient could then be calculated as:
2-2000 meV.
The neutral products deriving from the DR reactions were detected with
the IID and counted with a multi channel scaler (MCS, divided into time
bins of 2 ms) in such a way that each time interval corresponded to a
certain relative kinetic energy. The absolute ion current was measured
using a capacitive pick up immediately after acceleration (Paal et al. 2006).
Neutral particles originating from collisions of the ions with residual
gas particles in the ring were counted by a micro channel plate (MCP)
detector at the end of a straight section in the ring. Since the
intensity of the signals from these background events is directly
proportional to the ion current these signals could be scaled to the
absolute ion current measurements and fitted by a decay curve to yield
the ion current in the ring throughout the whole measurement cycle.
This fit could also be used for background subtraction in the cross
section measurement. The rate coefficient could then be calculated as:
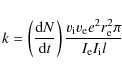
|
(7) |
where
- i)
- space charge effects: the electrons experience a drop in the acceleration potential at the gun due to other electrons ahead of them;
- ii)
- toroidal effects: interaction in the regions where the
electron beam is bent into and out from the interaction region
correspond to higher
 due to the extra transversal velocity components (Lampert
et al. 1996);
due to the extra transversal velocity components (Lampert
et al. 1996);
- iii)
- the rate constant calculated up to now is an averaged value due to the velocity spread amongst the electrons (i.e. 2 meV electron temperature). It can therefore be expressed as the equation below where the actual cross section is found by unfolding it using Fourier methods (Mowat et al. 1995).
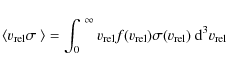
|
(8) |
where
![\begin{figure}
\par\includegraphics[width=9cm,clip]{13891fg4.eps}
\end{figure}](/articles/aa/full_html/2010/06/aa13891-09/img49.png)
|
Figure 4: Cross section evaluation of (CD3)2OD+. The triangles shows individually measured spots while the line shows the best fit between 1-200 meV. |
| Open with DEXTER | |

|
(9) |
where
3 Discussion
3.1 The structure of the ions
The (CD3)2OD+
ions were produced from DME and deuterium gas. Therefore, the most
likely resulting species should be the titular ion (
![]() kJ/mol)
since formation of the isomeric deuteronated ethanol (
kJ/mol)
since formation of the isomeric deuteronated ethanol (
![]() kJ/mol)
would imply heavy restructuring (enthalpy values from Lias et al. 1988).
Both isomers are stable and the isomerisation barrier is sufficiently
high that they can be considered separate species (Matthews &
Adams 1997). The schematic potential diagram by Jarrold
et al. (1986) clearly shows that the isomerisation
barrier is higher than the dissociation energy.
kJ/mol)
would imply heavy restructuring (enthalpy values from Lias et al. 1988).
Both isomers are stable and the isomerisation barrier is sufficiently
high that they can be considered separate species (Matthews &
Adams 1997). The schematic potential diagram by Jarrold
et al. (1986) clearly shows that the isomerisation
barrier is higher than the dissociation energy.
For C2H5O+ Fairley
et al. (1996) reported that the lowest energy isomer
is CH3CHOH+ and that CH3OCH2+
is the second lowest lying 73 kJ mol-1
above. Lias
et al. (1988) claim that this difference was
74 kJ mol-1
and that the isomer of protonated oxirane energetically lies in
between. In the current experiment, the ion is being created from CH3OCH3
(DME) and a substantial reorganization would be necessary to create the
ion with the lowest formation enthalpy from the parent substance.
Calculations reported by Fairley
et al. (1996) also show that there is an
isomerisation barrier from CH3OCH2+
to CH2OHCH2+
of 280 kJ mol-1.
Investigations by Jarrold
et al. (1986) indicated a slightly higher
isomerisation barrier and discovered that CH3OCH2+
ions with an internal energy close to the CH3+
+ CH2O
threshold (and hence less than necessary isomeric conversion energy)
would undergo rapid unimolecular dissociation to give mainly HCO+.
Therefore it could be concluded that excited ions with sufficient
internal energy would mainly undergo fragmentation rather than
isomerisation and no significant amounts of other ions than
![]() were present in the storage ring.
were present in the storage ring.
3.2 Implications of the branching fractions results for (CD3)2OD+
From the fragment energy spectrums of (CD3)2OD+
at ![]() 0 eV
nominal
0 eV
nominal ![]() (see Fig. 2)
it is concluded that channels leading to product masses of 6, 8, 10 and
12 amu (3D, 4D, 5D and C) are not observed which limit the exoergic
reaction channels to the ones found in Table 2
(energies calculated from Lias et al. 1988;
and NIST 2009).
(see Fig. 2)
it is concluded that channels leading to product masses of 6, 8, 10 and
12 amu (3D, 4D, 5D and C) are not observed which limit the exoergic
reaction channels to the ones found in Table 2
(energies calculated from Lias et al. 1988;
and NIST 2009).
The signal corresponding to a mass of 4 amu (2D or D2)
is close to zero and impossible to distinguish from noise. There are 13
exoergic competing reaction channels (one two-body breakup, eight
three-body breakups and four involving four body breakups) that could
contribute to the 2D signal. Assuming maximum losses and ignoring the
possibility of contribution from the tail of the D peak limit the
fraction for the sum of these channels to below ![]() 4%.
We therefore conclude that a considerable alteration of the branching
fractions of the reactions contributing to this mass cannot be totally
excluded but are not likely to severely alter the final result.
4%.
We therefore conclude that a considerable alteration of the branching
fractions of the reactions contributing to this mass cannot be totally
excluded but are not likely to severely alter the final result.
The only remaining exoergic channel retaining the COC bonds between the heavy atoms seem to be the one involving the ejection of a single deuterium atom. Hence, we conclude that the branching fraction of 7% obtained for conservation of all heavy atom bonds is in principle due solely to that reaction. This amount is larger than the value of 1.5% assumed by Garrod & Herbst (2006) but much less than the value of 50% used in the model of Peeters et al. (2006).
The overall branching fraction of reactions leading to
ejection of one
heavy fragment is 49%. There are exoergic reaction channels in which
this could occur, although some of these processes would imply
considerable rearrangement and they are therefore not deemed plausible.
It is assumed that the most important reaction contributing to this
fraction is the channel producing
![]() (methanol) and CD3.
(methanol) and CD3.
Finally, the branching fractions of processes leading to the rupture of both C-O bonds is 44%. Here the most exoergic channel is that leading to CD3 + D2O + CD2. Judging from the structure of the spectrum, the peak corresponding to 16 amu is rather small and channels producing CD2 should not be as important. Therefore the channel leading to CD3 + OD + CD3 seems to be the most likely candidate. A comparison with the D3O+ and CD3OD2+ ions (Jensen et al. 2000; Geppert et al. 2006) shows an interesting similarity: channels leading to three fragments are important in all three ions.
There is an effect of including the losses of one heavy fragment in the analysis, however it is not large and very well within the error bars. The recommended values are those from the analysis including the losses.
3.3 Implications of the branching fractions results for CD3OCD2+
From our resulting spectrum for CD3OCD2+ it is clear that we do not see any fragments with mass 6, 8, 10, 12 or 24 amu which excludes C from the list of possible products as well as channels leading to D2 + D, 3D, 2D2 and 2D2 + D. We are therefore limited to the reaction channels in Table 2, where the energies are calculated from Lias et al. 1988 and NIST 2009). The experiment yields 100% fragmentation of the COC chain into two heavy fragments (CO + C or C2 + O). We can therefore exclude this ion as a source for acetaldehyde but further investigations will have to show if that is also true for the isomeric form CD3CDOD+. The probability of having fragments containing 2C but no O should be significantly smaller than the probability of having resulting fragments containing CO, since the former would imply substantial restructuring of the molecule.
No effect is noticed when extending the analysis to include losses of heavy fragments.
3.4 Implications of rate constants
The thermal rate constants reported here lie at the higher end for DR
reaction rates which usually are around ![]() cm3 s-1
at 300 K. Nevertheless, larger ions have earlier been shown to
have thermal reaction rate coefficients of similar magnitude e.g. C3H7+
(Ehlerding
et al. 2003), DCCCND+ (Geppert
et al. 2004a), POCl+ (Zhaunerchyk
et al. 2008) and DOCO+ (Geppert
et al. 2004b).
cm3 s-1
at 300 K. Nevertheless, larger ions have earlier been shown to
have thermal reaction rate coefficients of similar magnitude e.g. C3H7+
(Ehlerding
et al. 2003), DCCCND+ (Geppert
et al. 2004a), POCl+ (Zhaunerchyk
et al. 2008) and DOCO+ (Geppert
et al. 2004b).
The change of slope appearing at ![]() 0.2 eV in Fig. 4
is likely to be due to the opening of different reaction channels
including ones leading to auto ionisation (if it was due to particle
losses from the beam it would not likely be so abrupt). The phenomenon
has been observed for several polyatomic ions see e.g. Jensen et al.
(1999); Vigren
et al. (2008); Zhaunerchyk (2008).
0.2 eV in Fig. 4
is likely to be due to the opening of different reaction channels
including ones leading to auto ionisation (if it was due to particle
losses from the beam it would not likely be so abrupt). The phenomenon
has been observed for several polyatomic ions see e.g. Jensen et al.
(1999); Vigren
et al. (2008); Zhaunerchyk (2008).
To the best of our knowledge other measurements of the titular
reactions have not yet been undertaken and we can therefore not compare
our results directly. For the isomeric form of CH3OCH2+,
CH3CHOH+ a FALP
measurement has earlier been performed yielding a rate constant of ![]() cm3 s-1
at 300 K with a 30% uncertainty (Geoghegan
et al. 1991). Since the authors produced their ions
by proton transfer from H3+
to acetaldehyde which therefore resulted in the different isomer the
difference in reaction rate coefficients should be adressed to the
structure (and possibly to a minor extent to isotopic effects see,
below).
cm3 s-1
at 300 K with a 30% uncertainty (Geoghegan
et al. 1991). Since the authors produced their ions
by proton transfer from H3+
to acetaldehyde which therefore resulted in the different isomer the
difference in reaction rate coefficients should be adressed to the
structure (and possibly to a minor extent to isotopic effects see,
below).
3.5 Isotopic effect
The measurements were made with the fully deuterated isotopologue of the ions with the aim of increasing the mass resolution to be able to distinguish peaks that differ by only one deuterium atom. Even with this substitution the resolution is just on the threshold of being insufficient for that purpose. The usage of fully deuterated species instead of their isotopologue is common practice and has been shown to lead in most cases to very similar branching ratios, see e.g. Neau et al. (2000); Jensen et al. (2000); Geppert et al. (2006). But exceptions exist (Larsson et al. 2005; Hamberg et al. 2007), which possibly are due to easier tunneling of hydrogen atoms through exit barriers.Table 4: Comparison with UMIST and Ohio State Chemical Network rate constants and their implied branching fractionsa.
3.6 Model implementation
The total reaction rate constant obtained for the (CD3)2OD+ ion are significantly higher than model values summed from viable reaction channels at Woodall et al. (2006); astrochemistry.net (2009), (see Table 4). The implied branching fractions from the models are further compared in Table 4 where the channel leading to CH3OCH3 + H clearly is less than the previous estimates whereas the the reactions leading to CH3OH + CH3 and CH3 + CH4 + O very well could be happening. No reaction leading to fragmentation of the COC-chain into three different particles is included in the UMIST model compared to 44% reported here.
For the CD3OCD2+ ion the total rate constant is higher than in the models (see Table 4). The reaction channels used by the models leading to CO + CH4 + H and H2CO + CH3 are found plausible whereas the CH3CHO + H and H2CCO + H2 + H product channels are not observed. The observed differences could partly be justified by the fact that the models are likely to treat different isomers as one.
Simulation with the new rates in astronomical regions should be undertaken.
4 Conclusion
The DR rate coefficients of the investigated ions are relatively high like it has been the case with other complex ions. For CD3OCD2+the DR exclusively lead to break up of the COC-chain into two fragments, one having one and the other having two heavy atoms. In the DR of deuteronated DME we have found the branching fraction channel leading to the undeuteronated species is only 7%. The impact on astrochemical models needs to be investigated.
AcknowledgementsWe thank the staff at the Manne Siegbahn Laboratory for making these experiments possible by excellent technical support. W.D.G. thanks the Swedish Research Council for his Senior Researcher grant (contract No. 2006-427) and the Swedish Space Board (grant No. 76/06).
References
- Al-Khalili, A., Danared, H., Larsson, M., et al. 1998, Hyperfine Interact., 114, 281 [NASA ADS] [CrossRef] [Google Scholar]
- Angelova, G., Novotny, O., Mitchell, J. B. A., et al. 2004, Int. J. Mass. Spectrom., 232, 195 [Google Scholar]
- astrochemistry.net. 2009, http://www.astrochemistry.net [Google Scholar]
- Bell, M. B., Feldman, P. A., Travers, M. J., et al. 1997, ApJ, 483, L61 [NASA ADS] [CrossRef] [Google Scholar]
- Blake, G. A., Sutton, E. C., Masson, C. R., & Philips, T. G. 1987, ApJ, 315, 621 [NASA ADS] [CrossRef] [Google Scholar]
- Boger, G. I., & Sternberg, A. 2006, ApJ, 645, 314 [NASA ADS] [CrossRef] [Google Scholar]
- Botta, O. 2005, Astrochemsitry: Recent Successes and Current Challenges Proceedings IAU Symp., 231, 479 [NASA ADS] [Google Scholar]
- Cazaux, S., Tielens, A. G. G. M., & Ceccarelli, C. 2003, ApJ, 593, L51 [NASA ADS] [CrossRef] [Google Scholar]
- Crovisier, J., Bockelée-Morvan, D., Biver, N., Despois, D., & Lis, D. C. 2004, A&A, 418, 1141 [NASA ADS] [CrossRef] [EDP Sciences] [Google Scholar]
- Ehlerding, A., Arnold, S. T., Viggiano, A. A., et al. 2003, J. Phys. Chem. A, 107, 2179 [CrossRef] [Google Scholar]
- Fairley, D. A., Scott, G. B. I., Freeman, C. G., Maclagan, R. G. A. R., & McEwan, M. J. 1996, J. Chem. Soc., Faraday Trans., 92, 1305 [Google Scholar]
- Florescu-Mitchell, A. I., & Mitchell, J. B. A. 2006, Phys. Rep., 430, 277 [NASA ADS] [CrossRef] [Google Scholar]
- Friberg, P., Madden, S., Hjalmarson, A., & Irvine, W. 1988, A&A, 195, 281 [Google Scholar]
- Garrod, R. T., & Herbst, E. 2006, A&A, 457, 927 [NASA ADS] [CrossRef] [EDP Sciences] [Google Scholar]
- Geoghegan, M., Adams, N. G., & Smith, D. 1991, J. Phys. B: At. Mol. Opt. Phys., 24, 2589 [NASA ADS] [CrossRef] [Google Scholar]
- Geppert, W. D., Ehlerding, A., Hellberg, F., et al. 2004a, ApJ, 613, 1302 [NASA ADS] [CrossRef] [Google Scholar]
- Geppert, W. D., Thomas, R., Ehlerding, A., et al. 2004b, Faraday Discuss., 127, 425 [CrossRef] [PubMed] [Google Scholar]
- Geppert, W. D., Thomas, R. D., Ehlerding, A., et al. 2005, J. Phys. Conf. Ser., 4, 26 [NASA ADS] [CrossRef] [Google Scholar]
- Geppert, W. D., Hamberg, M., Thomas, R. D., et al. 2006, Faraday Discuss., 133, 177 [NASA ADS] [CrossRef] [PubMed] [Google Scholar]
- Groner, P., Albert, S., Herbst, E., & Lucia, F. C. D. 1998, ApJ, 500, 1059 [NASA ADS] [CrossRef] [Google Scholar]
- Haider, S. A., & Bhardwaj, A. 2005, Icarus, 177, 196 [NASA ADS] [CrossRef] [Google Scholar]
- Hamberg, M., Geppert, W. D., Rosén, S., et al. 2005, PCCP, 7, 1664 [NASA ADS] [CrossRef] [Google Scholar]
- Hamberg, M., Geppert, W. D., Thomas, R. D., et al. 2007, Mol. Phys., 105, 899 [NASA ADS] [CrossRef] [Google Scholar]
- Jarrold, M. F., Kirchner, N. J., Liu, S., & Bowers, M. T. 1986, J. Phys. Chem., 90, 78 [CrossRef] [Google Scholar]
- Jensen, M. J., Bilodeau, R. C., Heber, O., et al. 1999, Phys. Rev. A: At. Mol. Opt. Phys., 60, 2970 [NASA ADS] [Google Scholar]
- Jensen, M. J., Bilodeau, R. C., Safvan, C. P., Seiersen, K., & Andersen, L. H. 2000, ApJ, 543, 764 [NASA ADS] [CrossRef] [Google Scholar]
- Karpas, Z., & Meot-Ner, M. 1989, J. Phys. Chem., 93, 1859 [CrossRef] [Google Scholar]
- Lampert, A., Wolf, A., Habs, D., et al. 1996, Phys. Rev. A, 53, 1413 [NASA ADS] [CrossRef] [PubMed] [Google Scholar]
- Larsson, M., Danared, H., Mowat, J. R., et al. 1993, Phys. Rev. Lett., 70, 430 [NASA ADS] [CrossRef] [PubMed] [Google Scholar]
- Larsson, M., Broström, L., Carlson, M., et al. 1995, Phys. Scr., 51, 354 [NASA ADS] [CrossRef] [Google Scholar]
- Larsson, M., Ehlerding, A., Geppert, W. D., et al. 2005, J. Chem. Phys., 122, 156101 [NASA ADS] [CrossRef] [PubMed] [Google Scholar]
- Lias, S. G., Bartmess, J. E., Liebman, J. F., et al. 1988, J. Phys. Chem. Ref. Data, 17, Suppl. 1 [Google Scholar]
- Maret, S., Ceccarelli, C., & Cauz, E. 2004, A&A, 416, 577 [NASA ADS] [CrossRef] [EDP Sciences] [Google Scholar]
- Matthews, K. K., & Adams, N. G. 1997, Int. J. Mass. Spectrom. Ion. Proc., 163, 221 [Google Scholar]
- McCall, B. J., Huneycutt, A. J., Saykally, R. J., et al. 2003, Nature, 422, 500 [NASA ADS] [CrossRef] [PubMed] [Google Scholar]
- Millar, T. J., Herbst, E., & Snyder, L. E. 1991, ApJ, 369, 147 [NASA ADS] [CrossRef] [Google Scholar]
- Mowat, J. R., Danared, H., Sundström, G., et al. 1995, Phys. Rev. Lett., 74, 50 [NASA ADS] [CrossRef] [PubMed] [Google Scholar]
- Müller, U., & Cosby, P. C. 1999, Phys. Rev. A, 59, 3632 [NASA ADS] [CrossRef] [Google Scholar]
- Neau, A. 2002, Ph.D. Thesis, University of Stockholm, Sweden [Google Scholar]
- Neau, A., Al-Khalili, A., Rosén, S., et al. 2000, J. Chem. Phys., 113, 1762 [NASA ADS] [CrossRef] [Google Scholar]
- NIST, C. W. 2009, http://webbook.nist.gov/chemistry/ [Google Scholar]
- Paal, A., Simonsson, A., Dietrich, J., & Mohos, I. 2006, Proc. EPAC2006, 1196 [Google Scholar]
- Peeters, Z., Rodgers, S. D., Charnley, S. B., et al. 2006, A&A, 445, 197 [NASA ADS] [CrossRef] [EDP Sciences] [Google Scholar]
- Peterson, W. K., Abe, T., Fukunishi, H., et al. 1994, J. Geophys. Res., 99, 23257 [NASA ADS] [CrossRef] [Google Scholar]
- Semaniak, J., Larson, A., Padellec, A. L., et al. 1998, ApJ, 498, 886 [NASA ADS] [CrossRef] [Google Scholar]
- Smirnova, N. V., Lyakhov, A. N., & Kozlov, S. I. 2002, Adv. Space Res., 30, 2597 [NASA ADS] [CrossRef] [Google Scholar]
- Sutton, E. C., Peng, R., & Danchi, W. C. 1995, Ap&SS, 97, 455 [Google Scholar]
- Thomas, R. D. 2008, Mass Spectrom. Rev., 27, 485 [Google Scholar]
- Tom, B. A., Zhaunerchyk, V., Wiczer, M. B., et al. 2009, J. Chem. Phys., 130, 031101 [NASA ADS] [CrossRef] [PubMed] [Google Scholar]
- Vigren, E., Kaminska, M., Hamberg, M., et al. 2008, PCCP, 10, 4014 [Google Scholar]
- Wolf, A., Krohn, S., Kreckel, H., et al. 2003, Nucl. Instrum. Meth. A, 532, 69 [NASA ADS] [CrossRef] [Google Scholar]
- Woodall, A., & Markwick-Kemper, M. 2006, The UMIST Database for Astrochemistry, http://www.udfa.net/ [Google Scholar]
- Yee, J. H., Abreu, V. J., & Colwell, W. B. 1989, Dissociative Recombination [Int. Conf.], Meeting 1988, 286 [Google Scholar]
- Zhaunerchyk, V. 2008, Ph.D. Thesis, University of Stockholm, Sweden [Google Scholar]
- Zhaunerchyk, V., Thomas, R. D., Geppert, W. D., et al. 2008, J. Chem. Phys., 128, 134308 [NASA ADS] [CrossRef] [PubMed] [Google Scholar]
All Tables
Table 1: Branching fraction results for (CD3)2OD+ and CD3OCD2+ respectivelya.
Table 2: Energetically open and plausible reaction channels for the DR of (CD3)2OD+ including those leading to D2 and 2Da.
Table 3: Energetically open and plausible reaction channels for the DR of CD3OCD2+a.
Table 4: Comparison with UMIST and Ohio State Chemical Network rate constants and their implied branching fractionsa.
All Figures
|
|
Figure 1: A fragment energy spectrum recorded for (CD3)2OD+ when the grid is not inserted. The large peak to the right is due to particles impacting at full beam energy. The two smaller peaks in the middle are due to losses because of fragments with high transverse energy that miss the detector. The sharp peak at the leftmost position is due to noise in the detector system. |
| Open with DEXTER | |
| In the text | |
|
|
Figure 2: A fragment energy spectrum recorded for (CD3)2OD+ when the grid is inserted. The three major peaks are due to detection of fragments containing one, two or three heavy atoms, respectively. The sharp peak at the leftmost position is due to noise in the detector system mixed with signal from deuterium fragments. |
| Open with DEXTER | |
| In the text | |
|
|
Figure 3: Fragment energy spectrum recorded for CD3OCD2+ with the grid inserted. The three major peaks are due to detection of fragments containing one, two or three heavy atoms respectively. The sharp peak at the leftmost position is due to noise in the detector system mixed with signal from deuterium fragments and was not used in the branching fraction derivation. The second peak from the left stems from signal corresponding 4 amu mass (2D). |
| Open with DEXTER | |
| In the text | |
|
|
Figure 4: Cross section evaluation of (CD3)2OD+. The triangles shows individually measured spots while the line shows the best fit between 1-200 meV. |
| Open with DEXTER | |
| In the text | |
Copyright ESO 2010
Current usage metrics show cumulative count of Article Views (full-text article views including HTML views, PDF and ePub downloads, according to the available data) and Abstracts Views on Vision4Press platform.
Data correspond to usage on the plateform after 2015. The current usage metrics is available 48-96 hours after online publication and is updated daily on week days.
Initial download of the metrics may take a while.