| Issue |
A&A
Volume 514, May 2010
|
|
|---|---|---|
| Article Number | A73 | |
| Number of page(s) | 9 | |
| Section | Extragalactic astronomy | |
| DOI | https://doi.org/10.1051/0004-6361/200913799 | |
| Published online | 21 May 2010 | |
The origin of the mass-metallicity relation: an analytical approach
E. Spitoni1 - F. Calura2 - F. Matteucci1,2 - S. Recchi3
1 - Dipartimento di Fisica, Sezione di Astronomia, Università di Trieste, via G.B. Tiepolo 11, 34131, Italy
2 - INAF Osservatorio Astronomico di Trieste, via G.B. Tiepolo 11, 34131, Italy
3 - Institute of Astronomy,
Vienna University, Türkenschanzstrasse 17, 1180, Vienna,
Austria
Received 3 December 2009 / Accepted 22 January 2010
Abstract
Context. The mass-metallicity (MZ) relation in star-forming
galaxies at all redshifts has been recently established. It is
therefore important to understand the physical mechanisms underlying
such a relation.
Aims. We aim at studying some possible physical mechanisms
contributing to the MZ relation by adopting analytical solutions
of chemical evolution models, including infall and outflow.
Methods. Analytical models assume the instantaneous recycling
approximation, which is still an acceptable assumption for elements
produced on short timescales such as oxygen, which is the measured
abundance in the MZ relation.We explore the hypotheses of a variable
galactic wind rate, infall rate, and yield per stellar generation (i.e.
a variation in the IMF), as possible causes for the MZ relation.
Results. By means of analytical models, we computed the expected
O abundance for galaxies of a given total baryonic mass and gas
mass.The stellar mass was derived observationally and the gas mass was
derived by inverting the Kennicutt law of star formation, once its rate
is known. Then we tested how the parameters describing the outflow,
infall, and IMF should vary to reproduce the MZ relation, and we
exclude the cases where such a variation leads to unrealistic
situations.
Conclusions. We find that a galactic wind rate increasing with
decreasing galactic mass or a variable IMF are both viable solutions
for the MZ relation. A variable infall rate instead is not
acceptable. It is difficult to differentiate among the outflow and IMF
solutions by only considering the MZ relation, and other
observational constraints should be taken into account in selecting a
specific solution. For example, a variable efficiency of star formation
increasing with galactic mass can also reproduce the MZ relation
and explain the downsizing in star formation suggested for ellipticals.
The best solution could be a variable efficiency of star formation
coupled with galactic winds, which are indeed observed in low-mass
galaxies.
Key words: ISM: abundances - Galaxy: abundances - Galaxy: stellar content - galaxies: evolution
1 Introduction
The study of the relation between the galactic stellar mass and the gas-phase metallicity, which represents the abundance of heavy elements present in the interstellar medium (hereinafter ISM), provides us with constraints on the various parameters fundamental for any galaxy formation theory. These parameters include the stellar initial mass function (IMF), representing the distribution of stellar masses at birth, which strongly influences the amount of heavy elements produced and restored by stars into the ISM. The mass-metallicity (hereinafter MZ) relation can also provide information on the star formation history: in general, a higher star formation rate (SFR) produces a higher concentration of metals in the ISM. Finally, the MZ relation provides information on the role of infall/outflow in galaxy evolution, namely on the amount of matter either ejected from galaxies into the intergalactic medium (IGM) or accreted onto galaxies from the IGM. Galactic outflows are directly connected to the importance of feedback and energy exchange between stars and interstellar gas.
At the present time, different theoretical explanations of the MZ relation have been proposed by various authors. The first explanation is based on starburst-induced galactic outflows, which are more efficient in expelling metal-enriched matter from low-mass galaxies than from giant galaxies, mainly owing to the shallower gravitational potential wells of the former (Larson 1974; Dekel & Silk 1986; Tremonti et al. 2004; De Lucia et al. 2004; Kobayashi et al. 2007; Finlator & Davé 2008). However, at the present time it is difficult to assess how the outflow efficiency depends on the baryonic galactic mass. In an alternative scenario, infall of pristine gas can dilute the interstellar metals and act in the same way as outflows, once one assumes longer infall timescales in lower mass galaxies (Dalcanton et al. 2004; but see also Dalcanton 2007).
Another explanation is that dwarf galaxies are less evolved than large galaxies, namely that the efficiency of star formation is greater in more massive systems. In this picture, large galaxies have formed the bulk of their stars by means of an intense star formation event at high redshift, quickly enriching their ISM to solar or over-solar metallicities, whereas dwarf galaxies, characterized by lower star formation efficiencies (i.e. SFRs per unit mass of gas) have subsolar interstellar metallicities. This interpretation is supported by various chemical evolution studies (Lequeux et al. 1979; Matteucci 1994; Calura et al. 2009), by cosmological N-body simulations (Brooks et al. 2007; Mouhcine et al. 2008; Tassis et al. 2008), and by hydrodynamical simulations (Tissera et al. 2005; De Rossi et al. 2007). A fourth way to produce an MZ relation is by means of a variable IMF as investigated in Köppen et al. (2007). It is possible that the relative importance of these processes may vary as a function of the total galactic stellar mass. However, the theoretical investigations performed so far do not allow us to disentagle these phenomena and to assess which may be considered dominant in galaxies of different masses.
In this paper, we aim at investigating the importance of different physical processes in determining the MZ relation by means of analytical chemical evolution models. This analytical approach will allow us to rapidly test the parameter space involved in our study, and it is justified because the oxygen evolution can be computed under the instantaneous recycling approximation, as is required for analytical solutions. By means of the solutions of the analytical models, including infall and outflow, we can compute the expected metallicity for a galaxy of a given mass and a given gas mass fraction. The total stellar mass and gas mass are derived from the observational data; in particular, we use the local MZ relation determined in SDSS galaxies, and from the SFRs observed in the same galaxy sample, we derive the gas mass fractions by adopting the Kennicutt (1998) law for star formation. We aim at assessing the importance of outflow, infall, and IMF (through the yield per stellar generation) in determining the MZ relation for galaxies of various masses. We also prove detailed expressions for the effective yields in different physical conditions,which can be used to compare the empirical effective yields as derived from observations (see Dalcanton 2007).
Our paper is organized as follows. In Sect. 2, we present our equations, our basic assumptions and the observables used in our study. In Sect. 3, we present our results, and finally, some conclusions are drawn in Sect. 4.
2 Summary of simple-model solutions
2.1 The simple model
We recall here the main assumptions and results of the simple models of chemical evolution (Tinsley 1980; Matteucci 2001; Recchi et al. 2008). As well known, the so-called Simple Model of chemical evolution is based on the following assumptions.
- 1.
- the system is one-zone and closed, namely there are no inflows or outflows;
- 2.
- the initial gas is primordial (no metals);
- 3.
- the IMF is constant in time;
- 4.
- the gas is well mixed at any time (instantaneous mixing approximation);
- 5.
- stars more massive than 1
 die instantaneously; stars
smaller than 1
live forever (instantaneous recycling
approximation or IRA).
die instantaneously; stars
smaller than 1
live forever (instantaneous recycling
approximation or IRA).
where
where pZ, m is the fraction of newly produced and ejected metals by a star of mass m.
The well known solution of the closed box
model can be easily found as:

where
2.2 Leaky-box models
Relaxing the first of the assumptions of the simple model, we get the models including gas flows, also known as leaky box models. Analytical solutions of simple models of chemical evolution including infall or outflow have been known for at least 30 years (Pagel & Patchett 1975; Hartwick 1976; Twarog 1980; Edmunds 1990). Here we follow the approach and the terminology of Matteucci (2001); namely, for simplicity we assume linear flows (gas flows proportional to the SFR). Therefore, the outflow rate W (t)is defined aswhere
Here
If we consider a system including outflow and infall, the set of equations we need to solve is the following one:
![\begin{displaymath}\cases{{{\rm d} M_{\rm tot} \over {\rm d} t} = (\Lambda - \la...
...} t} = (1 - R) \psi (t) [\Lambda Z_A + y_Z - (\lambda + 1) Z]}
\end{displaymath}](/articles/aa/full_html/2010/06/aa13799-09/img32.png)
where MZ is the mass of metals (
2.2.1 Simple model with outflow
If we study a simple model with only outflow, e.g. A(t)=0, the system of Eq. (6) can be worked out, yielding the following solution (Matteucci 2001):
![\begin{displaymath}Z = {{y_Z} \over (1+\lambda)}\ln [(1+\lambda)\mu^{-1}-\lambda].
\end{displaymath}](/articles/aa/full_html/2010/06/aa13799-09/img34.png)
For the integration we assume that at t=0, Z(0)=0,
![\begin{displaymath}y_Z = {Z (1+\lambda) \over \ln [(1+\lambda)\mu^{-1}-\lambda]},
\end{displaymath}](/articles/aa/full_html/2010/06/aa13799-09/img38.png)
|
(8) |
and it is clearly lower than the effective yield defined in Eq. (3). This should be kept in mind when using Eq. (3) to interpret observational data.
2.2.2 Simple model with infall
Here we analyze the opposite case:
![]() and W(t)=0.
Assuming for the infalling gas a primordial composition (e.g. ZA=0),
and W(t)=0.
Assuming for the infalling gas a primordial composition (e.g. ZA=0),
![]() and
and
![]() ,
we obtain this solution (Matteucci 2001):
,
we obtain this solution (Matteucci 2001):
![\begin{displaymath}Z = {{ y_Z} \over \Lambda}\biggl\lbrace
1 - \bigl[ (\Lambda-...
... \mu^{-1} \bigr]^{\Lambda \over {\Lambda
- 1}} \biggr\rbrace.
\end{displaymath}](/articles/aa/full_html/2010/06/aa13799-09/img42.png)
We notice here that, in models with infall, not all the values of

|
(10) |
For
2.2.3 Simple model with inflow and outflow
The general solution for a system described by the simple model in
the presence of infall of gas with a general metallicity ZA and
outflow is (Recchi et al. 2008)
![\begin{displaymath}Z = {{\Lambda Z_A + y_Z} \over \Lambda}\biggl\lbrace
1 - \bi...
...\bigr]^{\Lambda \over {\Lambda - \lambda
- 1}} \biggr\rbrace.
\end{displaymath}](/articles/aa/full_html/2010/06/aa13799-09/img48.png)
If the outflow rate is higher than the infall rate, the solution is defined for all
In the models in which
![]() ,
,
![]() always
increases (Eq. (6)), therefore
always
increases (Eq. (6)), therefore ![]() ranges between 1 and
a minimum value:
ranges between 1 and
a minimum value:
|
(12) |
For models in which
2.2.4 Simple model with differential winds
Recchi et al. (2008) present a set of new solutions in the simple
model context and in the presence of differential winds, namely models where
the metals are more easily channelled out of the parent galaxy than
the pristine gas. The easiest way to consider a differential wind in
the framework of simple models of chemical evolution is to assume that
the metallicity of the gas carried out in the galactic wind is
proportional to the metallicity of the ISM with a proportionality
constant greater than one. If we define ![]() as the metallicity of
the outflowing gas, this condition implies that
as the metallicity of
the outflowing gas, this condition implies that
![]() with
the ejection efficiency
with
the ejection efficiency ![]() .
In the metallicity budget
(third equation in (6)), we assume that the negative term
due to the galactic wind is given by
.
In the metallicity budget
(third equation in (6)), we assume that the negative term
due to the galactic wind is given by
![]() .
.
With their simple approach, Recchi et al. (2008) are able to determine analytical expressions for the evolution of Z, which allow us to understand the effect of galactic winds on the chemical evolution of galaxies more clearly.
The set of the equations we solve in this case is very similar
to (6), with the only difference given by the
metallicity budget equation, which we modify as
![\begin{displaymath}{{\rm d} M_Z \over {\rm d} t} = (1 - R) \psi (t) [\Lambda Z_A + y_Z - (\lambda \beta
+ 1) Z].
\end{displaymath}](/articles/aa/full_html/2010/06/aa13799-09/img59.png)
The solution of this new set of equations is given by

It is trivial to see that we can obtain Eq. (11) in the case
3 The observed mass-metallicity relation and our method
Kewley & Ellison (2008) analyzed the metallicity relation for Sloan Digit Sky Survey (SDSS) 27 730 star-forming galaxies by adopting 10 different metallicity calibrations. In Fig. 1 we show the MZ relation at z=0.1 obtained by using the calibration of Kewley & Dopita (2002), considered the best in the analysis by Calura et al. (2009), including the average values and the standard deviation.
![\begin{figure}
\par\includegraphics[width=7.5cm,clip]{13799fg1.eps}
\end{figure}](/articles/aa/full_html/2010/06/aa13799-09/img62.png)
|
Figure 1: The observed MZ relation for the oxygen (Kewley & Ellison 2008). The dashed lines are the average values and the standard deviation and the solid one is the best fit to the average values as given by Maiolino et al. (2008).The redshift of the galaxies is indicated in the top right of the figure. |
| Open with DEXTER | |
In the same figure we also report the analytical fit of the observed MZ relation of Kewley & Ellison (2008), as given by Maiolino et al. (2008), in particular,
![\begin{displaymath}\log({\rm O/H}) +12=-0.0864*\left[\log\left( \frac{M_{*}}{M_{\odot}}\right) -11.18\right]^{2}+9.04.
\end{displaymath}](/articles/aa/full_html/2010/06/aa13799-09/img63.png)
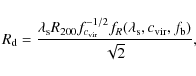
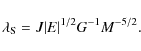
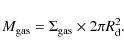
Since from now on we use this analylitical fit as our fiducial MZ relation. For estimating the amount of gas that resides in each star-forming galaxy, we use the method described in Calura et al. (2008). We determine the cold gas mass of each galaxy on the basis of its SFR, by inverting the Kennicutt (1998) (hereafter K98) relation, which links the gas surface density to the SFR per unit area. A similar technique was used by Erb et al. (2006) and Erb (2008) to derive the gas fractions for a sample of star-forming galaxies at
Following K98, for any galaxy, the gas surface
density
![]() ,
expressed in
,
expressed in
![]() ,
depends
on the SFR surface density
,
depends
on the SFR surface density
![]() ,
expressed in
,
expressed in
![]() according
according
|
(16) |
The scaling radius
where
The quantity
The parameter
![]() is the halo concentration factor, and it is calculated
following Bullock et al. (2001) and Somerville et al. (2006), i.e., by
defining a collapse redshift
is the halo concentration factor, and it is calculated
following Bullock et al. (2001) and Somerville et al. (2006), i.e., by
defining a collapse redshift ![]() for each halo, as
for each halo, as
![]() .
The value of
.
The value of
![]() is given by
is given by
![]() ,
where
F and K are two adjustable parameters. Following Somerville et al. (2006), we assume K=3.4 and F=0.01. Here we assume
,
where
F and K are two adjustable parameters. Following Somerville et al. (2006), we assume K=3.4 and F=0.01. Here we assume ![]() ,
corresponding to the average redshift of the SDSS galaxies
(Tremonti et al. 2004).
,
corresponding to the average redshift of the SDSS galaxies
(Tremonti et al. 2004).
To compute the quantities
![]() and fR, was used the analytic fitting functions presented in Mo
et al. (1998). For each galaxy, if
and fR, was used the analytic fitting functions presented in Mo
et al. (1998). For each galaxy, if ![]() is the SFR in units of
is the SFR in units of
![]() yr and if we assume for the SFR surface density profile
yr and if we assume for the SFR surface density profile
![]() ,
the
central SFR surface density is then given by
,
the
central SFR surface density is then given by

|
(19) |
The gas surface density
|
(20) |
At this point we have a relation between
The aim of this work is to constrain the model parameters of simple
models to reproduce the analytical fit (Eq. (15)) of the MZ
relation. In our reference model we assume the
value of
![]() for the oxygen yield, a yield obtained by adopting the Salpeter
IMF (x=1.35 over the mass range 0.1-100
for the oxygen yield, a yield obtained by adopting the Salpeter
IMF (x=1.35 over the mass range 0.1-100 ![]() ), the same one used for
the inversion of the K98 law, and the stellar yields of Woosley &
Weaver (1995) for oxygen at solar metallicity. In the first part of
our work, we explore the effect of a different choice of yields in the
closed models. Given a stellar mass content M*, we have an oxygen
abundance value from the observed MZ relation, and then for each
galaxy we have an estimate of the gas fraction
), the same one used for
the inversion of the K98 law, and the stellar yields of Woosley &
Weaver (1995) for oxygen at solar metallicity. In the first part of
our work, we explore the effect of a different choice of yields in the
closed models. Given a stellar mass content M*, we have an oxygen
abundance value from the observed MZ relation, and then for each
galaxy we have an estimate of the gas fraction ![]() using the
procedure described above. Therefore in closed models the only free
parameter is the yield. We also show the effect of a non-constant
yield, assuming is the IMF that varies and not the
nucleosynthesis from galaxy to galaxy.
using the
procedure described above. Therefore in closed models the only free
parameter is the yield. We also show the effect of a non-constant
yield, assuming is the IMF that varies and not the
nucleosynthesis from galaxy to galaxy.
Concerning leaky box models, if we fix Z and ![]() we can vary the
wind and infall parameters, as well as the yield. We aim at testing
the way in which the parameter space is constrained if we want to
reproduce the observed MZ relation using simple-model solutions.
we can vary the
wind and infall parameters, as well as the yield. We aim at testing
the way in which the parameter space is constrained if we want to
reproduce the observed MZ relation using simple-model solutions.
![\begin{figure}
\par\includegraphics[width=7.5cm,clip]{13799fg2.eps}
\end{figure}](/articles/aa/full_html/2010/06/aa13799-09/img87.png)
|
Figure 2:
The gas fraction |
| Open with DEXTER | |
4 Results
4.1 Closed box model results
First of all we report our results for the closed model. In this case
we can only vary the yield in the Eq. (3), because once M* is
fixed, the Z is given by the observational fit of Maiolino et al. (2008) and ![]() from the inversion of the Kennicutt law. In the
Fig. 3 we report the simple-model solution compared to the
observational average values and the standard deviation for the MZ
relation. If we consider the simple model by adopting a constant oxygen
effective yield of
from the inversion of the Kennicutt law. In the
Fig. 3 we report the simple-model solution compared to the
observational average values and the standard deviation for the MZ
relation. If we consider the simple model by adopting a constant oxygen
effective yield of
![]() ,
observational data are clearly not
reproduced. The predicted slope is too flat as shown in Fig. 3. Even if we consider a smaller
yield, the problem is not solved: the MZ is simply translated at lower
values with the same slope. The next step is to consider a variable
yield as a function of the M*. In the upper panel of Fig. 4
we report the yields per stellar generation as a function of the
metallicity obtained to reproduce the MZ relation, whereas in the
lower panel y is as a function of stellar mass. The best fit yields
spans in the range between 0.004 and 0.007.
,
observational data are clearly not
reproduced. The predicted slope is too flat as shown in Fig. 3. Even if we consider a smaller
yield, the problem is not solved: the MZ is simply translated at lower
values with the same slope. The next step is to consider a variable
yield as a function of the M*. In the upper panel of Fig. 4
we report the yields per stellar generation as a function of the
metallicity obtained to reproduce the MZ relation, whereas in the
lower panel y is as a function of stellar mass. The best fit yields
spans in the range between 0.004 and 0.007.
4.2 Leaky box results
![\begin{figure}
\par\includegraphics[width=7.5cm,clip]{13799fg3.eps}
\end{figure}](/articles/aa/full_html/2010/06/aa13799-09/img88.png)
|
Figure 3:
The observed MZ relation and related standard deviation as
indicated with the dotted red lines. With the green solid line we
show our closed box model results assuming for the oxygen a yield
per stellar generation of
|
| Open with DEXTER | |
![\begin{figure}
\par\includegraphics[width=7.5cm,clip]{13799fg4.eps}
\end{figure}](/articles/aa/full_html/2010/06/aa13799-09/img89.png)
|
Figure 4:
In the lower panel we report the |
| Open with DEXTER | |
![\begin{figure}
\par\includegraphics[width=7.5cm,clip]{13799fg5.eps}
\end{figure}](/articles/aa/full_html/2010/06/aa13799-09/img90.png)
|
Figure 5:
Upper panel: the best |
| Open with DEXTER | |
![\begin{figure}
\par\includegraphics[width=7.5cm,clip]{13799fg6.eps}
\end{figure}](/articles/aa/full_html/2010/06/aa13799-09/img92.png)
|
Figure 6:
Case with only infall: dashed area represents the forbidden |
| Open with DEXTER | |

In Fig. 6 there are the forbidden and allowed
![\begin{figure}
\par\includegraphics[width=7.5cm,clip]{13799fg7.eps}
\end{figure}](/articles/aa/full_html/2010/06/aa13799-09/img96.png)
|
Figure 7:
Upper panel: the best |
| Open with DEXTER | |
When
![]() and
and ![]() ,
the
,
the ![]() values
must be <1.88, whereas for
values
must be <1.88, whereas for
![]() and
and
![]() then
then
![]() .
Therefore, for the lower
range of stellar masses considered, the derived
.
Therefore, for the lower
range of stellar masses considered, the derived ![]() does not
allow the observed MZ relation to be reproduced. We conclude that the
simple model solution concerning system with only infall varying with
galactic stellar-mass is unable to fit the MZ for small stellar mass
galaxies even if we choose the best-fit
does not
allow the observed MZ relation to be reproduced. We conclude that the
simple model solution concerning system with only infall varying with
galactic stellar-mass is unable to fit the MZ for small stellar mass
galaxies even if we choose the best-fit ![]() values.
values.
Concerning the solution of simple models with infall and outflow at
the same time, we fix
![]() in Eq. (11), and we test
which values of
in Eq. (11), and we test
which values of ![]() must be assumed to reproduce the MZ
relation. As reported in the upper panel of Fig. 7, the
best-fit model for
must be assumed to reproduce the MZ
relation. As reported in the upper panel of Fig. 7, the
best-fit model for ![]() anti-correlates with the stellar mass M*.
anti-correlates with the stellar mass M*.
In the lower panel we see that the MZ relation is reproduced by
the best-fit model line. In the MZ plot we also
include the result of the model only with the infall parameter
![]() equal to 0.5. This model solution clearly does not reproduce the MZ
relation. Therefore, a variable infall efficiency or a fixed one
coupled with a variable outflow as a function of the galactic stellar
mass is required.
equal to 0.5. This model solution clearly does not reproduce the MZ
relation. Therefore, a variable infall efficiency or a fixed one
coupled with a variable outflow as a function of the galactic stellar
mass is required.
![\begin{figure}
\par\includegraphics[width=7.5cm,clip]{13799fg8.eps}
\end{figure}](/articles/aa/full_html/2010/06/aa13799-09/img102.png)
|
Figure 8:
Upper panel: the best |
| Open with DEXTER | |
![\begin{figure}
\par\includegraphics[width=7.5cm,clip]{13799fg9.eps}
\end{figure}](/articles/aa/full_html/2010/06/aa13799-09/img103.png)
|
Figure 9:
Upper panel: the best-fit values for |
| Open with DEXTER | |
We also analyze the case with a constant infall
![]() and a
variable outflow as reported in Fig. 8. In the upper panel we
see the behavior of the model with the best-fit
and a
variable outflow as reported in Fig. 8. In the upper panel we
see the behavior of the model with the best-fit ![]() values. The
choice of this particular value of
values. The
choice of this particular value of ![]() is just arbitrary, but it does
show the effect of a variable galactic wind in the presence of an infall
with a fixed
is just arbitrary, but it does
show the effect of a variable galactic wind in the presence of an infall
with a fixed ![]() value, high enough to make the metallicity of
large galaxies to decrease. We see that for M* higher than
value, high enough to make the metallicity of
large galaxies to decrease. We see that for M* higher than
![]() ,
,
![]() vanishes. The reason for this can be
understood by analyzing the lower panel of Fig. 8. As in
Fig. 7 we also report the solution with only the infall. We
note that the infall with
vanishes. The reason for this can be
understood by analyzing the lower panel of Fig. 8. As in
Fig. 7 we also report the solution with only the infall. We
note that the infall with
![]() is too strong and flattens the
MZ relation for high stellar mass systems. Therefore, if we couple this infall with an variable outflow,
the best fit model is able to fit the MZ relation
for systems with low stellar-mass values but certainly we cannot
reproduce the part of the observed MZ where the infall was already too
strong, namely for high galactic stellar masses. We find that the
maximum value for the
is too strong and flattens the
MZ relation for high stellar mass systems. Therefore, if we couple this infall with an variable outflow,
the best fit model is able to fit the MZ relation
for systems with low stellar-mass values but certainly we cannot
reproduce the part of the observed MZ where the infall was already too
strong, namely for high galactic stellar masses. We find that the
maximum value for the ![]() parameter, when varying
parameter, when varying ![]() to
reproduce the MZ relation, must be
to
reproduce the MZ relation, must be ![]() 0.7.
0.7.
The results from varying both the parameters are reported in
Fig. 9. In the upper panel, the best-fit parameters as a
function of M* are reported. These sets of best parameters lead to
a difference in the MZ relation less than 10-5 dex between the
best fit of Maiolino et al. (2008) and simple model solutions with
this choice. In fact, in the lower panel of Fig. 9 comparing
the Maiolino's fit and our best fit, we see that the two lines overlap
perfectly. It is worth noting that in most of the mass bins (at least
for
![]() is
is
![]() .
.
![\begin{figure}
\par\includegraphics[width=7.5cm,clip]{13799fg10.eps}
\end{figure}](/articles/aa/full_html/2010/06/aa13799-09/img108.png)
|
Figure 10:
Upper panel: the best values for |
| Open with DEXTER | |
![\begin{figure}
\par\includegraphics[width=7.5cm,clip]{13799fg11.eps}
\end{figure}](/articles/aa/full_html/2010/06/aa13799-09/img109.png)
|
Figure 11:
Upper panel: the best values for |
| Open with DEXTER | |
The last part of our work is focused on simple model solutions with
infall and differential winds. We presented in Sect. 2 the
analytical solution found by Recchi et al. (2008). Considering also in
this case a model with primordial infall, i.e. ZA=0,we studied
systems with 3 sets of parameters for ![]() and
and ![]() :
:
![]() .
In the upper panel of
Fig. 10 we show the variation in the possible
.
In the upper panel of
Fig. 10 we show the variation in the possible ![]() values
that can be considered in order to reproduce the MZ relation. As
expected, for all models the best fit for
values
that can be considered in order to reproduce the MZ relation. As
expected, for all models the best fit for ![]() anti-correlates with
the galactic stellar mass, and the values of
anti-correlates with
the galactic stellar mass, and the values of ![]() are higher for
the first model
are higher for
the first model
![]() .
Both the first and the
second model can reproduce the MZ relation. In the case with
.
Both the first and the
second model can reproduce the MZ relation. In the case with
![]() instead, we are not able to reproduce the MZ
relation, as shown in the lower panel of Fig. 10. Moreover, as shown in
Fig. 11 we fix the infall parameter at the value
instead, we are not able to reproduce the MZ
relation, as shown in the lower panel of Fig. 10. Moreover, as shown in
Fig. 11 we fix the infall parameter at the value
![]() ,
and we find that the upper limit value for
,
and we find that the upper limit value for ![]() ,
in
order to fit the MZ relation, is
,
in
order to fit the MZ relation, is ![]() 0.6 and in this case
0.6 and in this case ![]() ranges between 1 and 5.
ranges between 1 and 5.
![\begin{figure}
\par\includegraphics[width=7.5cm,clip]{13799fg12.eps}
\end{figure}](/articles/aa/full_html/2010/06/aa13799-09/img112.png)
|
Figure 12:
The best-fit values for |
| Open with DEXTER | |
We also study the case in which
![]() ,
with this set of
parameters:
,
with this set of
parameters:
![]() .
Here, the solution is defined only for values of
.
Here, the solution is defined only for values of ![]() such that
such that

|
(22) |
as in the case of the model with outflow and infall. Using the set (3,1),
Table 1: Permitted values of the parameters for reproducing the MZ relation.
In Table 1 we summarize the permitted values of the parameters for reproducing the MZ relation for all the cases studied in this work.
5 Conclusions
In this paper we have explored different solutions for the MZ relation observed in SDSS galaxies. We adopted simple analytical models including infall, outflow, and differential outflow besides the classical closed-box case. All the solutions of the analytical models contain the yield per stellar generation plus several parameters describing the different physical processes considered. We started by deriving the gas mass for the sample of the studied galaxies with known stellar galactic masses and SFRs, by inverting the K98 law. Then, by means of these gas masses we derived the metallicity of each galaxy through the analytical models. At this point, we tried to vary the model parameters corresponding to the different physical processes to see whether the observed MZ could be reproduced. As it is well known, in order to obtain that metallicity increasing with galactic mass, the effective yield should decrease with decreasing mass. The effective yield can decrease because the outflow or infall becomes more important with decreasing mass or because the IMF becomes steeper. Some of these cases have already been studied by other authors but never all together, and here we add a new case with differential outflow with wind intensity increasing with decreasing mass. By differential outflow we mean a galactic wind where metals are lost preferentially. Then, we tested whether the required parameter variations were realistic in order to choose among the different solutions.
Our conclusions can be summarized as follows.
- The observed local MZ relation can be perfectly reproduced
under the assumption of a closed box and an effective yield varying
from galaxy to galaxy. This means that either the nucleosynthesis is
different or, more likely, that the IMF is different from galaxy to
galaxy. The required yield variation is rather small and lies in the
range 0.004-0.007, corresponding to a variation in the slope of the
IMF (one-slope IMF defined in the mass range 0.1-100 )
from
 1.35 to 1.5 going from more to less massive galaxies. However,
the variation in the IMF always implies variations in other physical
quantities besides the O abundance and therefore, before accepting
this solution, it would be necessary to test other observables such
as colors, the color-magnitude diagrams, and the M/L ratios, if
available. Besides that, if we change the IMF we should in principle also
change the conversion factor from SFR to
1.35 to 1.5 going from more to less massive galaxies. However,
the variation in the IMF always implies variations in other physical
quantities besides the O abundance and therefore, before accepting
this solution, it would be necessary to test other observables such
as colors, the color-magnitude diagrams, and the M/L ratios, if
available. Besides that, if we change the IMF we should in principle also
change the conversion factor from SFR to  in the inversion
of the Kennicutt law, which in our work has been calculated by
adopting a Salpeter IMF in the mass range 0.1-100
(see
Sect. 3).
in the inversion
of the Kennicutt law, which in our work has been calculated by
adopting a Salpeter IMF in the mass range 0.1-100
(see
Sect. 3).
- The observed MZ relation can be reproduced very well by a
constant yield but a variable efficiency of the outflow, increasing
from more to less massive galaxies. This is not a new
conclusion since it has been discussed before by several authors
(Garnett 2000; Tremonti et al. 2004; Edmunds 2005). However, here
we reached this conclusion by considering the most recent
observational data. In particular, the wind parameter
 ,
which roughly represents the ratio between the wind rate and the
SFR, should vary from 1 to 5.5, going from large to small galaxies,
which is quite a reasonable range also supported by galactic wind
observations (Martin et al. 2002). We have also found that outflows
must play an important role especially for galaxies with stellar
masses <
,
which roughly represents the ratio between the wind rate and the
SFR, should vary from 1 to 5.5, going from large to small galaxies,
which is quite a reasonable range also supported by galactic wind
observations (Martin et al. 2002). We have also found that outflows
must play an important role especially for galaxies with stellar
masses <
 .
This is consistent with other results
on the efficiency of outflows as a function of galactic mass, which
show that dwarf galaxies must have ejected a fraction of their
present baryonic mass greater than massive galaxies (e.g. Gibson &
Matteucci 1997; Calura et al. 2008).
.
This is consistent with other results
on the efficiency of outflows as a function of galactic mass, which
show that dwarf galaxies must have ejected a fraction of their
present baryonic mass greater than massive galaxies (e.g. Gibson &
Matteucci 1997; Calura et al. 2008).
- The local MZ relation cannot be reproduced by a variable infall efficiency, no wind, and constant IMF, so this solution should be rejected. This does not mean, however, that the infall is not important for the considered galaxies. Infall can be present, but it is not the cause of the MZ relation. Moreover, an infall rate increasing with decreasing galactic mass is not very easy to explain on a physical basis.
- Models with variable infall and outflow rates can, in fact, well reproduce the observed local MZ relation. In this case, the outflow rate is generally larger than the infall rate.
-
Differential galactic winds, where metals are mostly lost from the
galaxy, can also reproduce the observed MZ relation very well,
provided that
 .
In this case, the metal ejection
efficiency
.
In this case, the metal ejection
efficiency  is always greater in smaller galaxies.
On the other hand, when
is always greater in smaller galaxies.
On the other hand, when
 not all the values of
 and
are acceptable. Considering only the
acceptable values for these parameters, we found that
values,
able to reproduce the MZ relation, are generally higher than in the
case with
and
are acceptable. Considering only the
acceptable values for these parameters, we found that
values,
able to reproduce the MZ relation, are generally higher than in the
case with
 .
.
The assumption of a larger
in low-mass galaxies simply means
that these galaxies are able to expel large fractions, relative to
their total mass, of newly synthesized metals, but only tiny fractions
of pristine ISM, in agreement with many hydrodynamical studies of
star-forming dwarf galaxies (e.g. MacLow & Ferrara 1999; D'Ercole &
Brighenti 1999; Recchi et al. 2001).
- We did not explore the case in which the efficiency of star formation increases with galactic mass, since the SFR does not appear in the solutions of the analytical models. Moreover, such a solution has already been explored in detail by Calura et al. (2009), who shows that this assumption reproduces the MZ relations both at low and high redshift. In addition, this in variation the star formation efficiency produces a downsizing effect in the star formation, which is often invoked to explain the properties of ellipticals (Pipino & Matteucci 2004).
- In conclusion, on the basis of this paper and previous results of Calura et al.'s (2009), the most plausible solution is that the MZ relation is created by variable star formation efficiency from galaxy to galaxy coupled to galactic winds (preferentially metal-enhanced) becoming more and more important in low-mass galaxies. But as stressed by Edmunds (2005), explaining the mass-metallicity relation by a systematic increase in the star formation efficiency with galactic mass poses the problem of understanding the physical mechanism behind it. Several suggestions exist in the literature, but the real physical origin of this correlation is not known. A possibility is that the higher the pressure in the ISM, the higher the star formation efficiency, and the more massive galaxies have higher ISM pressure because of their deeper potential wells (see Elmegreen & Efremov 1997; Harfst et al. 2006).
We thank the referee, M. Edmunds, for the enlightening suggestions. We acknowledge financial support from MIUR (Italian Ministry of Research, contract PRIN2007 Prot.2007JJC53X-001) and from Italian Space Agency contract ASI-INAF I/016/07/0.
References
- Barnes, J., & Efstathiou, G. P. 1987, ApJ, 319, 575 [NASA ADS] [CrossRef] [Google Scholar]
- Brooks, A. M., Governato, F., Booth, C. M., et al. 2007, ApJ, 655, L17 [NASA ADS] [CrossRef] [Google Scholar]
- Bullock, J. S., Dekel, A., Kolatt, T. S., et al. 2001, ApJ, 555, 240 [NASA ADS] [CrossRef] [Google Scholar]
- Calura, F., Jimenez, R., Panter, B., Matteucci, F., & Heavens, A. F. 2008, ApJ, 682, 252 [NASA ADS] [CrossRef] [Google Scholar]
- Calura, F., Pipino, A., Chiappini, C., Matteucci, F., & Maiolino, R. 2009, A&A, 504, 373 [NASA ADS] [CrossRef] [EDP Sciences] [Google Scholar]
- Dalcanton, J. J. 2007, ApJ, 658,941 [NASA ADS] [CrossRef] [Google Scholar]
- Dalcanton, J. J., Yoachim, P., & Bernstein, R. A. 2004, ApJ, 608, 189 [NASA ADS] [CrossRef] [Google Scholar]
- Dekel, A., & Silk, J. 1986, ApJ, 303, 39 [NASA ADS] [CrossRef] [Google Scholar]
- D'Ercole, A., & Brighenti, F. 1999, MNRAS, 309, 941 [NASA ADS] [CrossRef] [Google Scholar]
- De Lucia, G., Kauffman, G., & White, S. D. M. 2004, MNRAS, 349, 1101 [NASA ADS] [CrossRef] [Google Scholar]
- De Rossi, M. E., Tissera, P. B., & Scannapieco, C. 2007, MNRAS, 374, 323 [NASA ADS] [CrossRef] [Google Scholar]
- Edmunds, M. G. 1990, MNRAS, 246, 678 [NASA ADS] [Google Scholar]
- Edmunds, M. G. 2005, Astronomy & Geophysics, 46, 4.12 [Google Scholar]
- Elmegreen, B. G., & Efremov, Y. N. 1997, ApJ, 480, 235 [NASA ADS] [CrossRef] [Google Scholar]
- Erb, D. K. 2008, ApJ, 674, 151 [NASA ADS] [CrossRef] [Google Scholar]
- Erb, D. K., Steidel, C. C., Shapley, A. E., et al. 2006, ApJ, 646, 107 [NASA ADS] [CrossRef] [Google Scholar]
- Finlator, K., & Davé, R. 2008, MNRAS, 385, 2181 [NASA ADS] [CrossRef] [Google Scholar]
- Garnett, D. T. 2004, MNRAS, 349, 491 [NASA ADS] [CrossRef] [Google Scholar]
- Gibson, B. K., & Matteucci, F. 1997, ApJ, 475, 47 [NASA ADS] [CrossRef] [Google Scholar]
- Harfst, S., Theis, C., & Hensler, G. 2006, A&A, 449, 509 [NASA ADS] [CrossRef] [EDP Sciences] [Google Scholar]
- Hartwick, F. D. A. 1976, ApJ, 209, 418 [NASA ADS] [CrossRef] [Google Scholar]
- Heavens, A. F., & Peacock, J. 1988, MNRAS, 232, 339 [NASA ADS] [CrossRef] [Google Scholar]
- Jimenez, R., Padoan, P., Matteucci, F., & Heavens, A. F. 1998, MNRAS, 299, 123 [NASA ADS] [CrossRef] [Google Scholar]
- Kennicutt, R. C. 1998, ApJ, 498, 541 [NASA ADS] [CrossRef] [Google Scholar]
- Kewley, L. J., & Dopita, M. A. 2002, ApJS, 142, 35 [NASA ADS] [CrossRef] [Google Scholar]
- Kewley, L. J., & Ellison, S. L. 2008, ApJ, 681, 1183 [NASA ADS] [CrossRef] [Google Scholar]
- Kobayashi, C., Springel, V., & White, S. D. M. 2007, MNRAS, 376, 1465 [Google Scholar]
- Köppen, J., Weidner, C., & Kroupa, P. 2007, MNRAS, 375, 673 [NASA ADS] [CrossRef] [Google Scholar]
- Larson, R. B. 1974, MNRAS, 169, 229 [NASA ADS] [CrossRef] [Google Scholar]
- Larson, R. B. 1976, MNRAS, 176, 31 [NASA ADS] [CrossRef] [Google Scholar]
- Lequeux, J., Peimbert, M., Rayo, J. F., Serrano, A., & Torres-Peimbert, S. 1979, A&A, 80, 155 [NASA ADS] [Google Scholar]
- Mac Low, M. M., & Ferrara, A. 1999, ApJ, 513, 142 [NASA ADS] [CrossRef] [Google Scholar]
- Maiolino, R., Nagao, T., Grazian, A., et al. 2008, A&A, 488, 463 [NASA ADS] [CrossRef] [EDP Sciences] [Google Scholar]
- Martin, C. L., Kobulnicky, H. A., & Heckman, T. M. 2002, ApJ, 574, 663 [NASA ADS] [CrossRef] [Google Scholar]
- Matteucci, F. 1994, A&A, 288, 57 [NASA ADS] [Google Scholar]
- Matteucci, F. 2001, The Chemical Evolution of the Galaxy, ASSL (Kluwer Academic Publisher) [Google Scholar]
- Mo, H. J., Mao, S., & White, S. D. M. 1998, MNRAS, 295, 319 [Google Scholar]
- Mouhcine, M., Gibson, B. K., Renda, A., & Kawata, D. 2008, A&A, 486, 711 [NASA ADS] [CrossRef] [EDP Sciences] [Google Scholar]
- Pagel, B. E. J., & Patchett, B. E. 1975, MNRAS, 172, 13 [NASA ADS] [CrossRef] [Google Scholar]
- Pipino, A., & Matteucci, F. 2004, MNRAS, 347, 968 [NASA ADS] [CrossRef] [Google Scholar]
- Recchi, S., Matteucci, F., & D'Ercole, A. 2001, MNRAS, 322, 800 [NASA ADS] [CrossRef] [Google Scholar]
- Recchi, S., Spitoni, E., Matteucci, F., & Lanfranchi, G. A. 2008, A&A, 489, 555 [NASA ADS] [CrossRef] [EDP Sciences] [Google Scholar]
- Silk, J. 2003, MNRAS, 343, 249 [NASA ADS] [CrossRef] [MathSciNet] [Google Scholar]
- Somerville, R. S., Barden, M., Rix, H. W., et al. 2008, ApJ, 672, 776 [NASA ADS] [CrossRef] [Google Scholar]
- Tassis, K., Kravtsov, A. V., & Gnedin, N. Y. 2008, ApJ, 672, 888 [NASA ADS] [CrossRef] [Google Scholar]
- Tinsley, B. M. 1980, Fund. Cosmic Phys., 5, 287 [Google Scholar]
- Tissera, P. B., De Rossi, M. E., & Scannapieco, C. 2005, MNRAS, 364, L38 [NASA ADS] [CrossRef] [Google Scholar]
- Tremonti, C. A., Heckman, T. M., Kauffmann, G., et al. 2004, ApJ, 613, 898 [NASA ADS] [CrossRef] [Google Scholar]
- Twarog, B. 1980, ApJ, 242, 242 [NASA ADS] [CrossRef] [Google Scholar]
- Woosley, S. E., & Weaver, T. A. 1995, ApJS, 101, 181 [NASA ADS] [CrossRef] [Google Scholar]
All Tables
Table 1: Permitted values of the parameters for reproducing the MZ relation.
All Figures
|
|
Figure 1: The observed MZ relation for the oxygen (Kewley & Ellison 2008). The dashed lines are the average values and the standard deviation and the solid one is the best fit to the average values as given by Maiolino et al. (2008).The redshift of the galaxies is indicated in the top right of the figure. |
| Open with DEXTER | |
| In the text | |
|
|
Figure 2:
The gas fraction |
| Open with DEXTER | |
| In the text | |
|
|
Figure 3:
The observed MZ relation and related standard deviation as
indicated with the dotted red lines. With the green solid line we
show our closed box model results assuming for the oxygen a yield
per stellar generation of
|
| Open with DEXTER | |
| In the text | |
|
|
Figure 4:
In the lower panel we report the |
| Open with DEXTER | |
| In the text | |
|
|
Figure 5:
Upper panel: the best |
| Open with DEXTER | |
| In the text | |
|
|
Figure 6:
Case with only infall: dashed area represents the forbidden |
| Open with DEXTER | |
| In the text | |
|
|
Figure 7:
Upper panel: the best |
| Open with DEXTER | |
| In the text | |
|
|
Figure 8:
Upper panel: the best |
| Open with DEXTER | |
| In the text | |
|
|
Figure 9:
Upper panel: the best-fit values for |
| Open with DEXTER | |
| In the text | |
|
|
Figure 10:
Upper panel: the best values for |
| Open with DEXTER | |
| In the text | |
|
|
Figure 11:
Upper panel: the best values for |
| Open with DEXTER | |
| In the text | |
|
|
Figure 12:
The best-fit values for |
| Open with DEXTER | |
| In the text | |
Copyright ESO 2010
Current usage metrics show cumulative count of Article Views (full-text article views including HTML views, PDF and ePub downloads, according to the available data) and Abstracts Views on Vision4Press platform.
Data correspond to usage on the plateform after 2015. The current usage metrics is available 48-96 hours after online publication and is updated daily on week days.
Initial download of the metrics may take a while.