| Issue |
A&A
Volume 514, May 2010
Science with AKARI
|
|
|---|---|---|
| Article Number | A15 | |
| Number of page(s) | 8 | |
| Section | Extragalactic astronomy | |
| DOI | https://doi.org/10.1051/0004-6361/200913770 | |
| Published online | 03 May 2010 | |
Science with AKARI
Detection of unidentified infrared bands
in a H filament in the dwarf galaxy NGC 1569 with AKARI
T. Onaka1
- H. Matsumoto1,![]() - I. Sakon1 - H. Kaneda2
- I. Sakon1 - H. Kaneda2
1 - Department of Astronomy, Graduate School of Science, The University
of Tokyo, Bunkyo-ku, Tokyo 113-0033, Japan
2 - Graduate School of Science, Nagoya University, Chikusa-ku, Nagoya
464-8602, Japan
Received 30 November 2009 / Accepted 11 January 2010
Abstract
Context. We report the detection of unidentified
infrared (UIR) bands in a filamentary structure associated with H![]() emission
in the starburst dwarf galaxy NGC 1569 based on imaging and
spectroscopic observations of the AKARI satellite.
emission
in the starburst dwarf galaxy NGC 1569 based on imaging and
spectroscopic observations of the AKARI satellite.
Aims. We investigate the processing and destruction
of the UIR band carriers in an outflow from NGC 1569.
Methods. We performed observations of
NGC 1569 for 6 infrared bands (3.2, 4.1, 7,
11, 15, and 24 ![]() m)
with the infrared camera (IRC) onboard AKARI. Near- to mid-infrared
(2-13
m)
with the infrared camera (IRC) onboard AKARI. Near- to mid-infrared
(2-13 ![]() m)
spectroscopy of a H
m)
spectroscopy of a H![]() filament was also
carried out with the IRC.
filament was also
carried out with the IRC.
Results. The extended structure associated with
a H![]() filament
appears bright at 7
filament
appears bright at 7 ![]() m.
Since the IRC 7
m.
Since the IRC 7 ![]() m band (S7) efficiently traces
the 6.2 and 7.7
m band (S7) efficiently traces
the 6.2 and 7.7 ![]() m UIR band emission, the
IRC imaging observations suggest that the filament is bright
at the UIR band emission. Follow-up spectroscopic observations
with the IRC confirm the presence of 6.2, 7.7, and
11.3
m UIR band emission, the
IRC imaging observations suggest that the filament is bright
at the UIR band emission. Follow-up spectroscopic observations
with the IRC confirm the presence of 6.2, 7.7, and
11.3 ![]() m
emission in the filament. The filament spectrum exhibits strong
11.3
m
emission in the filament. The filament spectrum exhibits strong
11.3 ![]() m
UIR band emission relative to the 7.7
m
UIR band emission relative to the 7.7 ![]() m band
compared to the galaxy disk observed with the infrared spectrograph on Spitzer.
The near-infrared spectrum also suggests the presence of excess
continuum emission in 2.5-5
m band
compared to the galaxy disk observed with the infrared spectrograph on Spitzer.
The near-infrared spectrum also suggests the presence of excess
continuum emission in 2.5-5 ![]() m in the filament.
m in the filament.
Conclusions. The presence of the UIR bands
associated with a H![]() filament
is found by AKARI/IRC observations. The H
filament
is found by AKARI/IRC observations. The H![]() filament is thought
to have been formed by the galactic outflow originating from the
star-formation activity in the disk of NGC 1569. The
destruction timescale of the UIR band carriers in the outflow
is estimated to be much shorter (
filament is thought
to have been formed by the galactic outflow originating from the
star-formation activity in the disk of NGC 1569. The
destruction timescale of the UIR band carriers in the outflow
is estimated to be much shorter (![]()
![]() 103 yr)
than the timescale of the outflow (
103 yr)
than the timescale of the outflow (![]() Myr). Thus it is
unlikely that the band carriers survive the outflow environment.
Alternatively, we suggest that the band carriers in the filaments may
be produced by the fragmentation of large carbonaceous grains in
shocks, which produce the H
Myr). Thus it is
unlikely that the band carriers survive the outflow environment.
Alternatively, we suggest that the band carriers in the filaments may
be produced by the fragmentation of large carbonaceous grains in
shocks, which produce the H![]() emission.
The NIR excess continuum emission cannot be accounted for by
free-free emission alone and a hot dust contribution may be needed,
although the free-free emission intensity estimated from H I recombination
lines has a large uncertainty.
emission.
The NIR excess continuum emission cannot be accounted for by
free-free emission alone and a hot dust contribution may be needed,
although the free-free emission intensity estimated from H I recombination
lines has a large uncertainty.
Key words: galaxies: ISM - infrared: galaxies - dust, extinction - galaxies: individual: NGC 1569
1 Introduction
From the near-infrared (NIR) to mid-infrared (MIR) region,
a set of prominent emission features at 3.3, 3.4,
6.2, 7.7, 8.6, and 11.3 ![]() m are detected for the various celestial objects.
Faint companion bands are also present in the 5-13
m are detected for the various celestial objects.
Faint companion bands are also present in the 5-13 ![]() m spectral
range. They are often called the unidentified infrared
(UIR) bands because of the difficulty in identifying the band
carriers at an early epoch of their discovery. Space observations have
added the 17
m spectral
range. They are often called the unidentified infrared
(UIR) bands because of the difficulty in identifying the band
carriers at an early epoch of their discovery. Space observations have
added the 17 ![]() m
feature complex to
the UIR band family (Werner et al. 2004; van Kerckhoven
et al. 2000). The UIR bands have been
observed in H II regions,
reflection nebulae, post-asymptotic giant branch (AGB) stars, and
planetary nebulae (PNe) (e.g., Peeters
et al. 2002). They are also ubiquitously seen in the
diffuse Galactic radiation (Mattila et al. 1996; Onaka 2004;
Giard
et al. 1988; Onaka et al. 1996; Tanaka
et al. 1996) as well as in external galaxies (Lu et al. 2003;
Smith
et al. 2007a; Helou et al. 2000),
suggesting that the band carriers belong to major constituents of the
interstellar matter (e.g., Draine
et al. 2007). Since their intensity is found to be
well correlated with the far-infrared (FIR) intensity and can thus be
used as a useful measure of the star-formation activity (Onaka 2000;
Peeters
et al. 2004), and they are prominent features in the
MIR that can be detected even in distant galaxies (e.g., Lutz et al. 2005), the
understanding of the properties as well as the formation and
destruction processes in the interstellar space of the band carriers is
significant not only to the study of the interstellar
medium (ISM), but also to the study of physical conditions and
star-formation activities in the remote universe.
m
feature complex to
the UIR band family (Werner et al. 2004; van Kerckhoven
et al. 2000). The UIR bands have been
observed in H II regions,
reflection nebulae, post-asymptotic giant branch (AGB) stars, and
planetary nebulae (PNe) (e.g., Peeters
et al. 2002). They are also ubiquitously seen in the
diffuse Galactic radiation (Mattila et al. 1996; Onaka 2004;
Giard
et al. 1988; Onaka et al. 1996; Tanaka
et al. 1996) as well as in external galaxies (Lu et al. 2003;
Smith
et al. 2007a; Helou et al. 2000),
suggesting that the band carriers belong to major constituents of the
interstellar matter (e.g., Draine
et al. 2007). Since their intensity is found to be
well correlated with the far-infrared (FIR) intensity and can thus be
used as a useful measure of the star-formation activity (Onaka 2000;
Peeters
et al. 2004), and they are prominent features in the
MIR that can be detected even in distant galaxies (e.g., Lutz et al. 2005), the
understanding of the properties as well as the formation and
destruction processes in the interstellar space of the band carriers is
significant not only to the study of the interstellar
medium (ISM), but also to the study of physical conditions and
star-formation activities in the remote universe.
While it is generally thought that the UIR bands originate in emitters or emitting atomic groups containing polycyclic aromatic hydrocarbons (PAHs) or PAH-like atomic groups of carbonaceous materials (Sakata et al. 1984; Allamandola et al. 1985; Papoular et al. 1989; Léger & Puget 1984), the exact nature, formation, and destruction of the band carriers are not yet fully understood (see Tielens 2008, for a recent review). Carbon-rich AGB stars are thought to be one of the major sources of the band carriers (Latter 1991; Galliano et al. 2008a; Cherchneff et al. 1992; Frenklach & Feigelson 1989). The carriers may also be formed by the fragmentation of large carbonaceous grains (Greenberg et al. 2000; Omont 1986; Jones et al. 1996) or in situ within dense clouds (Herbst 1991). On the other hand, the carriers can be destroyed efficiently by interstellar shocks (Jones et al. 1996) and within ionized gas (e.g., Matsumoto et al. 2008, references therein). Few observational studies have, however, so far been carried out for the life cycle of the band carriers in the ISM.
Peeters et al.
(2002) show that there are at least three distinct classes of
UIR-band objects present as far as the peak wavelengths of
the 6.2, 7.7, and 8.6 ![]() m MIR UIR bands are concerned.
Class A objects, to which H II regions
and isolated Herbig Ae/Be stars belong, show the band
peaks at short wavelengths relative to
Class B objects, which include PNe and
post-AGB stars. Class C objects exhibit
quite different spectra compared to class A and
B objects. The variation in the peak wavelengths suggests
possible processing of the band carriers in the ISM. The origin of the
difference between class A and B objects may be
attributed to the inclusion of hetero atoms (Peeters
et al. 2002) or carbon isotopes in the band carriers
(Wada et al. 2003).
On the other hand, the UIR band spectrum observed in the
diffuse Galactic radiation does not exhibit any systematic variations
in the inner part of the Galaxy (Kahanpää et al. 2003; Chan et al.
2001), whereas Sakon
et al. (2004) detected small variations in the band
ratio and the peak wavelength between the inner part of the Galaxy and
the outer part. Variations in the band spectra of external galaxies and
within a given galaxy are also generally small (e.g., Smith
et al. 2007a; Gordon et al. 2008).
Studies, however, indicate that elliptical galaxies show
UIR band spectra very different from those in spiral galaxies,
where the usually strong MIR UIR bands
(6.2, 7.7, and 8.6
m MIR UIR bands are concerned.
Class A objects, to which H II regions
and isolated Herbig Ae/Be stars belong, show the band
peaks at short wavelengths relative to
Class B objects, which include PNe and
post-AGB stars. Class C objects exhibit
quite different spectra compared to class A and
B objects. The variation in the peak wavelengths suggests
possible processing of the band carriers in the ISM. The origin of the
difference between class A and B objects may be
attributed to the inclusion of hetero atoms (Peeters
et al. 2002) or carbon isotopes in the band carriers
(Wada et al. 2003).
On the other hand, the UIR band spectrum observed in the
diffuse Galactic radiation does not exhibit any systematic variations
in the inner part of the Galaxy (Kahanpää et al. 2003; Chan et al.
2001), whereas Sakon
et al. (2004) detected small variations in the band
ratio and the peak wavelength between the inner part of the Galaxy and
the outer part. Variations in the band spectra of external galaxies and
within a given galaxy are also generally small (e.g., Smith
et al. 2007a; Gordon et al. 2008).
Studies, however, indicate that elliptical galaxies show
UIR band spectra very different from those in spiral galaxies,
where the usually strong MIR UIR bands
(6.2, 7.7, and 8.6 ![]() m) are weak or absent, but the 11.3
m) are weak or absent, but the 11.3 ![]() m
band is clearly present (Kaneda
et al. 2005). The 3.3
m
band is clearly present (Kaneda
et al. 2005). The 3.3 ![]() m band seems also to be absent in the elliptical
galaxy NGC 1316, which exhibits the 11.3
m band seems also to be absent in the elliptical
galaxy NGC 1316, which exhibits the 11.3 ![]() m band (Kaneda et al. 2007). The
weak MIR UIR bands relative to that at 11.3
m band (Kaneda et al. 2007). The
weak MIR UIR bands relative to that at 11.3 ![]() m are also
seen in galaxies that harbor a low-luminosity active galactic nucleus
(AGN, Smith et al. 2007a),
some of which are also elliptical galaxies.
Smaller scale variations in the same sense have also been detected in
the interarm region of NGC 6946 (Sakon
et al. 2007) and halo regions of galaxies (Galliano
et al. 2008b; Irwin & Madden 2006),
suggesting that a common mechanism changes the band ratio (Onaka et al. 2008).
Weak MIR UIR bands may be seen in tenuous plasma
environments. Processing of the band carriers in these environments may
be responsible for the variation.
m are also
seen in galaxies that harbor a low-luminosity active galactic nucleus
(AGN, Smith et al. 2007a),
some of which are also elliptical galaxies.
Smaller scale variations in the same sense have also been detected in
the interarm region of NGC 6946 (Sakon
et al. 2007) and halo regions of galaxies (Galliano
et al. 2008b; Irwin & Madden 2006),
suggesting that a common mechanism changes the band ratio (Onaka et al. 2008).
Weak MIR UIR bands may be seen in tenuous plasma
environments. Processing of the band carriers in these environments may
be responsible for the variation.
The UIR bands in low-metallicity dwarf galaxies are important
to study because their characteristics may represent very young
galaxies and the band carriers may not be fully developed in these
environments if carbon-rich AGB stars are the main source of
the carriers (Galliano
et al. 2008b). The UIR bands are very weak
or almost absent in dwarf galaxies that have metallicities ![]()
![]() 8.1
(Engelbracht et al. 2008).
Since these low-metallicity dwarf galaxies are also known to be
associated with high star-formation activities, the deficiency
in the UIR bands in low metallicity environments can be
attributed to low carrier formation efficiency at low metallicity,
rapid destruction of the band carriers by strong radiation fields (Wu et al. 2006,2007),
frequent supernova shock passages that destroy the carriers (O'Halloran et al. 2006),
or deficiency in carbon-rich AGB stars that produce
the carriers in young galaxies (Galliano
et al. 2008b).
8.1
(Engelbracht et al. 2008).
Since these low-metallicity dwarf galaxies are also known to be
associated with high star-formation activities, the deficiency
in the UIR bands in low metallicity environments can be
attributed to low carrier formation efficiency at low metallicity,
rapid destruction of the band carriers by strong radiation fields (Wu et al. 2006,2007),
frequent supernova shock passages that destroy the carriers (O'Halloran et al. 2006),
or deficiency in carbon-rich AGB stars that produce
the carriers in young galaxies (Galliano
et al. 2008b).
In this paper, we report the results of infrared imaging and
spectroscopic observations of the low-metallicity dwarf galaxy
NGC 1569 with the infrared camera (IRC)
onboard AKARI (Murakami
et al. 2007; Onaka et al. 2007b).
NGC 1569 is a nearby starburst dwarf galaxy of metallicity of
about a quarter of solar, i.e., its values of ![]() range from 8.19 to 8.37 (Greggio
et al. 1998, references therein). Hubble
space telescope observations indicate that it is located in
the IC 342 group of galaxies at a distance of 3.36
range from 8.19 to 8.37 (Greggio
et al. 1998, references therein). Hubble
space telescope observations indicate that it is located in
the IC 342 group of galaxies at a distance of 3.36 ![]() 0.20 Mpc
(Grocholski et al. 2008).
Several filamentary structures that extend out to 1 kpc have
been detected in H
0.20 Mpc
(Grocholski et al. 2008).
Several filamentary structures that extend out to 1 kpc have
been detected in H![]() (Westmoquette
et al. 2007a,2008; Heckman et al. 1995; Martin 1998;
Westmoquette
et al. 2007b; Hunter et al. 1993).
Associated X-ray emission has also been detected, suggesting that these
filaments are formed by the galactic
outflow (Martin et al. 2002).
NGC 1569 has two well-known super-star clusters (SSCs) and
numerous compact clusters (Hunter
et al. 2000). Some remain deeply embedded in dense
clouds (Tokura et al. 2006).
NGC 1569 has probably experienced three major epochs of star
formation over the entire galaxy that peaked at 5-27, 32-100,
and
(Westmoquette
et al. 2007a,2008; Heckman et al. 1995; Martin 1998;
Westmoquette
et al. 2007b; Hunter et al. 1993).
Associated X-ray emission has also been detected, suggesting that these
filaments are formed by the galactic
outflow (Martin et al. 2002).
NGC 1569 has two well-known super-star clusters (SSCs) and
numerous compact clusters (Hunter
et al. 2000). Some remain deeply embedded in dense
clouds (Tokura et al. 2006).
NGC 1569 has probably experienced three major epochs of star
formation over the entire galaxy that peaked at 5-27, 32-100,
and ![]() 2000 Myr
ago (Grocholski
et al. 2008; Greggio et al. 1998; Angeretti
et al. 2005). Shock-ionized gas appears to be
detected (Buckalew
et al. 2000; Buckalew & Kobulnicky 2006),
which is indicative of recent star-formation activity (Westmoquette et al. 2007b).
The H I inflow stream may have
interacted with the galaxy disk in the region of a velocity-crowding
``hot spot'' and triggered the star formation (Stil &
Israel 1998; Mühle
et al. 2005).
2000 Myr
ago (Grocholski
et al. 2008; Greggio et al. 1998; Angeretti
et al. 2005). Shock-ionized gas appears to be
detected (Buckalew
et al. 2000; Buckalew & Kobulnicky 2006),
which is indicative of recent star-formation activity (Westmoquette et al. 2007b).
The H I inflow stream may have
interacted with the galaxy disk in the region of a velocity-crowding
``hot spot'' and triggered the star formation (Stil &
Israel 1998; Mühle
et al. 2005).
The metallicity of NGC 1569 is slightly above the threshold for the presence of UIR bands. ISOCAM observations of NGC 1569 show that the entire galaxy disk is dominated by UIR band emission (Madden et al. 2006), although it is weak or absent locally around SSCs and H II regions (Tokura et al. 2006). To investigate the distribution and possible spatial variations in the UIR bands in NGC 1569, imaging and spectroscopic observations were executed with AKARI as part of the mission program ``ISM in our Galaxy and Nearby Galaxies'' (ISMGN: Kaneda et al. 2009a). The observations and the data reduction are described in Sect. 2 and the results are presented in Sect. 3. The origin of the UIR band carriers is discussed in Sect. 4. A summary is given in Sect. 5.
2 Observations and data reduction
IRC imaging observations of NGC 1569 were carried out on
2006 September 9 in the two-filter mode (AOT: IRC02, Onaka et al. 2007b). The
size of the galaxy is a few arcminutes. Owing to the wide field-of-view
of the IRC (
![]()
![]()
![]() ),
one pointing observation covers the entire galaxy. With two
pointing observations, we obtained images in the 6 bands
N3 (3.2
),
one pointing observation covers the entire galaxy. With two
pointing observations, we obtained images in the 6 bands
N3 (3.2 ![]() m),
N4 (4.1
m),
N4 (4.1 ![]() m),
S7 (7.0
m),
S7 (7.0 ![]() m),
S11 (11.0
m),
S11 (11.0 ![]() m),
L15 (15.0
m),
L15 (15.0 ![]() m),
and L24 (24.0
m),
and L24 (24.0 ![]() m) because the
NIR (N3 and N4) and the
MIR-S (S7 and S11) channels share the
field-of-view and observe the same area of sky at the same time. The
MIR-L (L15 and L24) observes a sky
about
m) because the
NIR (N3 and N4) and the
MIR-S (S7 and S11) channels share the
field-of-view and observe the same area of sky at the same time. The
MIR-L (L15 and L24) observes a sky
about
![]() from the NIR/MIR-S.
from the NIR/MIR-S.
Spectroscopic observations were carried out with AOT IRC04
with the NIR and MIR-S slit mode (Ns), whose width is 5
![]() and length is about 1
and length is about 1![]() ,
for 1.8-13.4
,
for 1.8-13.4 ![]() m.
The center of the slit was placed at the position of a H
m.
The center of the slit was placed at the position of a H![]() filament,
where the presence of the UIR bands was
inferred from the imaging observations (see Table 2 and
Fig. 2b).
The spectrum consists of 3 segments. The spectrum of
1.8-5.5
filament,
where the presence of the UIR bands was
inferred from the imaging observations (see Table 2 and
Fig. 2b).
The spectrum consists of 3 segments. The spectrum of
1.8-5.5 ![]() m
was taken with the prism (NP) in the NIR channel, while the
spectra of 4.6-9.2
m
was taken with the prism (NP) in the NIR channel, while the
spectra of 4.6-9.2 ![]() m
and 7.2-13.4
m
and 7.2-13.4 ![]() m
were taken with two grisms, SG1 and SG2, in the MIR-S, respectively.
Table 1
summarizes the observation log.
m
were taken with two grisms, SG1 and SG2, in the MIR-S, respectively.
Table 1
summarizes the observation log.
Table 1: IRC observation log of NGC 1569.
The imaging data were processed with the IRC imaging toolkit
version 20071017, which includes linearity correction, dark
current subtraction, flat-fielding, correction for the image
distortion,
and coaddition of dithered images. The toolkit algorithm produces final
images with the pixel field-of-view of
![]() for N3 and N4,
for N3 and N4, ![]() for S7
and S11, and
for S7
and S11, and
![]() for L15 and L24. The images produced by the toolkit
were processed by our own software. The original images are in the
array coordinates. An area of
for L15 and L24. The images produced by the toolkit
were processed by our own software. The original images are in the
array coordinates. An area of ![]()
![]()
![]() is extracted in the equatorial coordinates and then smoothed with a
Gaussian of FWHM
is extracted in the equatorial coordinates and then smoothed with a
Gaussian of FWHM
![]() for the N3 and N4 images and
for the N3 and N4 images and
![]() for the other 4 bands to adjust the spatial resolution with
respect to each other without appreciable degradation of the image
quality in each band (Onaka
et al. 2007b). The contribution from the stellar
photospheric emission is subtracted except for the N3 image,
which is used as a reference after subtracting the constant sky
background. The flux ratio relative to N3 in units of ADU is estimated
for the average stellar spectrum based on the fluxes of red giant stars
used in the flux calibration as 0.69, 0.073, 0.050, 0.0098,
and 0.0017 for N4, S7, S11, L15, and L24, respectively (Tanabé et al. 2008). The
stellar flux subtraction is important only in the galactic disk region
and does not make a significant effect except for
the N4 image.
for the other 4 bands to adjust the spatial resolution with
respect to each other without appreciable degradation of the image
quality in each band (Onaka
et al. 2007b). The contribution from the stellar
photospheric emission is subtracted except for the N3 image,
which is used as a reference after subtracting the constant sky
background. The flux ratio relative to N3 in units of ADU is estimated
for the average stellar spectrum based on the fluxes of red giant stars
used in the flux calibration as 0.69, 0.073, 0.050, 0.0098,
and 0.0017 for N4, S7, S11, L15, and L24, respectively (Tanabé et al. 2008). The
stellar flux subtraction is important only in the galactic disk region
and does not make a significant effect except for
the N4 image.
The flux calibration of the IRC for point sources is more accurate than 10% for all the photometric bands (Tanabé et al. 2008), though the calibration for the diffuse emission is still underway. The uncertainty of about 30% is expected for the absolute calibration for the diffuse emission because the IRC uses the same types of detector arrays as the IRAC on Spitzer (Cohen et al. 2007; Reach et al. 2005). Since the relative flux has a far smaller uncertainty, the following discussion focuses on the relative fluxes among the bands or colors rather than on the absolute flux values.
The spectroscopic data were processed with the
IRC spectroscopy toolkit version 20090211. Each
segment of the spectrum was truncated at the wavelengths where the
signal-to-noise ratio becomes low: NP was truncated at 2.3
and 5.0 ![]() m,
SG1 at 5.5 and 8.2
m,
SG1 at 5.5 and 8.2 ![]() m, and SG2 at 8.0
and 13.2
m, and SG2 at 8.0
and 13.2 ![]() m.
The accurate position at which the spectrum was taken was estimated for
the reference image of N3 obtained during the same pointing
observation. The original spectrum has contributions from
NGC 1569, the diffuse Galactic emission, and the zodiacal
light. Since we did not perform separate observations to obtain the
background spectrum, we chose a ``sky'' on the slit near the
edge, where the contribution of NGC 1569 is minimal, and
subtracted the sky spectrum from the ``filament'' spectrum.
Table 2
summarizes the center positions where the spectra of the filament and
sky were extracted (see also Fig. 2b). The pixel
scale was different between the NIR and MIR-S channels. The
spectra were extracted for a slit length of 5 and
3 pixels (
m.
The accurate position at which the spectrum was taken was estimated for
the reference image of N3 obtained during the same pointing
observation. The original spectrum has contributions from
NGC 1569, the diffuse Galactic emission, and the zodiacal
light. Since we did not perform separate observations to obtain the
background spectrum, we chose a ``sky'' on the slit near the
edge, where the contribution of NGC 1569 is minimal, and
subtracted the sky spectrum from the ``filament'' spectrum.
Table 2
summarizes the center positions where the spectra of the filament and
sky were extracted (see also Fig. 2b). The pixel
scale was different between the NIR and MIR-S channels. The
spectra were extracted for a slit length of 5 and
3 pixels (
![]() and
and
![]() )
for the NIR and MIR-S, respectively, and averaged. We note that even
for the SG1 and SG2 spectra the observed position was slightly
different because the SG1 and SG2 grisms did not produce the
same optical path. The SG1 spectra were smoothed by taking a
moving average over 4 pixels in the spectral direction to
increase the signal-to-noise ratio without significant degradation of
the spectral resolution. The SG2 spectra were smoothed by
a 3-pixel moving average. The NP spectrum of the
filament longer than 4.3
)
for the NIR and MIR-S, respectively, and averaged. We note that even
for the SG1 and SG2 spectra the observed position was slightly
different because the SG1 and SG2 grisms did not produce the
same optical path. The SG1 spectra were smoothed by taking a
moving average over 4 pixels in the spectral direction to
increase the signal-to-noise ratio without significant degradation of
the spectral resolution. The SG2 spectra were smoothed by
a 3-pixel moving average. The NP spectrum of the
filament longer than 4.3 ![]() m was smoothed by taking a 2-pixel running
average, while that shortward of 4.3
m was smoothed by taking a 2-pixel running
average, while that shortward of 4.3 ![]() m was not smoothed to prevent decreasing the
spectral resolution since NP spectra have lower resolution at
shorter wavelengths. These smoothing processes produced a spectral
resolution (
m was not smoothed to prevent decreasing the
spectral resolution since NP spectra have lower resolution at
shorter wavelengths. These smoothing processes produced a spectral
resolution (
![]() )
of about 30 at the central wavelength of each segment. The raw
sky spectrum of NP had a low signal-to-noise ratio and was smoothed by
a 5-pixel moving average in the wavelength direction based on
the assumption
that the sky spectrum did not have significant features.
)
of about 30 at the central wavelength of each segment. The raw
sky spectrum of NP had a low signal-to-noise ratio and was smoothed by
a 5-pixel moving average in the wavelength direction based on
the assumption
that the sky spectrum did not have significant features.
Table 2: Positions of the spectrum extracted.
![\begin{figure}
\par\includegraphics[width=18cm,clip]{13770fg1.eps}
\end{figure}](/articles/aa/full_html/2010/06/aa13770-09/img34.png)
|
Figure 1:
AKARI/IRC 6-band images of NGC 1569. The image size is |
| Open with DEXTER | |
3 Results
3.1 Imaging
Figure 1
shows IRC 6-band images of NGC 1569. Uniform sky background
was subtracted from all the images. The N3 and
N4 images exhibit similar structures, in which stellar
contributions are dominant. The appearance of the galaxy drastically
changes from the S7 image.
The emission in the N3 and N4 images is dominated by
the stellar radiation, whereas the emission longer than the S7
arises dominantly from the interstellar matter of the galaxy.
The S7 image
clearly resolves two peaks seen in ISOCAM observations (Madden et al. 2006) and
indicates spotty structures in the galaxy disk. The western peak is
located at the slightly western side of SSC A
(e.g., Hunter et al. 2000).
The hot spot or the region of velocity crowding, which is
seen in the H I map and suggested
as the impact location of the infalling gas onto the galaxy disk (Mühle et al. 2005), is
located further west of the western MIR peak.
The S7 band consists of major MIR UIR band
emission (6.2, 7.7, and 8.2 ![]() m bands) and thus traces the UIR band
emission efficiently (Ishihara
et al. 2007). Both the 11.3
m bands) and thus traces the UIR band
emission efficiently (Ishihara
et al. 2007). Both the 11.3 ![]() m
UIR band and continuum emission could make a significant
contribution to the S11 image. The continuum emission
dominates in the L15 and L24 bands, which traces regions
active in star formation (e.g. Onaka et al. 2007a; Draine
et al. 2007).
NGC 1569 contains a number of SSCs and thus the L15 and
L24 bands are probably dominated by the contribution of the
emission from active star-forming regions. The disk emission
in S7 is dominated
by the UIR emission. A filamentary structure also
extends from the western edge of the galaxy disk to the south in the
S7 image. This filament is also detected in the
S11 image. In the L15 and
L24 images, the disk emission becomes smoother, whereas the
diffuse emission appears to extend to the north-east direction.
A faint trace of the filamentary structure can be discerned,
but it is not as clear as in the S7 and
S11 images.
m
UIR band and continuum emission could make a significant
contribution to the S11 image. The continuum emission
dominates in the L15 and L24 bands, which traces regions
active in star formation (e.g. Onaka et al. 2007a; Draine
et al. 2007).
NGC 1569 contains a number of SSCs and thus the L15 and
L24 bands are probably dominated by the contribution of the
emission from active star-forming regions. The disk emission
in S7 is dominated
by the UIR emission. A filamentary structure also
extends from the western edge of the galaxy disk to the south in the
S7 image. This filament is also detected in the
S11 image. In the L15 and
L24 images, the disk emission becomes smoother, whereas the
diffuse emission appears to extend to the north-east direction.
A faint trace of the filamentary structure can be discerned,
but it is not as clear as in the S7 and
S11 images.
Figure 2a
presents a three-band color image (N4, S7, and L15),
which indicates that
the filamentary structure is indeed bright in the S7 band
(green) and there is no appreciable associated stellar component
(blue). This structure corresponds to the western arm or
filament 6 recognized in H![]() images (Hodge 1974;
Westmoquette
et al. 2008; Hunter et al. 1993). The
associated X-ray emission strongly infers that the filament was formed
by the shock of a galactic outflow originating in the
SSC A region of the disk (Martin 1998; Martin
et al. 2002; Greve et al. 2002).
Figure 2b
shows the S7 image superimposed on the H
images (Hodge 1974;
Westmoquette
et al. 2008; Hunter et al. 1993). The
associated X-ray emission strongly infers that the filament was formed
by the shock of a galactic outflow originating in the
SSC A region of the disk (Martin 1998; Martin
et al. 2002; Greve et al. 2002).
Figure 2b
shows the S7 image superimposed on the H![]() emission in contours
(Hunter & Elmegreen 2004).
It shows good agreement between the S7 and H
emission in contours
(Hunter & Elmegreen 2004).
It shows good agreement between the S7 and H![]() emission
of the filament in position and suggests that the entire
S7 emission may be more extended than the H
emission
of the filament in position and suggests that the entire
S7 emission may be more extended than the H![]() emission
around the galaxy. It can also be seen that the
S7 emission of the filament is located at a slightly western
side of the H
emission
around the galaxy. It can also be seen that the
S7 emission of the filament is located at a slightly western
side of the H![]() emission.
Since the X-ray emission peaks at the eastern side of the H
emission.
Since the X-ray emission peaks at the eastern side of the H![]() filament
(Martin et al. 2002),
the peak of the emission is close in position to that of the
X-ray, H
filament
(Martin et al. 2002),
the peak of the emission is close in position to that of the
X-ray, H![]() ,
and 7
,
and 7 ![]() m
emission from east to west.
m
emission from east to west.
![\begin{figure}
\par\includegraphics[width=17.5cm,clip]{13770fg2.eps}
\end{figure}](/articles/aa/full_html/2010/06/aa13770-09/img35.png)
|
Figure 2:
a) Artificial 3-color image of
NGC 1569. The N4 in blue, S7 in green,
and L15 in red. b) S7 image
of NGC 1569 superimposed with contours in a logarithmic scale
of the H |
| Open with DEXTER | |
A similarity between the S7 and S11 images infers that the
11.3 ![]() m
band emission is also bright in the filament. The present imaging
observations appear to detect both UIR bands in the H
m
band emission is also bright in the filament. The present imaging
observations appear to detect both UIR bands in the H![]() filament
and an extended component around NGC 1569. The H
filament
and an extended component around NGC 1569. The H![]() filament
is probably formed by the outflow associated with the X-ray emission,
suggesting that the UIR band emission is also enhanced by the
outflow. We carried out spectroscopic observations of the filament to
confirm
the presence of the UIR bands.
filament
is probably formed by the outflow associated with the X-ray emission,
suggesting that the UIR band emission is also enhanced by the
outflow. We carried out spectroscopic observations of the filament to
confirm
the presence of the UIR bands.
3.2 Spectroscopy
Figure 3
shows AKARI/IRC spectra taken at the position of the H![]() filament.
The NP spectroscopy clearly shows the continuum
emission at the filament position over the background (Fig. 3a).
It cannot be accounted for by photospheric emission from
stars, which should decrease far more sharply towards longer
wavelengths. The NP spectrum also exhibits the
3.3
filament.
The NP spectroscopy clearly shows the continuum
emission at the filament position over the background (Fig. 3a).
It cannot be accounted for by photospheric emission from
stars, which should decrease far more sharply towards longer
wavelengths. The NP spectrum also exhibits the
3.3 ![]() m
UIR band. Two spiky features at 3.75 and
4.05
m
UIR band. Two spiky features at 3.75 and
4.05 ![]() m
may be H I recombination lines
of Pf
m
may be H I recombination lines
of Pf![]() and Br
and Br![]() ,
but the low spectral resolution of NP, even in the unsmoothed
spectrum, makes clear identification difficult. If these are H
I recombination lines, there should
be a Pf
,
but the low spectral resolution of NP, even in the unsmoothed
spectrum, makes clear identification difficult. If these are H
I recombination lines, there should
be a Pf![]() line
at 3.3
line
at 3.3 ![]() m
that overlaps with the UIR band. Its intensity is
roughly 0.7
m
that overlaps with the UIR band. Its intensity is
roughly 0.7 ![]() Pf
Pf![]() for the case B condition with the
electron temperature of 104 K and
density of 104 cm-3.
Thus, even if the contribution of Pf
for the case B condition with the
electron temperature of 104 K and
density of 104 cm-3.
Thus, even if the contribution of Pf![]() is taken into account, the presence of the 3.3
is taken into account, the presence of the 3.3 ![]() m
UIR band is secure.
m
UIR band is secure.
![\begin{figure}
\par\includegraphics[width=17.5cm,clip]{13770fg3.eps}
\end{figure}](/articles/aa/full_html/2010/06/aa13770-09/img38.png)
|
Figure 3:
AKARI/IRC spectra of the H |
| Open with DEXTER | |
The SG1 and SG2 spectra are dominated by the zodiacal emission, which
steeply increases towards longer wavelengths (Figs. 3b
and 3c).
The level of the sky background emission is in good agreement with the
estimated zodiacal light intensity from COBE observations (Kelsall et al. 1998).
The sky-subtracted SG1 and SG2 spectra do not show a steep
rise
towards longer wavelengths, implying that star formation is not very
active in the filament (Onaka
et al. 2007a). The sky spectra also appear to
contain UIR bands, which can be attributed partly to the
foreground Galactic emission. There may also be a contribution from the
emission of NGC 1569 (see Fig. 2b). Thus the
sky-subtracted filament spectra may underestimate the
emission from the filament. According to the investigation by Sakon et al. (2004), the
contribution of the Galactic emission to the UIR bands is
estimated approximately from the FIR intensity about the
position of NGC 1569. The contribution to the observed
UIR band emission is estimated to be about 30-70% from the
FIR intensity of 40 and 70 MJy sr-1
at 100 and 140 ![]() m, respectively.
This number is compatible with the UIR band emission in the
sky spectrum. The background-subtracted spectra clearly exhibits the
UIR bands at 6.2, 7.7, and 11.3
m, respectively.
This number is compatible with the UIR band emission in the
sky spectrum. The background-subtracted spectra clearly exhibits the
UIR bands at 6.2, 7.7, and 11.3 ![]() m in the
filament, confirming that the structures seen in the S7 and
S11 images are dominated by the UIR band emission.
The 8.6
m in the
filament, confirming that the structures seen in the S7 and
S11 images are dominated by the UIR band emission.
The 8.6 ![]() m
UIR band is faint and is not detected by the present spectra.
m
UIR band is faint and is not detected by the present spectra.
![\begin{figure}
\par\includegraphics[width=17cm,clip]{13770fg4.eps}
\end{figure}](/articles/aa/full_html/2010/06/aa13770-09/img39.png)
|
Figure 4:
a) IRC spectrum of the filament of
NGC 1569 (thin line) and the fitted line (thick line).
b) IRS spectrum of the disk of
NGC 1569 (thin line) and the fitted line (thick line). Sharp
lines not fitted are ionic forbidden lines ([Ar
III] 9.0 |
| Open with DEXTER | |
4 Discussion
4.1 UIR bands in the filament
The present observations detect the UIR bands associated with
a H![]() filament
in NGC 1569. Both FIR and UIR band emission has been
detected in outflows or halo regions of several galaxies. Very extended
UIR band emission has been detected in the outflow from
M 82 (Engelbracht
et al. 2006; Kaneda et al. 2010).
The 3.3
filament
in NGC 1569. Both FIR and UIR band emission has been
detected in outflows or halo regions of several galaxies. Very extended
UIR band emission has been detected in the outflow from
M 82 (Engelbracht
et al. 2006; Kaneda et al. 2010).
The 3.3 ![]() m
UIR band emission associated with the outflow has been
detected in NGC 253 (Tacconi-Garman
et al. 2005), in which emission further
away from the galaxy has been detected in the FIR (Kaneda et al. 2009b).
The UIR band emission from the galactic halo has also
been detected for several galaxies based on ISOCAM observations (Galliano
et al. 2008b; Irwin & Madden 2006; Irwin
et al. 2007), which indicates that the band ratio of
either 6.2 or 7.7
m
UIR band emission associated with the outflow has been
detected in NGC 253 (Tacconi-Garman
et al. 2005), in which emission further
away from the galaxy has been detected in the FIR (Kaneda et al. 2009b).
The UIR band emission from the galactic halo has also
been detected for several galaxies based on ISOCAM observations (Galliano
et al. 2008b; Irwin & Madden 2006; Irwin
et al. 2007), which indicates that the band ratio of
either 6.2 or 7.7 ![]() m to the 11.3
m to the 11.3 ![]() m band emission becomes lower in the halo than in
the disk region.
m band emission becomes lower in the halo than in
the disk region.
To investigate the UIR band ratio in the filament of
NGC 1569, the spectrum is fitted with a combination
of a continuum emission and Lorentzians given by
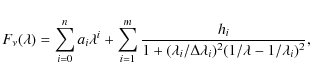
where
The band strength Si
is calculated by integrating the Lorentzian in the wavenumber space and
is given by

|
(2) |
Table 3 summarizes the band strength relative to the 11.3
Table 3:
UIR band strength ratio relative to the 11.3 ![]() m band.
m band.
To compare with the UIR bands in the disk, spectra of the
NGC 1569 disk taken with the infrared
spectrograph (IRS) on Spitzer in the low
resolution modules were retrieved from the archival database (AOR key
9001984; Tajiri et al. 2008).
The IRS spectra taken at the position near
SSC A (RA: 04![]() 30
30![]() 48
48
![]() 17
Dec: +64
17
Dec: +64![]() 50
50![]() 54
54
![]() 2)
were extracted. The IRS spectrum is fit with Eq. (1) in the same
manner as the filament spectrum except that the 8.6
2)
were extracted. The IRS spectrum is fit with Eq. (1) in the same
manner as the filament spectrum except that the 8.6 ![]() m band is
included. The IRS spectrum and the fitted spectrum are also
shown in Fig. 4
and the relative band ratios are summarized in Table 3. The relative
strength of the 6.2
m band is
included. The IRS spectrum and the fitted spectrum are also
shown in Fig. 4
and the relative band ratios are summarized in Table 3. The relative
strength of the 6.2 ![]() m
band in the filament seems to be slightly greater than in the disk.
However, the 6.2
m
band in the filament seems to be slightly greater than in the disk.
However, the 6.2 ![]() m
band strength of the filament has a large uncertainty and it is
difficult to draw conclusions about the comparison with the disk
spectrum. The relative strength of the 7.7
m
band strength of the filament has a large uncertainty and it is
difficult to draw conclusions about the comparison with the disk
spectrum. The relative strength of the 7.7 ![]() m band is
clearly weaker in the filament than in the galaxy disk. This is the
same trend
as derived from photometric measurements of halo regions of other
galaxies (Galliano
et al. 2008b; Irwin & Madden 2006).
The 7.7 to 11.3
m band is
clearly weaker in the filament than in the galaxy disk. This is the
same trend
as derived from photometric measurements of halo regions of other
galaxies (Galliano
et al. 2008b; Irwin & Madden 2006).
The 7.7 to 11.3 ![]() m band ratio of the IRS spectrum is in
the range of values measured for normal and starburst galaxies, while
the ratio for the filament is similar to those of galaxies with weak
AGNs or elliptical galaxies (Onaka et al. 2008; Smith
et al. 2007a).
m band ratio of the IRS spectrum is in
the range of values measured for normal and starburst galaxies, while
the ratio for the filament is similar to those of galaxies with weak
AGNs or elliptical galaxies (Onaka et al. 2008; Smith
et al. 2007a).
An additional inspection suggests that the weak strength of
the 7.7 ![]() m
band in the NGC 1569 filament may be attributed to its narrow
band width relative to those in the disk spectrum (
m
band in the NGC 1569 filament may be attributed to its narrow
band width relative to those in the disk spectrum (
![]()
![]() 0.04
0.04 ![]() m
to 0.31
m
to 0.31 ![]() 0.02
0.02 ![]() m).
The narrow width is also suggested in Fig. 4.
The 7.7
m).
The narrow width is also suggested in Fig. 4.
The 7.7 ![]() m
UIR band is known to consist of more than two components (Peeters et al. 2002).
The filament spectrum suggests that the longer wavelength component of
the 7.7
m
UIR band is known to consist of more than two components (Peeters et al. 2002).
The filament spectrum suggests that the longer wavelength component of
the 7.7 ![]() m
band may be weak or absent. There may be excess above the fitted curve
around 7.8-7.9
m
band may be weak or absent. There may be excess above the fitted curve
around 7.8-7.9 ![]() m,
which is not included in the band strength estimate. This excess
increases the band strength only within its uncertainty and does not
change our conclusion that the total strength of the 7.7
m,
which is not included in the band strength estimate. This excess
increases the band strength only within its uncertainty and does not
change our conclusion that the total strength of the 7.7 ![]() m band is
weak in the filament. The present observation suggests that the low
band strength of the 7.7
m band is
weak in the filament. The present observation suggests that the low
band strength of the 7.7 ![]() m band in the filament may be attributed to a
change in one of the components.
m band in the filament may be attributed to a
change in one of the components.
A low ratio of the 7.7 to 11.3 ![]() m band is also suggested in the outer region of
our Galaxy (Sakon et al. 2004)
as well as in the interarm region of NGC 6946 (Sakon et al. 2007).
Elliptical galaxies are an extreme case for which the 6.2 and
7.7
m band is also suggested in the outer region of
our Galaxy (Sakon et al. 2004)
as well as in the interarm region of NGC 6946 (Sakon et al. 2007).
Elliptical galaxies are an extreme case for which the 6.2 and
7.7 ![]() m
bands are almost absent (Kaneda
et al. 2008,2005). Kaneda
et al. (2008) attributed the abnormal
UIR band strengths in elliptical galaxies to
the dominance of neutral PAHs. The weak 6.2 and 7.7
m
bands are almost absent (Kaneda
et al. 2008,2005). Kaneda
et al. (2008) attributed the abnormal
UIR band strengths in elliptical galaxies to
the dominance of neutral PAHs. The weak 6.2 and 7.7 ![]() m bands
relative to the 11.3
m bands
relative to the 11.3 ![]() m
band tend to be seen in tenuous regions and may have a common cause or
be the result of processing of the band carriers in these environments
(e.g., Onaka et al. 2008).
m
band tend to be seen in tenuous regions and may have a common cause or
be the result of processing of the band carriers in these environments
(e.g., Onaka et al. 2008).
Kaneda et al.
(2009b) suggest that the FIR emission detected at
6-9 kpc from the galaxy disk of NGC 253 may come from
the emission of outflowing dust entrained by superwinds. The
UIR band carriers in the filament of NGC 1569 may
also be entrained by the outflow of NGC 1569, which formed the
H![]() filament.
The velocity of the filament is derived to be about
90 km s-1 (Westmoquette
et al. 2008). If the filament were produced
by the outflow produced by the star-formation activity of
SSC A, the distance of 490 pc from
SSC A to the position of the IRC spectrum would infer
an expansion timescale of about 5.3 Myr. Observations with Chandra
suggest that the electron temperature and density of the bubble are
3.51
filament.
The velocity of the filament is derived to be about
90 km s-1 (Westmoquette
et al. 2008). If the filament were produced
by the outflow produced by the star-formation activity of
SSC A, the distance of 490 pc from
SSC A to the position of the IRC spectrum would infer
an expansion timescale of about 5.3 Myr. Observations with Chandra
suggest that the electron temperature and density of the bubble are
3.51 ![]() 106 K and 0.035 cm-3,
respectively (Ott et al. 2005).
Jones et al. (1996)
show that thermal sputtering efficiently destroys dust grains in fast
shocks (
106 K and 0.035 cm-3,
respectively (Ott et al. 2005).
Jones et al. (1996)
show that thermal sputtering efficiently destroys dust grains in fast
shocks (![]() km s-1)
and that the thermal sputtering yield depends on the electron
temperature and density, which can be applied even to very small
grains. Using the equation given by Tielens
et al. (1994), the thermal sputtering
timescale for grains of 1 nm in the bubble of
NGC 1569 is found to be 1.3
km s-1)
and that the thermal sputtering yield depends on the electron
temperature and density, which can be applied even to very small
grains. Using the equation given by Tielens
et al. (1994), the thermal sputtering
timescale for grains of 1 nm in the bubble of
NGC 1569 is found to be 1.3 ![]() 103 yr, which is much shorter
than the expansion timescale of the filament. Thus it seems
unlikely that the band carriers in the filament originate in the galaxy
disk and are entrained by the outflow without destruction.
It is also unlikely that AGB stars produce a large
amount of the band carriers since there appears to be neither
appreciable stellar components nor strong star-forming activities in
the filament. An alternative possibility for the origin of the
carriers may be the fragmentation from large carbonaceous grains in
shocks that produce H
103 yr, which is much shorter
than the expansion timescale of the filament. Thus it seems
unlikely that the band carriers in the filament originate in the galaxy
disk and are entrained by the outflow without destruction.
It is also unlikely that AGB stars produce a large
amount of the band carriers since there appears to be neither
appreciable stellar components nor strong star-forming activities in
the filament. An alternative possibility for the origin of the
carriers may be the fragmentation from large carbonaceous grains in
shocks that produce H![]() emission
(Jones et al. 1996).
The presence of the 3.3
emission
(Jones et al. 1996).
The presence of the 3.3 ![]() m band suggests that the smallest band carriers
exist in the filament, which may be consistent with the fragmentation
origin.
UIR band carriers formed from fragmentation may have different
properties from those in the galactic disk and exhibit the weaker
7.7
m band suggests that the smallest band carriers
exist in the filament, which may be consistent with the fragmentation
origin.
UIR band carriers formed from fragmentation may have different
properties from those in the galactic disk and exhibit the weaker
7.7 ![]() m band.
m band.
4.2 NIR excess continuum
The present observations indicate the presence of excess continuum
emission in the NIR (2.5-5 ![]() m) in the filament. NIR excess continuum
emission was first reported in reflection nebulae (Sellgren et al. 1983)
and then found in normal galaxies (Lu
et al. 2003). It is also seen in the
diffuse Galactic emission (Flagey
et al. 2006). Sellgren
(1984) suggests that the excess emission in reflection
nebulae may be attributed to stochastically heated 3-dimensional grains
consisting of 45-100 carbon atoms. The continuum
emission is also found to have a distinct spatial distribution from the
3.3
m) in the filament. NIR excess continuum
emission was first reported in reflection nebulae (Sellgren et al. 1983)
and then found in normal galaxies (Lu
et al. 2003). It is also seen in the
diffuse Galactic emission (Flagey
et al. 2006). Sellgren
(1984) suggests that the excess emission in reflection
nebulae may be attributed to stochastically heated 3-dimensional grains
consisting of 45-100 carbon atoms. The continuum
emission is also found to have a distinct spatial distribution from the
3.3 ![]() m
UIR band emission (An &
Sellgren 2003).
m
UIR band emission (An &
Sellgren 2003).
Redder colors in the NIR have been measured for
irregular/Sm galaxies than for spirals (Pahre et al. 2004; Smith
et al. 2007b; Engelbracht et al. 2005).
They have been attributed to younger stars (Pahre
et al. 2004), hot dust (Engelbracht et al. 2005;
Hunter
et al. 2006), nebular emission, or to the
3.3 ![]() m
UIR band emission. Smith
& Hancock (2009) investigate the origin of excess
emission at 4.5
m
UIR band emission. Smith
& Hancock (2009) investigate the origin of excess
emission at 4.5 ![]() m
in dwarf galaxies in detail. They discuss the possibilities of a
contribution from Br
m
in dwarf galaxies in detail. They discuss the possibilities of a
contribution from Br![]() ,
the reddening
of starlight, and a nebular continuum as the origin of the excess,
concluding that a combination
of these three may account for the 4.5
,
the reddening
of starlight, and a nebular continuum as the origin of the excess,
concluding that a combination
of these three may account for the 4.5 ![]() m excess and no significant contribution of hot
dust is necessary, although hot dust emission cannot be completely
excluded.
m excess and no significant contribution of hot
dust is necessary, although hot dust emission cannot be completely
excluded.
The NP spectrum clearly shows the presence of excess continuum
emission in addition to the 3.3 ![]() m UIR band and line emission,
if any. The continuum spectrum is rather flat in the
NIR spectral range and is distinct from stellar photospheric
emission. Lu et al. (2003)
suggest that the excess emission seen in normal galaxies is well fitted
with a modified black body, which can be attributed to emission from
hot dust. Figure 5
shows the NP spectrum of the filament together with a fitted
modified black body of T=868 K with the
emissivity of
m UIR band and line emission,
if any. The continuum spectrum is rather flat in the
NIR spectral range and is distinct from stellar photospheric
emission. Lu et al. (2003)
suggest that the excess emission seen in normal galaxies is well fitted
with a modified black body, which can be attributed to emission from
hot dust. Figure 5
shows the NP spectrum of the filament together with a fitted
modified black body of T=868 K with the
emissivity of ![]() .
The modified black body curve closely reproduces the observed spectrum,
suggesting a similarity to the excess continuum in normal galaxies and
a hot dust origin for the excess emission. If the spiky
features at 3.75 and 4.05
.
The modified black body curve closely reproduces the observed spectrum,
suggesting a similarity to the excess continuum in normal galaxies and
a hot dust origin for the excess emission. If the spiky
features at 3.75 and 4.05 ![]() m are assumed to be Pf
m are assumed to be Pf![]() and Br
and Br![]() ,
the associated free-free emission is expected. Simple
estimates of the intensities of the two lines obtained by integrating
over the continuum infer 2.8
,
the associated free-free emission is expected. Simple
estimates of the intensities of the two lines obtained by integrating
over the continuum infer 2.8 ![]() 10-9 and 2.4
10-9 and 2.4 ![]() 10-9 W m-2 sr-1
for Pf
10-9 W m-2 sr-1
for Pf![]() and Br
and Br![]() ,
respectively. The line ratio differs significantly from the
case A or B, which infers that there is a large
uncertainty in the estimated line intensities. Far stronger Pf
,
respectively. The line ratio differs significantly from the
case A or B, which infers that there is a large
uncertainty in the estimated line intensities. Far stronger Pf![]() than Pf
than Pf![]() emission
should be present around 4.65
emission
should be present around 4.65 ![]() m, where only a marginal hump is seen. The
strength of the hump is compatible with the estimated Br
m, where only a marginal hump is seen. The
strength of the hump is compatible with the estimated Br![]() intensity.
Thus we estimate the intensity of the free-free emission from the Br
intensity.
Thus we estimate the intensity of the free-free emission from the Br![]() intensity.
For the case B with the electron temperature of 104 K,
the free-free intensity expected from the Br
intensity.
For the case B with the electron temperature of 104 K,
the free-free intensity expected from the Br![]() intensity is about
0.03 MJy sr-1. Therefore, the
free-free emission alone cannot account for the observed excess
continuum emission and a hot dust contribution may be needed even
considering the large uncertainty
in the estimated line intensity.
intensity is about
0.03 MJy sr-1. Therefore, the
free-free emission alone cannot account for the observed excess
continuum emission and a hot dust contribution may be needed even
considering the large uncertainty
in the estimated line intensity.
![\begin{figure}
\par\includegraphics[width=8.1cm,clip]{13770fg5.eps}
\end{figure}](/articles/aa/full_html/2010/06/aa13770-09/img53.png)
|
Figure 5:
NP spectrum of the filament (solid line) together with the fitted
modified black body (dotted line). The fitted curve is a black body of T=868 K
with the emissivity of
|
| Open with DEXTER | |
5 Summary
We have presented AKARI/IRC observations of the starburst dwarf galaxy NGC 1569. Imaging observations have detected the MIR UIR band emission in a HThermal sputtering in the outflow is estimated to be very
efficient and we propose that the band carriers cannot survive in the
outflow. Alternatively, we suggest that the band carriers may be formed
by the fragmentation of larger carbonaceous grains in the shock that
produces the H![]() emission.
emission.
The presence of excess continuum emission in the NIR is also
indicated by the present spectroscopy in addition to the 3.3 ![]() m
UIR band. The present spectrum implies both that the excess
continuum emission cannot be accounted for solely by the free-free
emission estimated from the Br
m
UIR band. The present spectrum implies both that the excess
continuum emission cannot be accounted for solely by the free-free
emission estimated from the Br![]() that is possibly detected and that hot dust emission may be an
important contributor.
that is possibly detected and that hot dust emission may be an
important contributor.
This work is based on observations with AKARI, a JAXA project with the participation of ESA. The authors thank all the members of the AKARI project and the members of the Interstellar and Nearby Galaxy team for their help and continuous encouragements. Part of this work is based on observations made with the Spitzer Space Telescope, which is operated by the Jet Propulsion Laboratory (JPL), California Institute of Technology under a contract with the National Aeronautics and Space Administration (NASA). This work has also made use of the NASA extragalactic database (NED) which is operated by the JPL, California Institute of Technology under contract with NASA. The authors thank T. L. Roellig and Y. Y. Tajiri for providing us with the IRS spectrum of NGC 1569. They also thank S. Mühle for providing their H I data. This work is supported by a Grant-in-Aid for Scientific Research from the Japan Society for the Promotion of Science (No. 18204014).
References
- Allamandola, L. J., Tielens, A. G. G. M., & Barker, J. R. 1985, ApJ, 290, L25 [NASA ADS] [CrossRef] [Google Scholar]
- An, J. H., & Sellgren, K. 2003, ApJ, 599, 312 [NASA ADS] [CrossRef] [Google Scholar]
- Angeretti, L., Tosi, M., Greggio, L., et al. 2005, AJ, 129, 2203 [NASA ADS] [CrossRef] [Google Scholar]
- Buckalew, R. A., & Kobulnicky, A. 2006, AJ, 132, 1061 [NASA ADS] [CrossRef] [Google Scholar]
- Buckalew, R. A., Dufour, R. J., Shopbell, P., & Walter, D. K. 2000, AJ, 120, 2402 [NASA ADS] [CrossRef] [Google Scholar]
- Chan, K.-W., Roellig, T. L., Onaka, T., et al. 2001, ApJ, 546, 273 [NASA ADS] [CrossRef] [Google Scholar]
- Cherchneff, I., Baker, J. R., & Tielens, A. G. G. M. 1992, ApJ, 401, 269 [NASA ADS] [CrossRef] [Google Scholar]
- Cohen, M., Green, A. K., Meade, M. R., et al. 2007, MNRAS, 374, 979 [NASA ADS] [CrossRef] [Google Scholar]
- Draine, B. T., Dale, D. A., Bendo, G., et al. 2007, ApJ, 663, 866 [NASA ADS] [CrossRef] [Google Scholar]
- Engelbracht, C. W., Gordon, J. D., Rieke, G. H., et al. 2005, ApJ, 628, 29 [Google Scholar]
- Engelbracht, C. W., Kundurthy, P., Gordon, K. D., et al. 2006, ApJ, 642, L127 [NASA ADS] [CrossRef] [Google Scholar]
- Engelbracht, C. W., Rieke, G. H., Gordon, K. D., et al. 2008, ApJ, 678, 804; Erratum: ApJ, 685, 678 [NASA ADS] [CrossRef] [Google Scholar]
- Frenklach, M., & Feigelson, E. D. 1989, ApJ, 341, 372 [NASA ADS] [CrossRef] [Google Scholar]
- Flagey, N., Boulanger, F., Verstraete, L., et al. 2006, A&A, 453, 969 [NASA ADS] [CrossRef] [EDP Sciences] [Google Scholar]
- Galliano, F., Dwek, E., & Chanial, P. 2008a, ApJ, 672, 214 [NASA ADS] [CrossRef] [Google Scholar]
- Galliano, F., Madden, S. C., Tielens, A. G. G. M., Peeters, E., & Jones, A. P. 2008b, ApJ, 679, 310 [NASA ADS] [CrossRef] [Google Scholar]
- Giard, M., Pajot, F., Lamarre, J. M., et al. 1988, A&A, 201, L1 [NASA ADS] [Google Scholar]
- Gordon, K. D., Engelbracht, C. W., Rieke, G. H., et al. 2008, ApJ, 682, 336 [NASA ADS] [CrossRef] [Google Scholar]
- Greenberg, J. M., Gillett, J. S., Munõz Caro, G. M., et al. 2000, ApJ, 531, L71 [NASA ADS] [CrossRef] [Google Scholar]
- Greggio, L., Tosi, M., Clampin, M., et al. 1998, ApJ, 504, 725 [NASA ADS] [CrossRef] [Google Scholar]
- Greve, A., Tarchi, A., Hüttemeister, S., de Grijs, R., et al. 2002, A&A, 381, 825 [NASA ADS] [CrossRef] [EDP Sciences] [Google Scholar]
- Grocholski, A. J., Aloisi, A., Roeland, P., et al. 2008, ApJ, 686, L79 [NASA ADS] [CrossRef] [Google Scholar]
- Heckman, T. M., Dahlem, M., Lehnert, M. D., et al. 1995, ApJ, 448, 98 [NASA ADS] [CrossRef] [Google Scholar]
- Helou, G., Lu, N. Y., Werner, M. W., Malhotra, S., & Silbermann, N. 2000, ApJ, 532, L21 [NASA ADS] [CrossRef] [PubMed] [Google Scholar]
- Herbst, E. 1991, ApJ, 366, 133 [NASA ADS] [CrossRef] [Google Scholar]
- Hodge, P. W. 1974, ApJ, 191, L21 [NASA ADS] [CrossRef] [Google Scholar]
- Hunter, D. A., & Elmegreen, B. G. 2004, AJ, 128, 2170 [NASA ADS] [CrossRef] [Google Scholar]
- Hunter, D. A., Hawley, W. N., & Gallagher III, J. S. 1993, AJ, 106, 1797 [NASA ADS] [CrossRef] [Google Scholar]
- Hunter, D. A., O'Connell, R. W., Gallagher, J. S., & Smecker-Hane, T. A. 2000, AJ, 120, 2383 [NASA ADS] [CrossRef] [Google Scholar]
- Hunter, D. A., van Woerden, H., & Gallagher, J. S. 2006, AJ, 132, 801 [NASA ADS] [CrossRef] [Google Scholar]
- Irwin, J. A., & Madden, S. 2006, A&A, 445, 123 [NASA ADS] [CrossRef] [EDP Sciences] [MathSciNet] [Google Scholar]
- Irwin, J. A., Kennedy, H., Parkin, T., & Maddeen, S. 2007, A&A, 474, 461 [NASA ADS] [CrossRef] [EDP Sciences] [Google Scholar]
- Ishihara, D., Onaka, T., Kaneda, H., et al. 2007, PASJ, 59, S443 [NASA ADS] [Google Scholar]
- Jones, A. P., Tielens, A. G. G. M., & Hollenbach, D. J. 1996, ApJ, 469, 740 [NASA ADS] [CrossRef] [Google Scholar]
- Kahanpää, J., Mattila, K., Lehtinen, K., Leinert, C., & Lemke, D. 2003, A&A, 405, 999 [NASA ADS] [CrossRef] [EDP Sciences] [Google Scholar]
- Kaneda, H., Onaka, T., & Sakon, I. 2005, ApJ, 632, L83 [NASA ADS] [CrossRef] [Google Scholar]
- Kaneda, H., Onaka, T., & Sakon, I. 2007, ApJ, 666, L21 [NASA ADS] [CrossRef] [Google Scholar]
- Kaneda, H., Onaka, T., Sakon, I., et al. 2008, ApJ, 684, 270 [NASA ADS] [CrossRef] [MathSciNet] [Google Scholar]
- Kaneda, H., Koo, B.-C., Onaka, T., & Takahashi, H. 2009a, Adv. Sp. Res., 44, 1038 [NASA ADS] [CrossRef] [Google Scholar]
- Kaneda, H., Yamagishi, M., Suzuki, T., & Onaka, T. 2009b, ApJ, 698, L125 [NASA ADS] [CrossRef] [Google Scholar]
- Kaneda, H., Ishihara, D., Suzuki, T., et al. 2010, A&A, 514, A14 [NASA ADS] [CrossRef] [EDP Sciences] [Google Scholar]
- Kelsall, T., Weiland, J. L., Franzx, B. A., et al. 1998, ApJ, 508, 44 [NASA ADS] [CrossRef] [Google Scholar]
- Latter, W. B. 1991, ApJ, 377, 187 [NASA ADS] [CrossRef] [Google Scholar]
- Léger, A., & Puget, J. L. 1984, A&A, 137, L5 [NASA ADS] [Google Scholar]
- Lu, N., Helou, G., Werner, M. W., et al. 2003, ApJ, 588, 199 [NASA ADS] [CrossRef] [Google Scholar]
- Lutz, D., Valiante, E., Sturm, E., et al. 2005, ApJ, 625, L83 [NASA ADS] [CrossRef] [Google Scholar]
- Madden, S., Galliano, F., Jones, A. P., & Sauvage, M. 2006, A&A, 446, 877 [NASA ADS] [CrossRef] [EDP Sciences] [Google Scholar]
- Martin, C. L. 1998, ApJ, 506, 222 [NASA ADS] [CrossRef] [Google Scholar]
- Martin, C. L., Kobulnicky, H. A., & Heckman, T. M. 2002, ApJ, 574, 663 [NASA ADS] [CrossRef] [Google Scholar]
- Mattila, K., Lemke, D., Haikala, L. K., et al. 1996, A&A, 315, L353 [NASA ADS] [Google Scholar]
- Matsumoto, H., Sakon, I., Onaka, T., et al. 2008, ApJ, 677, 1120 [NASA ADS] [CrossRef] [Google Scholar]
- Mühle, S., Klein, U., Wilcots, E. M., & Hüttemeister, S. 2005, AJ, 130, 524 [NASA ADS] [CrossRef] [Google Scholar]
- Murakami, H., Baba, H., Barthel, P., et al. 2007, PASJ, 59, S369 [NASA ADS] [CrossRef] [MathSciNet] [Google Scholar]
- O'Halloran, B., Satyapal, S., & Dudik, R. P. 2006, ApJ, 641, 795 [NASA ADS] [CrossRef] [Google Scholar]
- Ohyama, Y., Onaka, T., Matsuhara, H., et al. 2007, PASJ, 59, S411 [NASA ADS] [Google Scholar]
- Omont, A. 1986, A&A, 164, 159 [NASA ADS] [Google Scholar]
- Onaka, T. 2000, Adv. Sp. Res., 25, 2167 [Google Scholar]
- Onaka, T. 2004, in Astrophysics of Dust, ed. A. N. Witt, G. C. Clayton, & B. T. Draine, ASP Conf. Ser., 309, 163 [Google Scholar]
- Onaka, T., Yamamura, I., Tanabé, T., Roellig, T. L., & Yuen, L. 1996, PASJ, 48, L59 [NASA ADS] [CrossRef] [Google Scholar]
- Onaka, T., Tokura, D., Sakon, I., et al. 2007a, ApJ, 654, 844 [NASA ADS] [CrossRef] [Google Scholar]
- Onaka, T., Matsuhara, H., Wada, T., et al. 2007b, PASJ, 59, S401 [NASA ADS] [Google Scholar]
- Onaka, T., Matsumoto, H., Sakon, I., & Kaneda, H. 2008, Organic Matter in Space, ed. S. Kwok, & S. Sandford, Proc. IAU Symp., 251, 229 [Google Scholar]
- Ott, J., Walter, F., & Brinks, E. 2005, MNRAS, 358, 1453 [NASA ADS] [CrossRef] [Google Scholar]
- Pahre, M. A., Ashby, M. L. N., Fazio, G. G., & Willner, S. P. 2004, ApJS, 154, 229 [NASA ADS] [CrossRef] [Google Scholar]
- Papoular, R., Conard, J., Giuliano, M., Kister, J., & Mille, G. 1989, A&A, 217, 204 [NASA ADS] [Google Scholar]
- Peeters, E., Hony, S., van Kerckhoven, C., et al. 2002, A&A, 390, 1089 [NASA ADS] [CrossRef] [EDP Sciences] [Google Scholar]
- Peeters, E., Spoon, H. W. W., & Tielens, A. G. G. M. 2004, ApJ, 613, 986 [NASA ADS] [CrossRef] [Google Scholar]
- Reach, W. T., Megeath, S. T., Cohen, M., et al. PASP, 117, 978 [Google Scholar]
- Sakata, A., Wada, S., Tanabé, T., & Onaka, T. 1984, ApJ, 287, L51 [NASA ADS] [CrossRef] [Google Scholar]
- Sakon, I., Onaka, T., Ishihara, D., et al. 2004, ApJ, 609, 203; Erratum: ApJ, 625, 1062 [NASA ADS] [CrossRef] [Google Scholar]
- Sakon, I., Onaka, T., Wada, T., et al. 2007, PASJ, 49, S483 [NASA ADS] [CrossRef] [Google Scholar]
- Sellgren, K. 1984, ApJ, 277, 623 [NASA ADS] [CrossRef] [Google Scholar]
- Sellgren, K., Werner, M. W., & Dinerstein, H. L. 1983, ApJ, 271, L13 [CrossRef] [Google Scholar]
- Smith, B. J., & Hancock, M. 2009, AJ, 138, 130 [NASA ADS] [CrossRef] [Google Scholar]
- Smith, J. D., Draine, B. T., Dale, D. A., et al. 2007a, ApJ, 656, 770 [NASA ADS] [CrossRef] [Google Scholar]
- Smith, B. J., Struck, C., Hancock, M., et al. 2007b, AJ, 133, 791 [NASA ADS] [CrossRef] [Google Scholar]
- Stil, J. M., & Israel, F. P. 1998, A&A, 337, 64 [NASA ADS] [Google Scholar]
- Tacconi-Garman, L. E., Sturm, E., Lehnert, M., et al. 2005, A&A, 432, 91 [NASA ADS] [CrossRef] [EDP Sciences] [Google Scholar]
- Tajiri, Y. Y., Onaka, T., Okada, Y., Roellig, T. L., & Chan, K.-W. 2008, ASP Conf. Ser., 381, 50 [NASA ADS] [Google Scholar]
- Tanabé, T., Sakon, I., Cohen, M., et al. 2008, PASJ, 60, S375 [NASA ADS] [CrossRef] [Google Scholar]
- Tanaka, M., Matsumoto, T., Murakami, H., et al. 1996, PASJ, 48, L53 [NASA ADS] [CrossRef] [Google Scholar]
- Tielens, A. G. G. M. 2008, ARA&A, 46, 289 [NASA ADS] [CrossRef] [EDP Sciences] [Google Scholar]
- Tielens, A. G. G. M., McKee, C. F., Seab, C. G., & Hollenbach, D. J. 1994, ApJ, 431, 321 [NASA ADS] [CrossRef] [Google Scholar]
- Tokura, D., Onaka, T., Takahashi, H., et al. 2007, ApJ, 648, 355 [NASA ADS] [CrossRef] [Google Scholar]
- van Kerckhoven, C., Hony, S., Peeters, E., et al. 2000, A&A, 357, 1013 [NASA ADS] [Google Scholar]
- Wada, S., Onaka, T., Yamamura, I., Murata, Y., & Tokunaga, A. T. 2003, A&A, 407, 551 [NASA ADS] [CrossRef] [EDP Sciences] [Google Scholar]
- Werner, M. W., Uchida, K. I., Sellgren, K., et al. 2004, ApJS, 154, 309 [NASA ADS] [CrossRef] [Google Scholar]
- Westmoquette, M. S., Exter, K. M., Smith, L. J., & Gallagher III, J. S. 2007a, MNRAS, 381, 894 [NASA ADS] [CrossRef] [Google Scholar]
- Westmoquette, M. S., Smith, L. J., Gallagher III, J. S., & Exter, K. M. 2007b, MNRAS, 381, 913 [NASA ADS] [CrossRef] [Google Scholar]
- Westmoquette, M. S., Smith, L. J., & Gallagher III, J. S. 2008, MNRAS, 383, 864 [NASA ADS] [CrossRef] [Google Scholar]
- Wu, Y., Charmandaris, V., Hao, L., et al. 2006, ApJ, 639, 157 [NASA ADS] [CrossRef] [Google Scholar]
- Wu, H., Zhu, Y.-N., Cao, C., & Qin, B. 2007, ApJ, 668, 87 [NASA ADS] [CrossRef] [Google Scholar]
Footnotes
All Tables
Table 1: IRC observation log of NGC 1569.
Table 2: Positions of the spectrum extracted.
Table 3:
UIR band strength ratio relative to the 11.3 ![]() m band.
m band.
All Figures
|
|
Figure 1:
AKARI/IRC 6-band images of NGC 1569. The image size is |
| Open with DEXTER | |
| In the text | |
|
|
Figure 2:
a) Artificial 3-color image of
NGC 1569. The N4 in blue, S7 in green,
and L15 in red. b) S7 image
of NGC 1569 superimposed with contours in a logarithmic scale
of the H |
| Open with DEXTER | |
| In the text | |
|
|
Figure 3:
AKARI/IRC spectra of the H |
| Open with DEXTER | |
| In the text | |
|
|
Figure 4:
a) IRC spectrum of the filament of
NGC 1569 (thin line) and the fitted line (thick line).
b) IRS spectrum of the disk of
NGC 1569 (thin line) and the fitted line (thick line). Sharp
lines not fitted are ionic forbidden lines ([Ar
III] 9.0 |
| Open with DEXTER | |
| In the text | |
|
|
Figure 5:
NP spectrum of the filament (solid line) together with the fitted
modified black body (dotted line). The fitted curve is a black body of T=868 K
with the emissivity of
|
| Open with DEXTER | |
| In the text | |
Copyright ESO 2010
Current usage metrics show cumulative count of Article Views (full-text article views including HTML views, PDF and ePub downloads, according to the available data) and Abstracts Views on Vision4Press platform.
Data correspond to usage on the plateform after 2015. The current usage metrics is available 48-96 hours after online publication and is updated daily on week days.
Initial download of the metrics may take a while.