| Issue |
A&A
Volume 514, May 2010
|
|
|---|---|---|
| Article Number | A24 | |
| Number of page(s) | 11 | |
| Section | Extragalactic astronomy | |
| DOI | https://doi.org/10.1051/0004-6361/200912475 | |
| Published online | 04 May 2010 | |
The Wolf-Rayet features and mass-metallicity relation of long-duration gamma-ray burst host galaxies
X. H. Han1,2,3,4 - F. Hammer2 - Y. C. Liang3 - H. Flores2 - M. Rodrigues2 - J. L. Hou1 - J. Y. Wei3
1 - Key Laboratory for Research in Galaxies and Cosmology, Shanghai
Astronomical Observatory, the Chinese Academy of Sciences, 80 Nandan
Road, Shanghai 200030, PR China
2 - GEPI, Observatoire de Paris-Meudon, Meudon 92195, France
3 - National Astronomical Observatories, Chinese Academy of Sciences,
Beijing 100012, PR China
4 - Graduate School of the Chinese Academy of Sciences, Beijing 100049,
PR China
Received 12 May 2009 / Accepted 6 January 2010
Abstract
Aims. We gather optical spectra of 8 long-duration
GRB host galaxies selected from the archival data
of VLT/FORS2. We investigate whether or not
Wolf-Rayet (WR) stars can be detected in these GRB host
galaxies. We also estimate the physical properties of GRB host
galaxies, such as metallicity.
Methods. We identify the WR features in these
spectra by fitting the WR bumps and WR emission lines in blue
and red bumps. We identify the subtypes of the WR stars,
estimate the numbers of stars in each subtype, and calculate the WR/O
star ratios. The (O/H) abundances of GRB hosts are inferred
from both the electron temperature (![]() )
and the metallicity-sensitive strong-line ratio (R23),
for which we break the R23
degeneracy. We compare the environments of long-duration GRB host
galaxies with those of other galaxies in terms of their luminosity
(stellar mass)-metallicity relations (L-Z,
M*-Z).
)
and the metallicity-sensitive strong-line ratio (R23),
for which we break the R23
degeneracy. We compare the environments of long-duration GRB host
galaxies with those of other galaxies in terms of their luminosity
(stellar mass)-metallicity relations (L-Z,
M*-Z).
Results. We detect WR stars in
5 GRB host galaxies with spectra of relatively high
signal-to-noise ratios (S/N). In
the comparison of L-Z, M*-Z
relations, we show that GRB hosts have lower metallicities than other
samples of comparable luminosity and stellar mass. The presence of WR
stars and the observed high WR/O star ratio, together with the
low metallicity, support the ![]() core-collapsar'' model and
imply that we are witnessing the first stage of star formation in the
host regions of GRBs.
core-collapsar'' model and
imply that we are witnessing the first stage of star formation in the
host regions of GRBs.
Key words: gamma-ray burst: general - stars: Wolf-Rayet - galaxies: abundances - galaxies: fundamental parameters
1 Introduction
Gamma-ray bursts (GRBs), the most energetic events in the Universe, were discovered accidentally in the 1960s (Klebesadel et al. 1973). Since then, GRBs have been the targets of intense research. However, the mechanism behind these bursts and the identity of their progenitors remain disputed.
The durations and spectral properties of GRBs suggest a
classification
of short (of duration ![]() 2 s
and hard spectrum)
and long bursts (of duration
2 s
and hard spectrum)
and long bursts (of duration ![]() 2 s and
soft spectrum) (Hartmann
2005; Kouveliotou
et al. 1993).
Short GRBs are believed to originate from the merger of compact
binaries such as double neutron star binaries (NS-NS) and black
hole-neutron star binaries (BH-NS). For long GRBs, the favored
``core-collapsar''
model starts from the idea of a rapidly rotating, massive star that has
undergone extreme gravitational collapse and formed a central black
hole
(Klose
et al. 2004; Woosley et al. 1993; MacFadyen
& Woosley 1999).
According to the collapsar model, the prompt energetic structure of a
long GRB
is the result of energy dissipation by internal, relativistic shocks,
which may last seconds or minutes, at a radius of about 1014 cm
from the center of the collapsed star (Hartmann
2005, and references therein).
Moreover, the association between GRBs and supernovae (SNe)
indicates that in many cases the parent SN population of GRBs is formed
by peculiar type Ibc SNe.
2 s and
soft spectrum) (Hartmann
2005; Kouveliotou
et al. 1993).
Short GRBs are believed to originate from the merger of compact
binaries such as double neutron star binaries (NS-NS) and black
hole-neutron star binaries (BH-NS). For long GRBs, the favored
``core-collapsar''
model starts from the idea of a rapidly rotating, massive star that has
undergone extreme gravitational collapse and formed a central black
hole
(Klose
et al. 2004; Woosley et al. 1993; MacFadyen
& Woosley 1999).
According to the collapsar model, the prompt energetic structure of a
long GRB
is the result of energy dissipation by internal, relativistic shocks,
which may last seconds or minutes, at a radius of about 1014 cm
from the center of the collapsed star (Hartmann
2005, and references therein).
Moreover, the association between GRBs and supernovae (SNe)
indicates that in many cases the parent SN population of GRBs is formed
by peculiar type Ibc SNe.
Wolf-Rayet (WR) stars are naturally considered to be the most
favored candidates of long duration GRB progenitors. In the stellar
evolution model of Hirschi
et al. (2005), WR stars, which are massive
short-lived stars, satisfy the main criteria for GRB production of
black hole formation, loss of hydrogen-rich envelope, and sufficient
angular
momentum to form an accretion disk around the black hole.
According to this model, a lower limit to the metallicity of subsolar
value (typically between ![]() and
and ![]() ,
i.e.,
,
i.e., ![]() -0.4
-0.4 ![]() )
is also a criterion for GRB production.
However, magnetic-field breaking poses some difficulties
in producing GRBs (Petrovic
et al. 2005). To solve this problem, one possible
scenario involves assuming that the star of lower metallicity
rotates so
rapidly that mixing occurs and the star chemically evolves
homogeneously
without a hydrogen envelope.
Moreover, its lower metallicity (typically
)
is also a criterion for GRB production.
However, magnetic-field breaking poses some difficulties
in producing GRBs (Petrovic
et al. 2005). To solve this problem, one possible
scenario involves assuming that the star of lower metallicity
rotates so
rapidly that mixing occurs and the star chemically evolves
homogeneously
without a hydrogen envelope.
Moreover, its lower metallicity (typically
![]() )
causes low mass loss and therefore the retention of a high angular
momentum.
Those conditions are necessary to produce a GRB
(Yoon &
Langer 2005; Woosley
& Heger 2006). Therefore, it is imperative to confirm
the presence of WR stars and determine more accurately metallicities in
the region of GRBs.
)
causes low mass loss and therefore the retention of a high angular
momentum.
Those conditions are necessary to produce a GRB
(Yoon &
Langer 2005; Woosley
& Heger 2006). Therefore, it is imperative to confirm
the presence of WR stars and determine more accurately metallicities in
the region of GRBs.
The subtype and number of WR stars, and the relative WR/O star number ratio, are related to the star-forming activity and the starburst duration in galaxies. We can achieve a deeper understanding of the evolutionary paths of long-duration GRB progenitors by detecting the WR populations within GRB host galaxies. Moreover, WR evolutionary models suggest that metallicity, one of the important diagnostics of the evolutionary histories of galaxies, affects the properties of WR stars (Schaerer & Vacca 1998). Crowther & Hadfield (2006) investigated the effect of metallicity on the WR/O star ratio. They found that the WR/O star ratio decreases with metallicity. However, high WR/O star ratios are found in host galaxies of both GRB 980425 and GRB 020903, which have low metallicities (Hammer et al. 2006). The WR/O star ratio-metallicity relation for other GRB hosts is still unknown.
The first detection of a counterpart to a GRB at optical and
X-ray was achieved on 28 February 1997 (van Paradijs et al. 1997).
Since the discovery of GRB afterglows, GRB host galaxies and their
redshifts have been identifiable. Between 1997 and 2007,
588 GRBs were detected. Among them, 325 GRBs had
X-ray afterglows, 220 GRBs had optical afterglows, and
55 GRBs had radio afterglows![]() .
.
The study of GRB host galaxies is very important to the understanding of the physical properties of GRB regions and the nature of GRB progenitors. Although a large number of host galaxies can be identified, most of them are too faint to be observed even using the largest telescopes in the world. So far, only a few dozens of host galaxies have been spectroscopically observed (e.g., GHostS). Moreover, the number of GRB hosts that have been intensively studied spectroscopically is even less.
Evidence from photometric and spectroscopic observations shows that the host galaxies of long-duration GRBs are mostly faint, blue, low-mass, star-forming galaxies with low metallicities (Savaglio et al. 2009; Prochaska et al. 2004; Fynbo et al. 2003; Wiersema et al. 2007; Fynbo et al. 2006; Christensen et al. 2004; Courty et al. 2004; Levesque et al. 2009; Le Floc'h et al. 2003; Chary et al. 2002; Sokolov et al. 2001; Gorosabel et al. 2005; Kewley et al. 2007, hereafter Savaglio09). In contrast, the host galaxies of short-duration GRBs mostly have higher luminosities and higher metallicities than long-duration GRB hosts (Berger 2008).
We study a sample of 8 long-duration GRB hosts with
high quality spectroscopic observations. Firstly, we try to detect the
WR features in
these GRB hosts then study the physical properties of GRB host
galaxies, such as their metallicities and
luminosity (stellar mass)-metallicity relations (L-Z,
M*-Z).
This paper is organized as follows. The sample selection and flux
measurements are performed in Sect. 2. In
Sect. 3,
we describe the
identification of the WR features in the
spectra of GRB hosts. In Sect. 4, the physical
properties of GRB host galaxies are discussed. The discussion and
conclusions
are presented in Sect. 5.
Throughout the paper, we adopt the ![]() CDM cosmological model (
H0
= 70 km s-1 Mpc-1,
CDM cosmological model (
H0
= 70 km s-1 Mpc-1,
![]() ,
and
,
and ![]() ),
and the initial mass function (IMF) proposed by Salpeter (1955). All
comparisons performed in this work include a normalization to the same
),
and the initial mass function (IMF) proposed by Salpeter (1955). All
comparisons performed in this work include a normalization to the same ![]() CDM
cosmological model and IMF. All magnitudes in this paper are in the
Vega system.
CDM
cosmological model and IMF. All magnitudes in this paper are in the
Vega system.
2 Data reduction and measurements
2.1 The sample selection and data reduction
One of the main goals of this work is to find evidence of WR
stars in
GRB hosts by means of optical spectroscopic analysis.
We searched archival data of VLT/FORS2![]() to obtain the spectra of GRB host galaxies at z
< 1, which ensures
that a sufficient number of emission lines are included
in the spectral coverage. These spectra taken with the 600B, 600RI,
600Z grisms (
to obtain the spectra of GRB host galaxies at z
< 1, which ensures
that a sufficient number of emission lines are included
in the spectral coverage. These spectra taken with the 600B, 600RI,
600Z grisms (
![]() ), and
300 V grism (
), and
300 V grism (
![]() )
of FORS2 were adopted, because they represent a good compromise between
relatively high spectral resolution, which allows to resolve the
WR features, and relatively high sensitivity, which provides
spectra of high quality.
)
of FORS2 were adopted, because they represent a good compromise between
relatively high spectral resolution, which allows to resolve the
WR features, and relatively high sensitivity, which provides
spectra of high quality.
Data reduction and extraction were performed using a set of
IRAF![]() procedures
developed by our team, which can simultaneously reconstruct
the spectra and the sky counts of the objects.
For some GRBs associated with supernovae, the early-time
spectra were carefully checked to avoid the contamination of
supernovae, which increases the difficulty in identifying WR features
and the error
in the emission line flux. Spectra containing contamination by
supernovae were then removed.
procedures
developed by our team, which can simultaneously reconstruct
the spectra and the sky counts of the objects.
For some GRBs associated with supernovae, the early-time
spectra were carefully checked to avoid the contamination of
supernovae, which increases the difficulty in identifying WR features
and the error
in the emission line flux. Spectra containing contamination by
supernovae were then removed.
Wavelength calibration was
performed using the HeNeAr lamp spectra.
Flux calibration was achieved by observing spectrophotometric stars
with the same grism and the same slit width. Galactic extinction was
adopted from NED![]() and Schaerer & Vacca (1998).
All spectra were transformed into the rest-frame.
The spectra taken with different grism, but the same resolution
and the same slit width were merged to widen the wavelength coverages
(e.g., GRB 980703; GRB 020903). When merging spectra,
the exposure times were applied as weighting. The sample has
8 objects including 7 long-duration GRB hosts
and 1 possible long-duration GRB host (GRB 060505).
The host of GRB 060505 was spatially resolved
by VLT/FORS2 spectroscopic observations, therefore the
GRB region and the entire host galaxy were studied, separately
(see Thöne et al. 2008,
for the imaging).
The detailed discussion about GRB 060505 is given in
Sect. 5
and Schaerer & Vacca (1998).
All spectra were transformed into the rest-frame.
The spectra taken with different grism, but the same resolution
and the same slit width were merged to widen the wavelength coverages
(e.g., GRB 980703; GRB 020903). When merging spectra,
the exposure times were applied as weighting. The sample has
8 objects including 7 long-duration GRB hosts
and 1 possible long-duration GRB host (GRB 060505).
The host of GRB 060505 was spatially resolved
by VLT/FORS2 spectroscopic observations, therefore the
GRB region and the entire host galaxy were studied, separately
(see Thöne et al. 2008,
for the imaging).
The detailed discussion about GRB 060505 is given in
Sect. 5
Table 1 lists those 8 GRB hosts in our sample with the name, coordinate at 2000 epoch, redshift, and burst type. The detailed observational information (date, exposure time, seeing, grism, and program) for the objects is given in Table 2.
Table 1: Basic information of the GRB host galaxies.
Table 2: Spectroscopic observations of GRB host galaxies from VLT/FORS2.
2.2 Flux measurements of emission lines
To measure accurate emission line fluxes, the
continuum and absorption lines should be subtracted from the spectrum
carefully. To do this, the STARLIGHT![]() ,
a spectral synthesis code, developed by Cid
Fernandes et al. (2005), is used to fit the
observed spectrum. STARLIGHT can model the continuum and stellar
absorption lines using a linear combination of
N* simple stellar
population (SSP) templates from the evolutionary population
synthesis code of Bruzual &
Charlot (2003). In the fitting, we use a base of
45 SSPs, which includes 15 ages (0.001, 0.003, 0.005,
0.01, 0.025, 0.04, 0.1, 0.28, 0.64, 0.9, 1.4, 2.5, 5, 10,
13 Gyr) at 3 metallicities (0.2, 1, 2.5
,
a spectral synthesis code, developed by Cid
Fernandes et al. (2005), is used to fit the
observed spectrum. STARLIGHT can model the continuum and stellar
absorption lines using a linear combination of
N* simple stellar
population (SSP) templates from the evolutionary population
synthesis code of Bruzual &
Charlot (2003). In the fitting, we use a base of
45 SSPs, which includes 15 ages (0.001, 0.003, 0.005,
0.01, 0.025, 0.04, 0.1, 0.28, 0.64, 0.9, 1.4, 2.5, 5, 10,
13 Gyr) at 3 metallicities (0.2, 1, 2.5 ![]() ). The
Galactic extinction law of Cardelli
et al. (1989)
(CCM) was adopted in the STARLIGHT fitting.
An example of spectral fitting is shown in Fig. 1.
). The
Galactic extinction law of Cardelli
et al. (1989)
(CCM) was adopted in the STARLIGHT fitting.
An example of spectral fitting is shown in Fig. 1.
Emission line fluxes were measured manually using SPLOT task in IRAF. The errors originated mainly from three sources: the first is the uncertainty in fitting both the continuum and the stellar absorption line; the second is the uncertainty in the flux measurement; the third is the Poisson noises from both sky and objects, which dominate the error budgets. Emission line fluxes corrected for Galactic extinction are given in Table 3.
Table 3:
Emission line fluxes of GRB host galaxies (in units of
![]() ,
corrected for Galactic extinction).
,
corrected for Galactic extinction).
![\begin{figure}
\par\includegraphics[width=8.5cm,clip]{12475fig1.eps}
\end{figure}](/articles/aa/full_html/2010/06/aa12475-09/img146.png)
|
Figure 1: The spectrum of host galaxy of GRB 031203. The spectral synthesis fitting is plotted in red line. The strong emission lines are marked. |
| Open with DEXTER | |
2.3 Dust extinction
The dust extinction can be estimated from the Balmer-line
ratios (H![]() /H
/H![]() ,
H
,
H![]() /H
/H![]() ,
and H
,
and H![]() /H
/H![]() ). In our
dust extinction calculation, we adopted
Case B recombination with an electron density of
100 cm-3 and a temperature of
10 000 K. The predicted
intrinsic ratio is 2.86 for I0(H
). In our
dust extinction calculation, we adopted
Case B recombination with an electron density of
100 cm-3 and a temperature of
10 000 K. The predicted
intrinsic ratio is 2.86 for I0(H![]() )/I0(H
)/I0(H![]() ),
and 0.466 for I0(H
),
and 0.466 for I0(H![]() )/I0(H
)/I0(H![]() )
(Osterbrock 1989).
We applied the Galactic extinction law of CCM
for RV
= 3.1 where RV
is the ratio of AV
to E(B-V) (Seaton 1979). The values of dust
extinction are listed in Table 4.
The 2 extinction values for each object derived from the ratios of
H
)
(Osterbrock 1989).
We applied the Galactic extinction law of CCM
for RV
= 3.1 where RV
is the ratio of AV
to E(B-V) (Seaton 1979). The values of dust
extinction are listed in Table 4.
The 2 extinction values for each object derived from the ratios of
H![]() /H
/H![]() and H
and H![]() /H
/H![]() are consistent with each other.
The E(B-V)
derived from H
are consistent with each other.
The E(B-V)
derived from H![]() /H
/H![]() was adopted
in this study when available, because the
higher S/N ratios of these two
lines can ensure smaller uncertainties in the results. The E(B-V)
derived from H
was adopted
in this study when available, because the
higher S/N ratios of these two
lines can ensure smaller uncertainties in the results. The E(B-V)
derived from H![]() /H
/H![]() was adopted
for GRB 980703 and 020405, because H
was adopted
for GRB 980703 and 020405, because H![]() is not available in their spectra. We then
corrected emission line fluxes for dust extinction.
is not available in their spectra. We then
corrected emission line fluxes for dust extinction.
Table 4: Dust extinction of GRB host galaxies.
3 Wolf-Rayet bump identification
The main WR features often seen in optical spectra of
galaxies are two characteristic broad emission line clusters.
One is in a blue part of the spectrum at around 4600-4680 Å
(hereafter blue bump, Kunth
& Joubert 1985; Allen et al. 1976; Conti 1991;
Schaerer
& Vacca 1998). The other is in a red region around
5650-5800 Å (hereafter red bump, Kunth & Schild 1986; Dinerstein
& Shields 1986).
The blue bump is actually a blend of some broad WR lines, such as
![]() 4605, 4620
4605, 4620 ![]() ,
,
![]() 4634,
4640 Å,
4634,
4640 Å,
![]() /
/
![]() 4650, 4658 Å, and
4650, 4658 Å, and
![]() 4686 Å, and some nebular emission lines superimposed on the
bump, such as
4686 Å, and some nebular emission lines superimposed on the
bump, such as ![]() 4658 Å,
4658 Å, ![]() 4686 Å,
4686 Å, ![]() +
+ ![]() 4711 Å, and
4711 Å, and ![]() 4740
(Izotov
et al. 1998; Guseva et al. 2000).
The red bump is usually much weaker than the blue bump.
4740
(Izotov
et al. 1998; Guseva et al. 2000).
The red bump is usually much weaker than the blue bump.
![]() 5808 Å is
commonly seen
in the red bump (Kunth
& Schild 1986; Dinerstein & Shields 1986).
5808 Å is
commonly seen
in the red bump (Kunth
& Schild 1986; Dinerstein & Shields 1986).
![\begin{figure}
\par\includegraphics[width=15cm,clip]{12475fig2.eps}
\end{figure}](/articles/aa/full_html/2010/06/aa12475-09/img200.png)
|
Figure 2: The spectra of GRB hosts are plotted in the left panels. The continuums are marked using red lines, which are the results of the Starlight fit using BC03 templates. The blue boxes indicate the WR blue and red bumps. The WR emission lines are marked in red dot-dashed lines. In the right panels, the fits of WR bumps are plotted in red profiles. The fits of individual WR line and nebular line are plotted in green and blue profiles respectively (for more details, please see the online color version). |
| Open with DEXTER | |
The number of WR stars can be estimated from the luminosity of the blue and red bumps divided by the luminosity of a single WR star in a certain subtype (see, e.g., Guseva et al. 2000). In the following three subsections, we firstly attempt to identify the WR features in our GRB hosts, and then to estimate the subtypes and numbers of WR stars, and finally summarize the results of these GRB host galaxies.
3.1 Identifying the WR features
To be able to identify the WR features reliably, we select the high quality spectra of GRB hosts. The criterion for this selection is assumed to be S/N > 10 in the continuum on both sides of the blue bump to ensure that the WR features detected are real and that a final selected sample is as large as possible. For other cases, there are very few chances to identify the WR features, even if they do exist in the spectra. This final selected sample contains 5 objects: GRB 980703, GRB 020405, GRB 020903, GRB 031203, and GRB 060218.
We identify the WR features of these 5 GRB hosts
based
on the appearance of the blue bump and WR emission lines by fitting
them.
This fitting method is also used by Brinchmann
et al. (2008).
The fitting is performed using the SPECFIT routine in IRAF.
We fit the whole blue bump with a single broad
Gaussian profile. To fit the WR lines
![]() 4605, 4620 Å,
4605, 4620 Å, ![]() 4640 Å,
4640 Å,
![]() /
/
![]() 4650, 4658 Å, and
4650, 4658 Å, and
![]() 4686 Å, when they exist, we adopt multiple Gaussian
profiles to distinguish the broad component, which is mainly
from WR stars, from the narrow component, which is mainly
from nebulae. Nebular lines, blended within the bump, are also fitted.
The FWHMs of narrow components of WR lines
are
set to be consistent with those of nebular lines.
When carrying out the fit,
the best-fit continuum is chosen very carefully, because the
WR features depend sensitively on the continuum estimates.
We limit the overall wavelength shift of the blue and red features to
be
4686 Å, when they exist, we adopt multiple Gaussian
profiles to distinguish the broad component, which is mainly
from WR stars, from the narrow component, which is mainly
from nebulae. Nebular lines, blended within the bump, are also fitted.
The FWHMs of narrow components of WR lines
are
set to be consistent with those of nebular lines.
When carrying out the fit,
the best-fit continuum is chosen very carefully, because the
WR features depend sensitively on the continuum estimates.
We limit the overall wavelength shift of the blue and red features to
be
![]() Å
and the width
of the broad component of WR lines to be
Å
and the width
of the broad component of WR lines to be
![]()
![]() FWHM,
which are reasonable
values found by (Brinchmann
et al. 2008). The fluxes of WR bumps and WR lines
are measured from the fitted spectra. The fits are shown in
Fig. 2.
A significant
FWHM,
which are reasonable
values found by (Brinchmann
et al. 2008). The fluxes of WR bumps and WR lines
are measured from the fitted spectra. The fits are shown in
Fig. 2.
A significant ![]() 5875 Å emission line, evidence of
young stars such as WR stars, is detected in most of objects.
5875 Å emission line, evidence of
young stars such as WR stars, is detected in most of objects.
Table 5: Properties of WR stars in GRB hosts.
3.2 Identifying the subtypes of WR stars and estimating their numbers
The WR features in galaxies originate mainly in two types of
WR stars
(WN and WC). In the WN types, the emission lines from helium
and nitrogen ions
are often seen in the spectra. The emission lines from helium, carbon,
and oxygen can be considered as characteristic features of WC types.
The relative strengths of these emission lines
determine the early (E) and late (L) subtypes of WN
stars (WNE, WNL)
(e.g., van
der Hucht et al. 1981; Conti et al. 1983; Vacca &
Conti 1992), and WC stars (WCE, WCL)
(e.g., Torres
et al. 1986; Vacca & Conti 1992). In
the blue bump, the broad WR emission lines, such as
![]() 4605, 4620 Å,
4605, 4620 Å, ![]() 4634, 4640 Å,
4634, 4640 Å,
![]() /
/
![]() 4650, 4658 Å, and
4650, 4658 Å, and
![]() 4686 Å are mainly produced by WNL and WCE stars.
In the red bump,
4686 Å are mainly produced by WNL and WCE stars.
In the red bump, ![]() 5808 Å is emitted by WCE.
Normally, WNE stars cannot be distinguished from
other WR stars, since they can emit all these lines.
However, their contribution to the bump can be ignored
because of their lower luminosity and
shorter lifetime than WNL stars.
WCL stars can be identified on the basis of their
5808 Å is emitted by WCE.
Normally, WNE stars cannot be distinguished from
other WR stars, since they can emit all these lines.
However, their contribution to the bump can be ignored
because of their lower luminosity and
shorter lifetime than WNL stars.
WCL stars can be identified on the basis of their
![]() 4650, 5696 Å emission lines.
Another type of WR star, WO, can be identified using oxygen
lines.
Subtypes of WO stars can be classified according to the
relative strengths of their oxygen lines
(Barlow
& Hummer 1982; Vacca & Conti 1992). In
our sample, no object exhibits the features of WO stars.
4650, 5696 Å emission lines.
Another type of WR star, WO, can be identified using oxygen
lines.
Subtypes of WO stars can be classified according to the
relative strengths of their oxygen lines
(Barlow
& Hummer 1982; Vacca & Conti 1992). In
our sample, no object exhibits the features of WO stars.
The number of WR stars in a certain subtype can be estimated from the total luminosity of the blue and/or red bumps divided by the luminosity of a single WR star (Guseva et al. 2000). To determine accurately the luminosities of the bumps, the contributions from nebular lines should be subtracted from the bumps.
The number of
WCE stars can be derived directly from the luminosity of the red bump,
since that luminosity is only produced by WCE stars.
WCE stars are usually represented by WC4 stars. The average
![]() 5808 Å line luminosity of LMC WC stars is
5808 Å line luminosity of LMC WC stars is
![]() erg
erg
![]() (Crowther
& Hadfield 2006; Smith et al. 1990).
(Crowther
& Hadfield 2006; Smith et al. 1990).
To determine the number of WNL stars, we consider the
luminosity of
the blue bump from which we subtract the contribution of WCE stars.
The contribution of WCE in the blue bump can be estimated from
the ratio of the luminosity of WC4 stars in the red bump
to that in the blue bump,
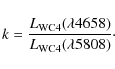
Several values of coefficient k were given by previous works. We adopted the value of
The number of WCL stars can be estimated from the luminosity
of
![]() 5696 Å. For
a WCL single star, the value of luminosity of
5696 Å. For
a WCL single star, the value of luminosity of
![]() 5696 Å
adopted in this work is
5696 Å
adopted in this work is
![]() erg
erg
![]() (Guseva
et al. 2000; Schaerer & Vacca 1998).
However, the luminosity of this weak line in a single star is still not
well known.
(Guseva
et al. 2000; Schaerer & Vacca 1998).
However, the luminosity of this weak line in a single star is still not
well known.
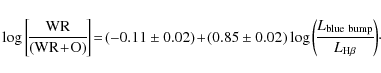
The ratio of relative WR/O star
number can be estimated by applying two methods to optical spectra.
The method developed by Arnault
et al. (1989)
uses the flux in the entire WR blue bump, while another
(Vacca & Conti 1992)
uses only the flux of the broad
![]() 4686 Å line.
We use the first method in this work
because it is more suitable for low resolution spectra, for which
the broad
4686 Å line.
We use the first method in this work
because it is more suitable for low resolution spectra, for which
the broad ![]() 4686 Å line cannot be separated clearly from the bump. The
formula is
4686 Å line cannot be separated clearly from the bump. The
formula is
For each GRB host, both the fluxes and luminosities of the WR bumps and other weak WR features are given in Table 5. Fluxes given here are not corrected for interstellar extinction, while luminosities are absolute ones, which are transformed from these fluxes after being corrected for extinction.
Several sources contribute to the uncertainties in estimating the numbers of WR stars. The luminosity of a single WR star adopted is based on the average of LMC and Milky Way WR stars, which could be higher than our host galaxy sample, because of the difference in metallicity. The difference in metallicity could also affect the value of k. Besides these two major effects, there are three other sources: the observational uncertainty, the errors in the multi-component profile fit, and the contamination by nebular lines to the blue bump. Together, they produce the measured an uncertainty, assumed to be 30-60%, in the number of WR stars and the WR/O star number ratio.
3.3 The results
We present the WR features and the number of WR stars in each of our GRB hosts in detail as follows, and as also given in Table 5.
GRB 980703 - The S/N in
continuum on both sides of the blue bump (hereafter S/N*)
is about 12. We do not detect the convincing WR bump in the
spectrum. However, two WR lines,
![]() 4658 Å and
4658 Å and ![]() 4686 Å are identified, which may be emitted by WNL and WCE
stars (Brinchmann
et al. 2008; Schaerer & Vacca 1998).
The red bump is not included within the spectral range of the spectrum.
Therefore, we cannot verify the WR star subtypes.
4686 Å are identified, which may be emitted by WNL and WCE
stars (Brinchmann
et al. 2008; Schaerer & Vacca 1998).
The red bump is not included within the spectral range of the spectrum.
Therefore, we cannot verify the WR star subtypes.
GRB 020405 - The S/N*
is 10. A blue bump can be seen clearly in the spectrum. Some broad WR
lines, ![]() 4640 Å,
4640 Å, ![]() 4650
4650 ![]() ,
,
![]() 4658 Å, and
4658 Å, and
![]() 4686 Å are identified in the bump, which implies the presence
of WNL and WCE. The weak
4686 Å are identified in the bump, which implies the presence
of WNL and WCE. The weak ![]() 4650 Å indicates the presence of WCL stars. The WR subtypes
and the number of WR stars cannot be verified since there is no red
part to the spectrum.
4650 Å indicates the presence of WCL stars. The WR subtypes
and the number of WR stars cannot be verified since there is no red
part to the spectrum.
GRB 020903 - The S/N*
is about 16.
A strong blue bump is detected in the spectrum. Broad lines
![]() 4605, 4620 Å,
4605, 4620 Å, ![]() 4658 Å,
and
4658 Å,
and ![]() 5808 Å indicate the existence of WNL and WCE stars (Brinchmann et al. 2008).
The number of WCE stars is estimated by using
the luminosity of the red bump, which can be interpreted as being
produced by
5808 Å indicate the existence of WNL and WCE stars (Brinchmann et al. 2008).
The number of WCE stars is estimated by using
the luminosity of the red bump, which can be interpreted as being
produced by ![]() WCE
stars. Adopting the value of k =
WCE
stars. Adopting the value of k =
![]() ,
the
contribution of these WCE stars in the blue bump is
,
the
contribution of these WCE stars in the blue bump is
![]() erg s-1.
After subtracting the contribution of WCE stars, the
luminosity of WNL stars in the blue bump is
erg s-1.
After subtracting the contribution of WCE stars, the
luminosity of WNL stars in the blue bump is
![]() ,
which corresponds to
,
which corresponds to ![]() WNL
stars.
WNL
stars.
GRB 031203 - The S/N*
is about 20. The strong signature of the blue bump is shown in
the spectrum. The broad WR lines
![]() 4658 Å,
4658 Å, ![]() 4686 Å are detected in the blue bump.
In the red part, we do not detect the characteristic line of WCE,
4686 Å are detected in the blue bump.
In the red part, we do not detect the characteristic line of WCE,
![]() 5808, which implies
that the number of WCE in this galaxy can
be ignored. Besides that, the other two WR lines,
5808, which implies
that the number of WCE in this galaxy can
be ignored. Besides that, the other two WR lines,
![]() 4905 Å,
4905 Å, ![]() 5720-40
are also detected. All of these WR features are indicative of WNL stars
(Brinchmann
et al. 2008; Guseva et al. 2000; Smith
et al. 1996). The number of WNL stars is
5720-40
are also detected. All of these WR features are indicative of WNL stars
(Brinchmann
et al. 2008; Guseva et al. 2000; Smith
et al. 1996). The number of WNL stars is
![]() as estimated from the luminosity of the blue bump.
as estimated from the luminosity of the blue bump.
GRB 060218 - The S/N*
is higher than 40.
Many WR lines are identified, including
![]() 4512 Å,
4512 Å, ![]() 4620 Å,
4620 Å, ![]() 4640 Å,
4640 Å, ![]() 4686 Å,
4686 Å, ![]() /
/
![]() 5047 Å, and
5047 Å, and
![]() 5720-40 Å.
All these lines exhibit the characteristics of WNL stars
(Massey 2003;
Brinchmann
et al. 2008; Guseva et al. 2000; Crowther
& Smith 1997). Two WR lines,
5720-40 Å.
All these lines exhibit the characteristics of WNL stars
(Massey 2003;
Brinchmann
et al. 2008; Guseva et al. 2000; Crowther
& Smith 1997). Two WR lines,
![]() 4650 Å and
4650 Å and ![]() 5696 Å, are also
identified, which are characteristic of WCL stars (Brinchmann et al. 2008).
The presence of WCE stars cannot be confirmed, since no
5696 Å, are also
identified, which are characteristic of WCL stars (Brinchmann et al. 2008).
The presence of WCE stars cannot be confirmed, since no
![]() 5808 line is detected. Using
the luminosity of the blue bump, we
estimate the number of WNL stars to be
5808 line is detected. Using
the luminosity of the blue bump, we
estimate the number of WNL stars to be
![]() .
The luminosity of
.
The luminosity of ![]() 5696 Å corresponds to
5696 Å corresponds to ![]() WCL stars.
WCL stars.
The relative WR/O star number ratios are estimated using the
luminosities of
blue bumps and H![]() .
For the hosts of GRB 020405, 020903, 031203, and 060218, the
ratios are
.
For the hosts of GRB 020405, 020903, 031203, and 060218, the
ratios are ![]() ,
,
![]() ,
,
![]() ,
and
,
and ![]() ,
respectively.
,
respectively.
In summary, obvious WR features are detected in 4 out of
5 spectra of long-duration GRB hosts, except for
GRB 980703, which shows
no convincing WR bump but two WR lines. Moreover, the numbers
of WR stars for 3 GRB hosts are in the range from 300 to 6000,
which is consistent
with the typical number of WR stars (![]() 100-105,
Guseva
et al. 2000; Vacca & Conti 1992) in WR
galaxies. High WR/O star number ratios are also estimated in these
4 GRB hosts
Therefore, the presence of WR stars in these GRB hosts
is verified. However, because of the small sample studied here,
the conclusion that WR stars exist in all the long-duration
GRB hosts still cannot be confidently made. The results of this work in
all cases support the scenario that WR stars are the
progenitors of long GRBs,
and are consistent with the previous studies described below.
100-105,
Guseva
et al. 2000; Vacca & Conti 1992) in WR
galaxies. High WR/O star number ratios are also estimated in these
4 GRB hosts
Therefore, the presence of WR stars in these GRB hosts
is verified. However, because of the small sample studied here,
the conclusion that WR stars exist in all the long-duration
GRB hosts still cannot be confidently made. The results of this work in
all cases support the scenario that WR stars are the
progenitors of long GRBs,
and are consistent with the previous studies described below.
Hammer et al. (2006)
first discovered WR stars in three nearby long-duration GRB host
galaxies (GRB 980425, GRB 020903,
GRB 031203)
using deep spectroscopic observations. Since then, little has been done
to detect WR features in long-duration GRB hosts. Margutti et al. (2007)
claimed that the identification of WR emission lines in
GRB 031203 is uncertain. However, their Fig. 3 does
show the strong WR blue bump. The
![]() 4640 Å and
4640 Å and ![]() 4658 Å blended broad lines
can also be identified in the bump, which is not attempted in
their work. Wiersema
et al. (2007) did not detect the obvious
4658 Å blended broad lines
can also be identified in the bump, which is not attempted in
their work. Wiersema
et al. (2007) did not detect the obvious
![]() 4686 Å and WR bump in
GRB 060218. However, we note
that the UVES spectra that they used were taken at a time close to the
burst, which means that the significant contamination by the associated
SN 2006aj
cannot be ignored in the WR feature identification.
In their work, an upper limit to the ratio WR/(WR + O)
for the galaxy is estimated to be <0.4, which is consistent with
the result (WR/O =
4686 Å and WR bump in
GRB 060218. However, we note
that the UVES spectra that they used were taken at a time close to the
burst, which means that the significant contamination by the associated
SN 2006aj
cannot be ignored in the WR feature identification.
In their work, an upper limit to the ratio WR/(WR + O)
for the galaxy is estimated to be <0.4, which is consistent with
the result (WR/O =
![]() )
estimated in this work.
)
estimated in this work.
4 The physical properties of GRB host galaxies
Metallicity is a fundamental parameter for probing the properties of GRB progenitors and the environment of GRB regions. Strong emission lines in spectra of GRB host galaxies allow us to estimate metallicities. The luminosity (stellar mass)-metallicity (L-Z, M*-Z) relation of galaxies is a fundamental relation for indicating their evolutionary status and star-formation histories. We estimate the metallicities of these GRB hosts, and then study them in terms of the L-Z and M*-Z relations.
4.1 AGN contamination
The traditional Baldwin-Phillips-Terlevich (BPT) diagram (Baldwin et al. 1981)
can diagnose the origin of the narrow emission lines of emission-line
galaxies.
Figure 3
shows the locations of GRB host galaxies in the BPT diagram. The
![]() /H
/H![]() vs. [
vs. [
![]() ]/H
]/H![]() diagnostic lines are taken from Kewley
et al. (2001) and Kauffmann
et al. (2003).
The
diagnostic lines are taken from Kewley
et al. (2001) and Kauffmann
et al. (2003).
The ![]() /H
/H![]() vs.
vs. ![]() /H
/H![]() relation from Kewley et al.
(2001) is shown. This illustrates that the GRB host galaxies
are star-forming galaxies and AGN contamination in GRB host galaxies
can be ignored.
relation from Kewley et al.
(2001) is shown. This illustrates that the GRB host galaxies
are star-forming galaxies and AGN contamination in GRB host galaxies
can be ignored.
4.2 Metallicity
In terms of oxygen abundance, the metallicities of GRB hosts can be
estimated using the ![]() method and R23 methods. The
method and R23 methods. The ![]() method based
on electron temperature is a ``direct'' way.
The ``indirect'' method is the so-called ``strong-line'' method, such
as the R23 method based on
the empirical
relationship between O/H and R23.
method based
on electron temperature is a ``direct'' way.
The ``indirect'' method is the so-called ``strong-line'' method, such
as the R23 method based on
the empirical
relationship between O/H and R23.
It is well known that the ![]() method is effective
for metal-poor galaxies because the characteristic line
method is effective
for metal-poor galaxies because the characteristic line
![]() 4363
is only
observable in this
case. Out of 8 galaxies, 5 GRB hosts
(GRB 990712, 020903, 030329, 031203,
and 060218) clearly exhibit an
4363
is only
observable in this
case. Out of 8 galaxies, 5 GRB hosts
(GRB 990712, 020903, 030329, 031203,
and 060218) clearly exhibit an
![]() 4363
line,
which implies that
they have low metallicities and lie on the lower-metallicity branch of
the
R23 diagnostic diagram.
4363
line,
which implies that
they have low metallicities and lie on the lower-metallicity branch of
the
R23 diagnostic diagram.
![]() /
/
![]() also
provides a reliable means of locating a galaxy on the metallicity
branch.
As Kewley et al. (2008)
suggested, the galaxies with
also
provides a reliable means of locating a galaxy on the metallicity
branch.
As Kewley et al. (2008)
suggested, the galaxies with
![]() 6583/
6583/
![]() 3727)
3727)
![]() -1.2
lie on the lower metallicity branch.
All of these 5 objects and the GRB region
of GRB 060505 have values of log(
-1.2
lie on the lower metallicity branch.
All of these 5 objects and the GRB region
of GRB 060505 have values of log(
![]() 6583/
6583/
![]() 3727)
3727)
![]() ,
while the entire GRB 060505 host galaxy lies on the upper
branch, because of the value of its
,
while the entire GRB 060505 host galaxy lies on the upper
branch, because of the value of its
![]() 6583/
6583/
![]() 3727)
3727)
![]() .
The values of
.
The values of ![]() 6583/
6583/
![]() 3727)
are given in Table 6.
For another 2 GRB hosts, 980703, 020405, we cannot verify
the metallicity branch which on they lie because their [NII]6583
lines are not detected. Moreover, we use
3727)
are given in Table 6.
For another 2 GRB hosts, 980703, 020405, we cannot verify
the metallicity branch which on they lie because their [NII]6583
lines are not detected. Moreover, we use ![]() (
(
![]() 6583/H
6583/H![]() )
to verify the metallicity branches (
)
to verify the metallicity branches (
![]() for lower branch;
for lower branch;
![]() for upper branch, Kewley
et al. 2008) for the sample.
These three indicators provide the consistent results for these
galaxies.
for upper branch, Kewley
et al. 2008) for the sample.
These three indicators provide the consistent results for these
galaxies.
![\begin{figure}
\par\includegraphics[width=8.5cm,clip]{12475fig3.eps}
\end{figure}](/articles/aa/full_html/2010/06/aa12475-09/img254.png)
|
Figure 3:
The diagnostic diagrams of GRB host galaxies. In the left
panel, |
| Open with DEXTER | |
Table 6: Metallicities of GRB host galaxies.
For the 5 host galaxies that exhibit the
![]() 4363
emission line,
we use the
4363
emission line,
we use the ![]() method to calculate their oxygen abundances.
Electron temperature and electron density are estimated using the
TEMDEN task of IRAF, which is based on a 5-level atom program and was
described by
Shaw & Dufour (1994).
The flux ratios of
method to calculate their oxygen abundances.
Electron temperature and electron density are estimated using the
TEMDEN task of IRAF, which is based on a 5-level atom program and was
described by
Shaw & Dufour (1994).
The flux ratios of ![]() I(4959+5007)/I(4363)
are adopted to
calculate electron temperature when available.
Using the flux ratio of
I(4959+5007)/I(4363)
are adopted to
calculate electron temperature when available.
Using the flux ratio of ![]() I(6716)/I(6731),
the electron density can be derived, which is needed in the electron
temperature
and oxygen abundance calculation.
I(6716)/I(6731),
the electron density can be derived, which is needed in the electron
temperature
and oxygen abundance calculation.
When carrying out the electron density calculation, the
![]() I(6716)/I(6731)
doublet is not available or too noisy for
some objects in our sample.
Therefore, we tested the sensitivities of both electron
temperature and oxygen abundance to electron density, finding that
neither is very sensitive to electron density.
This allows us to estimate oxygen abundance for a wide range of
electron
density (20-200
I(6716)/I(6731)
doublet is not available or too noisy for
some objects in our sample.
Therefore, we tested the sensitivities of both electron
temperature and oxygen abundance to electron density, finding that
neither is very sensitive to electron density.
This allows us to estimate oxygen abundance for a wide range of
electron
density (20-200
![]() )
without significant bias (the discrepancy is less than 5%). To
calculate
)
without significant bias (the discrepancy is less than 5%). To
calculate ![]() -based
oxygen abundances, we use the
methods described by Stasinska
(2005), Izotov
et al. (2006), Yin
et al. (2007), Liang
et al. (2006).
-based
oxygen abundances, we use the
methods described by Stasinska
(2005), Izotov
et al. (2006), Yin
et al. (2007), Liang
et al. (2006).
The R23 method has
been extensively discussed in the literature (Tremonti et al. 2004; Yin et al.
2007; Kobulnicky
et al. 1999; Liang et al. 2007; Pagel
et al. 1979; McGaugh 1991).
To estimate their R23-based
metallicities,
we adopt the formulae of Kobulnicky
et al. (1999) for both the
upper and lower branches of R23-(O/H)
solutions.
We use indicators of ![]() 6583/
6583/
![]() 3727
and
3727
and ![]() 6583/H
6583/H![]() to break the R23 degeneracy.
The estimated oxygen abundances and errors are listed in Table 6. The
to break the R23 degeneracy.
The estimated oxygen abundances and errors are listed in Table 6. The ![]() -based and R23-based
metallicity estimates have an acceptable discrepancy of
0.03-0.3 dex.
-based and R23-based
metallicity estimates have an acceptable discrepancy of
0.03-0.3 dex.
Table 7: Photometry of GRB host galaxies.
We now compare our metallicity estimates with those in the
literature.
There are four objects for which ![]() -based oxygen abundances
have been estimated in the literature. For the host of
GRB 020903, Hammer
et al. (2006) measured a 12+
-based oxygen abundances
have been estimated in the literature. For the host of
GRB 020903, Hammer
et al. (2006) measured a 12+![]() (O/H)
(O/H)
![]() of
7.97, which is very consistent with this work (8.01) within
the errorbars;
Savaglio09 gave 8.22, which is 0.21 dex higher. For the host of GRB
030329, Levesque et al.
(2009) obtained 7.72 from Keck
spectra, while we obtain 7.65. These two estimates
are extremely consistent within the errorbars.
For the host of GRB 031203, Prochaska
et al. (2004) obtained 8.10, Margutti et al. (2007)
inferred 8.12, Levesque
et al. (2009) obtained 7.96, and Savaglio09
measured 8.02, while we obtain 8.14. All of these
estimates
are consistent within the errorbars.
of
7.97, which is very consistent with this work (8.01) within
the errorbars;
Savaglio09 gave 8.22, which is 0.21 dex higher. For the host of GRB
030329, Levesque et al.
(2009) obtained 7.72 from Keck
spectra, while we obtain 7.65. These two estimates
are extremely consistent within the errorbars.
For the host of GRB 031203, Prochaska
et al. (2004) obtained 8.10, Margutti et al. (2007)
inferred 8.12, Levesque
et al. (2009) obtained 7.96, and Savaglio09
measured 8.02, while we obtain 8.14. All of these
estimates
are consistent within the errorbars.
For the host of GRB 060218, Wiersema
et al. (2007)
measured a ![]() (O/H)
value of 7.54, Levesque
et al. (2009) obtained 7.62, Savaglio09
measured 7.29, and we inferred 7.88, which is closest
to the second value.
The discrepancy between these works could be caused by
contamination by the associated supernova. Savaglio09 gathered the very
early-time spectra observed by Pian
et al. (2006) and Sollerman
et al. (2006). Wiersema
et al. (2007) acquired their spectrum within
1 month of the burst, while our spectrum of the host was taken
in Dec. 2006, 10 months after the burst, and Levesque et al. (2009)
took the spectrum even later
(19 months after the burst). In this case, the contamination
of the GRB 060218 host galaxy by the light of SN2006aj was
significant and lasted for several months. This contribution strongly
affects measurements of emission lines; hence, the errors in the
metallicity estimates for the early
spectra might be large. Our result is close to that of Levesque et al. (2009),
which is also derived from the late-time observation. Anyway, all of
them show this host has low metallicity.
(O/H)
value of 7.54, Levesque
et al. (2009) obtained 7.62, Savaglio09
measured 7.29, and we inferred 7.88, which is closest
to the second value.
The discrepancy between these works could be caused by
contamination by the associated supernova. Savaglio09 gathered the very
early-time spectra observed by Pian
et al. (2006) and Sollerman
et al. (2006). Wiersema
et al. (2007) acquired their spectrum within
1 month of the burst, while our spectrum of the host was taken
in Dec. 2006, 10 months after the burst, and Levesque et al. (2009)
took the spectrum even later
(19 months after the burst). In this case, the contamination
of the GRB 060218 host galaxy by the light of SN2006aj was
significant and lasted for several months. This contribution strongly
affects measurements of emission lines; hence, the errors in the
metallicity estimates for the early
spectra might be large. Our result is close to that of Levesque et al. (2009),
which is also derived from the late-time observation. Anyway, all of
them show this host has low metallicity.
We do not compare our R23-based
estimates with any other work, because different calibrations provide
very different values, and we discussed the discrepancy between our own
![]() and R23-based
abundances
above.
and R23-based
abundances
above.
4.3 Luminosity vs. metallicity
We obtain multi-band photometry from
literature, which is shown in Table 7.
All apparent magnitudes are corrected for Galactic foreground
extinction
(Schlegel et al. 1998)
and internal extinction.
The k-correction is performed for the magnitudes to
z=0 by using the
kcorrect v4-1-4 program![]() (Oke &
Sandage 1968; Hogg
et al. 2002; Blanto & Roweis 2007).
The absolute B- and K-band
magnitudes
corrected for Galactic extinction are given
in Table 8.
We plot our long-duration GRB hosts on the L-Z
diagram (Fig. 4),
which is presented
in terms of absolute B magnitude and the R23-based
metallicities.
The magnitude and metallicity of the entire GRB 060505 host galaxy
are presented in the L-Z
diagram.
For GRB 980703, the mean value between the
lower and upper branch is adopted,
when the R23 degeneracy
cannot be broken.
The L-Z relations of various
low and high redshift samples from the literature (SDSS star-forming
galaxies from Tremonti
et al. (2004),
UV-selected galaxies from
Contini et al. (2002),
large magnitude-limited sample from Lamareille
et al. (2004),
emission-line-selected galaxies from Melbourne
& Salzer (2002), irregular
and spiral galaxies from Kobulnicky
& Zaritsky (1999),
and irregular galaxies from Skillman
et al. (1989) and Richer
& McCall (1995))
are also shown in Fig. 4.
In comparison with the L-Z
relation, the GRB hosts
show an obvious discrepancy from other samples.
GRB hosts have lower metallicity values than other galaxies at given
luminosities. For luminous GRB hosts, this discrepancy is even larger.
This trend is also shown in Levesque
et al. (2009).
(Oke &
Sandage 1968; Hogg
et al. 2002; Blanto & Roweis 2007).
The absolute B- and K-band
magnitudes
corrected for Galactic extinction are given
in Table 8.
We plot our long-duration GRB hosts on the L-Z
diagram (Fig. 4),
which is presented
in terms of absolute B magnitude and the R23-based
metallicities.
The magnitude and metallicity of the entire GRB 060505 host galaxy
are presented in the L-Z
diagram.
For GRB 980703, the mean value between the
lower and upper branch is adopted,
when the R23 degeneracy
cannot be broken.
The L-Z relations of various
low and high redshift samples from the literature (SDSS star-forming
galaxies from Tremonti
et al. (2004),
UV-selected galaxies from
Contini et al. (2002),
large magnitude-limited sample from Lamareille
et al. (2004),
emission-line-selected galaxies from Melbourne
& Salzer (2002), irregular
and spiral galaxies from Kobulnicky
& Zaritsky (1999),
and irregular galaxies from Skillman
et al. (1989) and Richer
& McCall (1995))
are also shown in Fig. 4.
In comparison with the L-Z
relation, the GRB hosts
show an obvious discrepancy from other samples.
GRB hosts have lower metallicity values than other galaxies at given
luminosities. For luminous GRB hosts, this discrepancy is even larger.
This trend is also shown in Levesque
et al. (2009).
Table 8: Magnitudes and stellar masses of GRB host galaxies.
![\begin{figure}
\par\includegraphics[width=9cm,clip]{12475fig4.eps}
\end{figure}](/articles/aa/full_html/2010/06/aa12475-09/img344.png)
|
Figure 4: The L-Z relation of long-duration GRB hosts. The R23-based metallicities are adopted. The blue filled circles represent oxygen abundances which break the degeneracy of R23. The black star represents the mean value between the lower and upper branch of GRB 980703. The open circle represents the entire host of GRB 060505. Luminosity-metallicity relation for SDSS galaxies and various galaxy samples are drawn from the literature (see legend). See the online color version for more details. |
| Open with DEXTER | |
4.4 Stellar mass vs. gas phase metallicity
The stellar mass of galaxy can be estimated from the stellar
mass-to-light ratio and color following Bell
et al. (2003).
We use the (B-V) color and MK
to estimate the stellar masses of GRB host galaxies. The
formula is
![$\displaystyle \log \left( \frac{M_*}{M_{\odot}} \right) = - 0.4(M_{K}-3.28)+[a_K+b_K (B-V)+0.15],$](/articles/aa/full_html/2010/06/aa12475-09/img345.png)
where MK is the K-band absolute magnitude and (B-V) is the rest-frame color. The coefficients aK and bK come from Table 7 of Bell et al. (2003). The stellar masses are listed in the last column of Table 8. We compare our results with previous work on GRB hosts (Savaglio et al. 2009; Castro Cerón et al. 2006; Chary et al. 2002; Castro Cerón et al. 2008). Our results are more consistent with the stellar masses derived by Castro Cerón et al. (2008) within the errorbars. However, our results are systematically higher than theirs by
![\begin{figure*}
\par\includegraphics[width=16cm,clip]{12475fig5.eps}
\end{figure*}](/articles/aa/full_html/2010/06/aa12475-09/img346.png)
|
Figure 5:
In the left panel, the |
| Open with DEXTER | |
We plot our long-duration GRB hosts on the stellar
mass-metallicity (M*-Z)
diagram (Fig. 5).
The ![]() -
and R23-based metallicities
are adopted and
plotted in the left and right panels, respectively. In the right panel,
the open circle and black filled star represent the hosts of
GRB 060505 (not the GRB region) and
GRB 980703, respectively. The M*-Z
relation of local normal star-forming galaxies selected from SDSS
derived by Liang et al. (2007)
is given in Fig. 5
(the red dashed line derived from the
-
and R23-based metallicities
are adopted and
plotted in the left and right panels, respectively. In the right panel,
the open circle and black filled star represent the hosts of
GRB 060505 (not the GRB region) and
GRB 980703, respectively. The M*-Z
relation of local normal star-forming galaxies selected from SDSS
derived by Liang et al. (2007)
is given in Fig. 5
(the red dashed line derived from the ![]() method in the left panel; the red dotted line derived from the R23method
in the right panel). The
method in the left panel; the red dotted line derived from the R23method
in the right panel). The ![]() - and R23-based
metallicities of long-duration GRB host galaxies are all obviously
lower than those of local star-forming galaxies with comparable stellar
masses.
- and R23-based
metallicities of long-duration GRB host galaxies are all obviously
lower than those of local star-forming galaxies with comparable stellar
masses.
5 Discussion and conclusions
We have attempted to identify the WR stars in GRB host galaxies. According to the collapsar model, WR stars are considered as the most favored candidates of the progenitor of long-duration GRBs, therefore the presence of WR stars in long-duration GRB hosts can directly validate this model. We have investigated a sample of 8 GRB host galaxies from archival data from VLT/FORS2. Out of those 8 GRB hosts, 5 galaxies having spectra with S/N > 10 were for our sample to detect the WR features. The presence of WR features was verified in this entire sample. Out of those 5 GRB hosts, 4 certainly have WR features detected, which are GRB 020903, GRB 031203, GRB 020405, and GRB 060218. For the remaining one, GRB 980703, the detection is marginal. The subtypes and numbers of WR stars in those 5 GRB hosts were also derived. Those results strongly support the collapsar model by illustrating the link between WR stars and GRBs.
Additional aim was to investigate the physical properties of long-duration GRB host galaxies, such as metallicity, luminosity, and stellar mass. Comparing with literature, we used the most consistent measurements and calculation methods for all 8 objects to ensure systematic coherence and comparability. We found that the long-duration GRB hosts show obvious disagreement with the L-Z and M*-Z relations derived for low redshift galaxies in several samples. The luminous and massive long-duration GRB hosts have lower metallicities than other galaxies in these samples.
The WR/O star ratio in WR galaxies is found to decrease as a
function of decreasing
metallicity by Crowther
& Hadfield (2006).
The WR/O star ratio and metallicity in GRB host galaxies
do not show a clear trend.
However, compared to
WR galaxies (Guseva et al.
2000),
the observed WR/O ratios are higher in the GRB hosts studied here,
while
metallicities in GRB hosts are
obviously lower than in
the numerous population of low redshift galaxies.
This suggests that the hosted regions of GRBs
are consistent with the first stage
of star formation in a relatively pristine medium.
Furthermore, the ratio of WC/WN stars is also found to decrease with
metallicity.
The relation between the ratio of WC/WN stars and metallicity
was derived by Massey (2003).
The hosts of GRB 020903, 060218 deviate from the relation,
in having higher WC/WN ratios of ![]() 0.5 and 0.1 than Local Group galaxies (see their
Fig. 11, the upper panel). The collapsar model suggests that
the WC stars are more likely to be the progenitors of
long-duration GRBs than the WN stars.
Therefore, the observed high WC/WN ratio could also be evidence to
support this model, although the sample is small.
0.5 and 0.1 than Local Group galaxies (see their
Fig. 11, the upper panel). The collapsar model suggests that
the WC stars are more likely to be the progenitors of
long-duration GRBs than the WN stars.
Therefore, the observed high WC/WN ratio could also be evidence to
support this model, although the sample is small.
One of our galaxies, the host of GRB 060505, is well
resolved in the
ground-based observation. However, the type of this burst remains a
topic of debate. GRB 060505 has a burst duration of ![]() 4 s,
but lacks evidence of an accompanying supernova. It is classified as a
long-duration GRBs that have no
associated supernovae (e.g., GRB 060614) by
Thöne et al. (2008).
However, Levesque & Kewley
(2007)
suggest that the environment of GRB 060505 is more consistent
with the host environments of short-duration GRBs. We have investigated
the metallicity of the GRB site and
the entire host galaxy separately. We have found a relatively low
metallicity in the GRB region and a higher one in the entire
host, which are consistent with Thöne
et al. (2008). Unfortunately, the S/N
of its spectrum is not high enough to detect WR star features.
However, a very young (
4 s,
but lacks evidence of an accompanying supernova. It is classified as a
long-duration GRBs that have no
associated supernovae (e.g., GRB 060614) by
Thöne et al. (2008).
However, Levesque & Kewley
(2007)
suggest that the environment of GRB 060505 is more consistent
with the host environments of short-duration GRBs. We have investigated
the metallicity of the GRB site and
the entire host galaxy separately. We have found a relatively low
metallicity in the GRB region and a higher one in the entire
host, which are consistent with Thöne
et al. (2008). Unfortunately, the S/N
of its spectrum is not high enough to detect WR star features.
However, a very young (![]() 6 Myr)
stellar population in the GRB site is found by Thöne
et al. (2008) using stellar population modeling.
This low age corresponds to the lifetime of a 32
6 Myr)
stellar population in the GRB site is found by Thöne
et al. (2008) using stellar population modeling.
This low age corresponds to the lifetime of a 32 ![]() star. Evidence from the properties of the GRB region suggests that the
GRB 060505 originated in a long-duration core-collapse
progenitor.
star. Evidence from the properties of the GRB region suggests that the
GRB 060505 originated in a long-duration core-collapse
progenitor.
Most of the GRB host galaxies in our sample are too distant to allow spatially resolved analysis with ground-based spectroscopic observations. Therefore, the only information that we can derive concerns about the global properties of galaxies. The properties of the actual explosion sites are still unclear. For further study of GRB progenitors and properties of GRB host galaxies, more high-resolution images and deep spectroscopy are needed. X-shooter at the VLT will be the ideal instrument to investigate in greater detail the chemical and stellar population properties of GRBs.
AcknowledgementsWe thank the anonymous referee for very helpful comments, which improve well this work. We are very grateful to P. A. Crowther, X. Y. Chen, H. L. Li, J. Wang, L. P. Xin, and W. K. Zheng for very helpful discussions. We acknowledges James Wicker for his careful correcting of English. This work was supported by the Natural Science Foundation of China (NSFC 10933001, 10573028, 10673002, 10803008, 10821061, 10833005); the National Basic Research Program of China (973 Program, 2007CB815402, 2007CB815404, 2007CB815406, 2009CB824800); the Young Researcher Grant of National Astronomical Observatories, Chinese Academy of Sciences; and the Group Innovation Project (10821302). The STARLIGHT project is supported by the Brazilian agencies CNPq, CAPES and FAPESP and by the France-Brizil CAPES/Cofecub program.
References
- Allen, D. A., Wright, A. E., & Goss, W. M. 1976, MNRAS, 177, 91
- Arnault, Ph., Kunth, D., & Schild, H. 1989, A&A, 224, 73
- Baldwin, A., Phillips, M. M., & Terlevich, R. 1981, PASP, 93, 817
- Barlow, M. J., & Hummer, D. G. 1982, in Wolf-Rayet Stars: Observations, Physics, and Evolution, ed. C. W. H. de Loore, & A. J. Willlis (Dordrecht: Reidel), IAU Symp. 99, 387
- Bell, E. F., McIntosh, D. H., Katz, N., et al. 2003, ApJS, 149, 289
- Berger, E. 2008, ApJ, 690, 231
- Bersier, D., Fruchter, A. S., Strolger, L. G., et al. 2006, ApJ, 643, 284
- Blanton, M. R., & Roweis, S. 2007, AJ, 133, 734
- Brinchmann, J., Kunth, D., & Durret, F. 2008, A&A, 485, 657
- Bruzual, G., & Charlot, S. 2003, MNRAS, 344, 1000
- Cardelli, J. A., Clayton, G. C., & Mathis, J. S. 1989, ApJ, 345, 245
- Castro Cerón, J. M., Michalowski, M. J., Hjorth, J., et al. 2006, ApJ, 653, 85
- Castro Cerón, J. M., Michalowski, M. J., Hjorth, J., et al. 2008, [arXiv:0803.2235v2]
- Chary, R., Becklin, E. E., & Armus, L. 2002, ApJ, 566, 229
- Christensen, L., Hjorth, J., & Gorosabel, J. 2004, A&A, 425, 913
- Cid Fernandes, R., Mateus, A., Sodré, L., Stasinska, G., & Gomes, J. M. 2005, MNRAS, 358, 363
- Conti, P. S. 1991, ApJ, 377, 115
- Conti, P. S., Leep, E. M., & Perry, D. N. 1983, ApJ, 268, 228
- Contini, T., Treyer, M. A., Sullivan, M., et al. 2002, MNRAS, 330, 75
- Courty, S., Björnsson, G., & Gudmundsson, E. H. 2004, MNRAS, 354, 581
- Crowther, P. A., & Hadfield, L. J. 2006, A&A, 449, 711
- Crowther, P. A., & Smith, L. J. 1997, A&A, 320 500
- Dinerstein, H. L., & Shields, G. A. 1986, ApJ, 311, 45
- Fynbo, J. P. U., Jakobsson, P., Möller, P., et al. 2003, A&A, 406, L63
- Fynbo, J. P. U., Watson, D., Thöne, C. C., et al. 2006, Nature, 444, 1047
- Gorosabel, J., Jelínek, M., de Ugarte Postigo, A., Guziy, S., & Castro-Tirado, A. J. 2005, Nuovo Cimento C, 28, 677
- Guseva, N. G., Izotov, Y. I., & Thuan, T. X. 2000, ApJ, 531, 776
- Hammer, F., Flores, H., Schaerer, D., et al. 2006, A&A, 454, 103
- Hartmann, D. H. 2005, Nature, 436, 923
- Hirschi, R., Meynet, G., & Maeder, A. 2005, A&A, 443, 581
- Hjorth, J., Watson, D., Fynbo, J. P. U., et al. 2005, Nature, 437, 859
- Hogg, D. W., Blanton, M., Strateva, I., et al. 2002, AJ, 124, 646
- Izotov, Y. I., & Thuan, T. X. 1998, ApJ, 500, 188
- Izotov, Y. I., Stasinska, G., Meynet, G., Guseva, N. G., & Thuan, T. X. 2006, A&A, 448, 955
- Kauffmann, G., Heckman, T. M., Tremonti, C., et al. 2003, MNRAS, 346, 1055
- Kewley, L. J., & Ellison, S. L. 2008, ApJ, 681, 1183
- Kewley, L. J., Dopita, M. A., Sutherland, R. S., Heisler, C. A., & Trevena, J. 2001, ApJ, 556, 121
- Kewley, L. J., Brown, W. R., Geller, M. J., Kenyon, S. J., & Kurtz, M. J. 2007, AJ, 133, 882
- Klebesadel, R. W., Strong, I. B., & Olson, R. A. 1973, ApJ, 182, 85
- Klose, S., Greiner, J., Rau, A., et al. 2004, AJ, 128, 1942
- Kobulnicky, H. A., & Zaritsky, D. 1999, ApJ, 511, 118
- Kobulnicky, H. A., Kennicutt, R. C. Jr., & Pizagno, J. L. 1999, ApJ, 514, 544
- Kocevski, D., Modjaz, M., Bloom, J. S., et al. 2007, ApJ, 663, 1180
- Kouveliotou, C., Meegan, C. A., Fishman, G. J., et al. 1993, ApJ, 413, 101
- Kunth, D., & Joubert, M. 1985, A&A, 142, 411
- Kunth, D., & Schild, H. 1986, A&A, 169, 71
- Lamareille, F., Mouhcine, M., Contini, T., Lewis, L., & Maddox, S. 2004, MNRAS, 350, 396
- Le Floc'h, E., Duc, P.-A., Mirabel, I. F., et al. 2003, A&A, 400, 499
- Levesque, E. M., & Kewley, L. J. 2007, ApJ, 667, 121
- Levesque, E. M., Berger, E., Kewley, L. J., et al. 2010, AJ, 139, 694
- Liang, Y. C., Hammer, F., Deng, L. C., et al. 2006, PABei, 24, 335
- Liang, Y. C., Hammer, F., Yin, S. Y., et al. 2007, A&A, 473, 411
- MacFadyen, A. I., & Woosley, S. E. 1999, ApJ, 524, 262
- Margutti, R., Chincarini, G., Covino, S., et al. 2007, A&A, 474, 815
- Massey, P. 2003, ARA&A, 41, 15
- Massey, P., & Conti, P. 1980, ApJ, 242, 638
- Massey, P., & Conti, P. 1983, PASP, 95, 440
- McGaugh, S. S. 1991, ApJ, 380, 140
- Melbourne, J., & Salzer, J. J. 2002, AJ, 123, 2302
- Oke, J. B., & Sandage, A. 1968, ApJ, 154, 21
- Osterbrock, D. E. 1989, Astrophysics of Gaseous Nebulae and Active Galactic Nuclei (Mill Valley, California: University Science Books)
- Pagel, B. E., Edmunds, M. G., Blackwell, D. E., Chun, M. S., & Smith, G. 1979, MNRAS, 189, 95
- Petrovic, J., Langer, N., Yoon, S.-C., et al. 2005, A&A, 435, 247
- Pian, E., Mazzali, P. A., Masetti, N., et al. 2006, Nature, 442, 1011
- Prochaska, J. X., Bloom, J. S., Chen, H.-W., et al. 2004, ApJ, 611, 200
- Richer, M. G., & McCall, M. L. 1995, ApJ, 445, 642
- Salpeter, E. E. 1955, ApJ, 121, 161
- Savaglio, S., Glazebrook, K., & Le Borgne, D. 2009, ApJ, 691, 182
- Schaerer, D., & Vacca, W. D. 1998, ApJ, 497, 618
- Schlegel, D. J., Finkbeiner, D. P., & Davis, M. 1998, ApJ, 500, 525
- Seaton, M. J. 1979, MNRAS, 187, 73
- Shaw, R. A., & Dufour, R. J. 1994, Astronomical Data Analysis Software and Systems III, ed. D. R. Crabtree, R. J. Hanisch, & J. Barnes, ASP Conf. Ser., 61, 327
- Skillman, E. D., Kennicutt, R. C., Jr., & Hodge, P. W. 1989, ApJ, 347, 875
- Smith, L. F., Shara, M. M., & Moffat, A. F. J. 1990, ApJ, 348, 471
- Smith, L. F., Shara, M. M., & Moffat, A. F. J. 1996, MNRAS, 281, 163
- Soderberg, A. M., Kulkarni, S. R., & Berger, E. 2004, ApJ, 606, 994
- Sokolov, V. V., Fatkhullin, T. A., Castro-Tirado, A. J., et al. 2001, A&A, 372, 438
- Sollerman, J., Jaunsen, A. O., Fynbo, J. P. U., et al. 2006, A&A, 454, 503
- Stasinska, G. 2005, A&A, 434, 507
- Thöne, C. C., Fynbo, J. P. U., Östlin, G., et al. 2008, ApJ, 676, 1151
- Tremonti, C. A., Heckman, T. M., Kauffmann, G., et al. 2004, ApJ, 613, 898
- Torres, A. V., Conti, P. S., & Massey, P. 1986, ApJ, 300, 379
- Vacca, W. D., & Conti, P. S. 1992, ApJ, 401, 543
- van der Hucht, K. A., Conti, P. S., Lundström, I., et al. 1981, Space Sci. Rev., 28, 227
- van Paradijs, J., Groot, P. J., Galama, T., et al. 1997, Nature, 386, 686
- Vreeswijk, P. M., Galama, T. J., Owens, A., et al. 1999, ApJ, 523, 171
- Wainwright, C., Berger, E., & Penprase, B. E. 2007, ApJ, 657, 367
- Wiersema, K., Savaglio, S., Vreeswijk, P. M., et al. 2007, A&A, 464, 529
- Woosley, S. E., & Heger, A. 2006, ApJ, 637, 914
- Woosley, S. E., Langer, N., & Weaver, T. A. 1993, ApJ, 411, 823
- Yin, S. Y., Liang, Y. C., Hammer, F., et al. 2007, A&A, 462, 535
- Yoon, S.-C., & Langer, N. 2005, A&A, 443, 643
Footnotes
- ... afterglows
![[*]](/icons/foot_motif.png)
- For the most complete list of GRBs, see the URL: http://www.mpe.mpg.de/ jcg/grbgen.html, maintained by J. Greiner.
- ... VLT/FORS2
- http://archive. eso.org/eso/eso-archive-main.html
- ...
IRAF
- IRAF is distributed by the National Optical Astronomical Observatories, and is operated by the Association of Universities for Research in Astronomy, Inc., under cooperative agreement with the National Science Foundation.
- ... NED
- http://nedwww.ipac. caltech.edu/
- ... STARLIGHT
- http://www.starlight,ufsc.br
- ... program
- http://cosmo.nyu.edu/ mb144/kcorrect/
All Tables
Table 1: Basic information of the GRB host galaxies.
Table 2: Spectroscopic observations of GRB host galaxies from VLT/FORS2.
Table 3:
Emission line fluxes of GRB host galaxies (in units of
![]() ,
corrected for Galactic extinction).
,
corrected for Galactic extinction).
Table 4: Dust extinction of GRB host galaxies.
Table 5: Properties of WR stars in GRB hosts.
Table 6: Metallicities of GRB host galaxies.
Table 7: Photometry of GRB host galaxies.
Table 8: Magnitudes and stellar masses of GRB host galaxies.
All Figures
|
|
Figure 1: The spectrum of host galaxy of GRB 031203. The spectral synthesis fitting is plotted in red line. The strong emission lines are marked. |
| Open with DEXTER | |
| In the text | |
|
|
Figure 2: The spectra of GRB hosts are plotted in the left panels. The continuums are marked using red lines, which are the results of the Starlight fit using BC03 templates. The blue boxes indicate the WR blue and red bumps. The WR emission lines are marked in red dot-dashed lines. In the right panels, the fits of WR bumps are plotted in red profiles. The fits of individual WR line and nebular line are plotted in green and blue profiles respectively (for more details, please see the online color version). |
| Open with DEXTER | |
| In the text | |
|
|
Figure 3:
The diagnostic diagrams of GRB host galaxies. In the left
panel, |
| Open with DEXTER | |
| In the text | |
|
|
Figure 4: The L-Z relation of long-duration GRB hosts. The R23-based metallicities are adopted. The blue filled circles represent oxygen abundances which break the degeneracy of R23. The black star represents the mean value between the lower and upper branch of GRB 980703. The open circle represents the entire host of GRB 060505. Luminosity-metallicity relation for SDSS galaxies and various galaxy samples are drawn from the literature (see legend). See the online color version for more details. |
| Open with DEXTER | |
| In the text | |
|
|
Figure 5:
In the left panel, the |
| Open with DEXTER | |
| In the text | |
Copyright ESO 2010
Current usage metrics show cumulative count of Article Views (full-text article views including HTML views, PDF and ePub downloads, according to the available data) and Abstracts Views on Vision4Press platform.
Data correspond to usage on the plateform after 2015. The current usage metrics is available 48-96 hours after online publication and is updated daily on week days.
Initial download of the metrics may take a while.