| Issue |
A&A
Volume 513, April 2010
|
|
|---|---|---|
| Article Number | A31 | |
| Number of page(s) | 10 | |
| Section | Interstellar and circumstellar matter | |
| DOI | https://doi.org/10.1051/0004-6361/200913970 | |
| Published online | 20 April 2010 | |
Gas phase atomic metals in the circumstellar envelope of IRC+10216![[*]](/icons/foot_motif.png)
N. Mauron1 - P. J. Huggins2
1 - GRAAL, CNRS and Université Montpellier II,
Place Bataillon, 34095 Montpellier, France
2 -
Physics Department, New York University, 4 Washington Place, New York NY 10003, USA
Received 24 December 2009 / Accepted 11 February 2010
Abstract
We report the results of a search for gas phase atomic metals in the
circumstellar envelope of the asymptotic giant branch carbon star
IRC+10216. The search was made using high resolution (
![]() )
optical absorption spectroscopy of a
background star that probes the envelope on a line of sight 35
)
optical absorption spectroscopy of a
background star that probes the envelope on a line of sight 35
![]() from the center. The metal species that we detect in the envelope
include Na I, K I, Ca I, Ca II, Cr I, and Fe I, with upper limits for
Al I, Mn I, Ti I, Ti II, and Sr II. The observations are used to
determine the metal abundances in the gas phase and the condensation
onto grains. The metal depletions in the envelope range from a factor
of 5 for Na to 300 for Ca, with some similarity to the depletion
pattern in interstellar clouds. Our results directly constrain the
condensation efficiency of metals in a carbon-rich circumstellar
envelope and the mix of solid and gas phase metals returned by the
star to the interstellar medium. The abundances of the uncondensed
metal atoms that we observe are typically larger than the abundances
of the metal-bearing molecules detected in the envelope. The metal
atoms are therefore the major metal species in the gas phase and
likely play a key role in the metal chemistry.
from the center. The metal species that we detect in the envelope
include Na I, K I, Ca I, Ca II, Cr I, and Fe I, with upper limits for
Al I, Mn I, Ti I, Ti II, and Sr II. The observations are used to
determine the metal abundances in the gas phase and the condensation
onto grains. The metal depletions in the envelope range from a factor
of 5 for Na to 300 for Ca, with some similarity to the depletion
pattern in interstellar clouds. Our results directly constrain the
condensation efficiency of metals in a carbon-rich circumstellar
envelope and the mix of solid and gas phase metals returned by the
star to the interstellar medium. The abundances of the uncondensed
metal atoms that we observe are typically larger than the abundances
of the metal-bearing molecules detected in the envelope. The metal
atoms are therefore the major metal species in the gas phase and
likely play a key role in the metal chemistry.
Key words: stars: AGB and post-AGB - stars: carbon - stars: mass-loss - circumstellar matter
1 Introduction
Metals are important constituents of the interstellar medium. Abundant metals such as calcium and iron are among the most heavily depleted elements in dense clouds, and therefore form a significant component of interstellar dust. The process of dust formation is not well understood (e.g., Draine 2009), but much of the raw material is supplied by mass loss from evolved stars, especially the asymptotic giant branch (AGB) stars.
In the winds of oxygen-rich AGB stars, the dust is primarily in the form of metal silicates, so that the metals play an important role in the formation of dust and the mass loss process. In carbon-rich AGB stars, the situation is less clear. The dust is believed to consist mainly of graphite or amorphous carbon, and silicon carbide. The extent to which metals contribute to dust formation, and the form in which they are returned to the interstellar medium is essentially unknown.
In this paper, we report the first comprehensive search for gas phase
atomic metals in a carbon-rich circumstellar envelope. IRC+10216
(IRC+10216) is the nearest carbon star with a thick circumstellar envelope,
and serves as an archetype for the study of mass loss on the AGB. The
star is relatively faint, ![]() 16.0 mag. in the R-band and much fainter at
shorter wavelengths because of obscuration by the envelope, but at
longer wavelengths the circumstellar dust and gas are seen in
emission, and are brighter than for any similar object. IRC+10216 has
therefore been intensively observed, with more than 50 molecular
species detected in the envelope, including several metal bearing
species (e.g., Olofsson 2005; Ziurys 2006a)
16.0 mag. in the R-band and much fainter at
shorter wavelengths because of obscuration by the envelope, but at
longer wavelengths the circumstellar dust and gas are seen in
emission, and are brighter than for any similar object. IRC+10216 has
therefore been intensively observed, with more than 50 molecular
species detected in the envelope, including several metal bearing
species (e.g., Olofsson 2005; Ziurys 2006a)
The technique that we use here to search for atomic metals in the
envelope of IRC+10216 is optical absorption spectroscopy, using a
background source of illumination. The star itself is too faint and
its spectrum too complex to serve as a useful source for detailed
study, although circumstellar C2 and CN have been observed in this
way (Bakker et al. 1997). There are, however, other stars
in the field. IRC+10216 is nearby, at a distance of ![]() 120 pc
(e.g., Ramstedt et al. 2008), so the circumstellar envelope extends a
considerable angle on the sky. It is detected out to a distance of
120 pc
(e.g., Ramstedt et al. 2008), so the circumstellar envelope extends a
considerable angle on the sky. It is detected out to a distance of
![]()
![]() from the center in millimeter CO emission (Huggins et al. 1988), and 9
from the center in millimeter CO emission (Huggins et al. 1988), and 9![]() in infrared dust emission observed with IRAS
(Young et al. 1993). Although IRC+10216 is at a relatively high
galactic latitude (
in infrared dust emission observed with IRAS
(Young et al. 1993). Although IRC+10216 is at a relatively high
galactic latitude (
![]() ,
,
![]() ), there are several
stars in this region of the sky that are candidates for background
sources, as seen in the wide field image in Fig. 1 of Mauron &
Huggins (1999).
), there are several
stars in this region of the sky that are candidates for background
sources, as seen in the wide field image in Fig. 1 of Mauron &
Huggins (1999).
One of these stars, Star 6 in the UBV photometric sequence of the
field by Mauron et al. (2003), is well suited for absorption line
studies. It is located behind the envelope at an angular offset of 35
![]() from the center, and is bright enough for high resolution
spectroscopy. This star has been observed with the UVES spectrograph
at the VLT by Kendall et al. (2002). Their main objective was to
search for diffuse bands that might originate in the circumstellar
gas. No diffuse bands were found, but these authors noted deep
absorption lines of Na I and K I, which they attributed to
circumstellar gas.
from the center, and is bright enough for high resolution
spectroscopy. This star has been observed with the UVES spectrograph
at the VLT by Kendall et al. (2002). Their main objective was to
search for diffuse bands that might originate in the circumstellar
gas. No diffuse bands were found, but these authors noted deep
absorption lines of Na I and K I, which they attributed to
circumstellar gas.
Here we report a comprehensive search for metal lines in the circumstellar envelope of IRC+10216 along this line of sight. Our objectives are to measure the degree of metal depletion in this carbon-rich environment, and to determine the distribution of solid and gas phase metals returned by the star to the interstellar medium. Section 2 describes the observational material. Section 3 presents the absorption lines, and Sect. 4 the derived column densities and abundances. The results are discussed in terms of dust formation in Sect. 5, and metal chemistry in Sect. 6. Our main conclusions are given in Sect. 7.
|
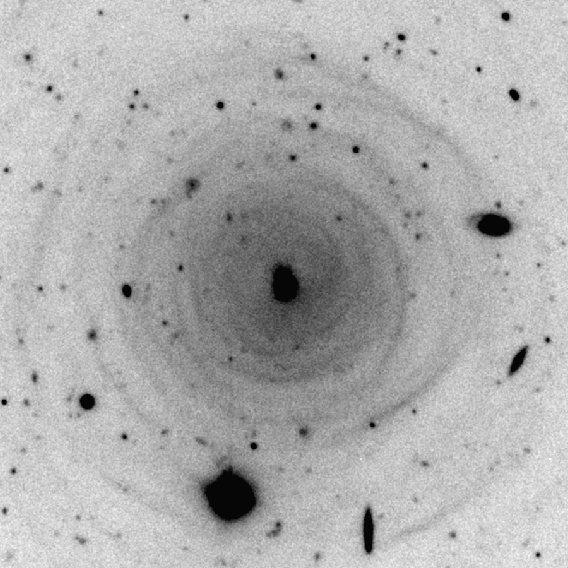
Figure 1:
V-band image of the circumstellar envelope of IRC+10216,
made with the VLT. The field size is
|
| Open with DEXTER | |
2 Observations
The observations of the envelope of IRC+10216 were made using
absorption line spectroscopy with Star 6 (IRC+10216) as the
background source of illumination. Star 6 lies 35
![]() from
IRC+10216 at position angle 165
from
IRC+10216 at position angle 165![]() .
Its visual magnitude is
V=16.0, and it is the nearest star to the center of the envelope
suitable for high resolution spectroscopy. The field is shown in
Fig. 1, where the envelope is seen in dust-scattered Galactic light.
From its magnitude and spectral type (type G), star 6 is at a
distance of
.
Its visual magnitude is
V=16.0, and it is the nearest star to the center of the envelope
suitable for high resolution spectroscopy. The field is shown in
Fig. 1, where the envelope is seen in dust-scattered Galactic light.
From its magnitude and spectral type (type G), star 6 is at a
distance of ![]() 1400 pc, well beyond IRC+10216, as discussed by
Kendall et al. (2002).
1400 pc, well beyond IRC+10216, as discussed by
Kendall et al. (2002).
The observations were made with the UVES spectrograph at the VLT, and
were previously used by Kendall et al. (2002) to search for diffuse
bands. The data were obtained over seven nights in December 2000 and
January 2001, with an effective exposure of 4 h at each wavelength.
The sky transparency was moderate to good, and the seeing was 0
![]() 8.
The data consist of 4 spectra, each covering the complete range
from 3000 to 10 000 Å with a resolving power of
50 000 (
8.
The data consist of 4 spectra, each covering the complete range
from 3000 to 10 000 Å with a resolving power of
50 000 (
![]() km s-1). These spectra have been reduced with the ESO UVES pipeline
and have been summed after correction to the heliocentric reference
frame. All radial velocities given in this paper are heliocentric,
except where specified otherwise. The signal-to-noise ratio of the
final spectrum at 4200 Å is
km s-1). These spectra have been reduced with the ESO UVES pipeline
and have been summed after correction to the heliocentric reference
frame. All radial velocities given in this paper are heliocentric,
except where specified otherwise. The signal-to-noise ratio of the
final spectrum at 4200 Å is ![]() 60 per resolution element.
60 per resolution element.
The heliocentric velocity of Star 6 measured from numerous
photospheric absorption lines is
![]() km s-1. For comparison,
the systemic heliocentric radial velocity of IRC+10216 is
-19.3 km s-1, which is derived from millimeter observations of the
envelope (
km s-1. For comparison,
the systemic heliocentric radial velocity of IRC+10216 is
-19.3 km s-1, which is derived from millimeter observations of the
envelope (
![]() km s-1, Loup et al. 1993). Thus a given
line in the envelope of IRC+10216 is well separated in velocity from
the same line formed in the photosphere of Star 6. In addition, the
expansion velocity of the envelope is 14.1 km s-1 with a small
turbulent component (Huggins & Healy 1986), so the absorption lines
in the envelope are expected to be wide (
km s-1, Loup et al. 1993). Thus a given
line in the envelope of IRC+10216 is well separated in velocity from
the same line formed in the photosphere of Star 6. In addition, the
expansion velocity of the envelope is 14.1 km s-1 with a small
turbulent component (Huggins & Healy 1986), so the absorption lines
in the envelope are expected to be wide (![]() 30 km s-1). In
contrast, the weak stellar lines are relatively narrow, with widths
comparable to the instrumental profile, and the strong stellar lines have
characteristic damping profiles with broad wings.
30 km s-1). In
contrast, the weak stellar lines are relatively narrow, with widths
comparable to the instrumental profile, and the strong stellar lines have
characteristic damping profiles with broad wings.
Table 1: Metal lines in the envelope of IRC+10216.
Table 1 lists the metal lines that we searched for in the envelope of
IRC+10216. Column 2 gives the laboratory wavelength in air
(
![]() )
for each transition, and Col. 3 gives the
oscillator strength (f) from Morton (1991, 2000).
The line list includes
the strongest ground-state transitions for the species that are
potentially observable in the wavelength range covered. These lines
are seen in interstellar clouds and/or in circumstellar environments
with similar physical conditions.
)
for each transition, and Col. 3 gives the
oscillator strength (f) from Morton (1991, 2000).
The line list includes
the strongest ground-state transitions for the species that are
potentially observable in the wavelength range covered. These lines
are seen in interstellar clouds and/or in circumstellar environments
with similar physical conditions.
At long wavelengths, the spectrum of the background source, Star 6, is
relatively free of photospheric lines, so an absorption line arising
in the intervening circumstellar envelope is straightforward to
identify. At shorter wavelengths, the spectrum is more crowded with
photospheric lines, and absorption by the circumstellar envelope is
often more difficult to identify. In these cases we use a template
technique to extract the envelope signal. We first make a least
squares fit to the spectrum of Star 6 using a template spectrum covering
a region of ![]() 15 Å around (but excluding) the expected
envelope line. We then use this as the effective continuum to
search for residual absorption from the envelope.
15 Å around (but excluding) the expected
envelope line. We then use this as the effective continuum to
search for residual absorption from the envelope.
One form of template that we tried was based on the library of synthetic
spectra from Coelho et al. (2005), but these did not produce a
good match to the photospheric spectrum. A second approach that was
successful, was using a scaled solar spectrum. By chance the spectrum
of Star 6 is very similar to that of the Sun, and a template based on
scaling the solar spectrum gives a close match to the stellar
spectrum. The solar spectrum that we use here was published by
Delbouille et al. (1973) and covers the wavelength region
3000-10 000 Å with a step size of about 0.0125 Å. In order to
fit the stellar spectrum
![]() ,
we shift the solar spectrum
,
we shift the solar spectrum
![]() to match the
radial velocity, re-bin it to match the resolution, and scale the flux
according to:
to match the
radial velocity, re-bin it to match the resolution, and scale the flux
according to:
where
The use of this template as the effective continuum reveals spectral features of the circumstellar envelope that are not otherwise easily observed. Examples of the application of this technique are given in Sects. 3.3 and 3.4.
|
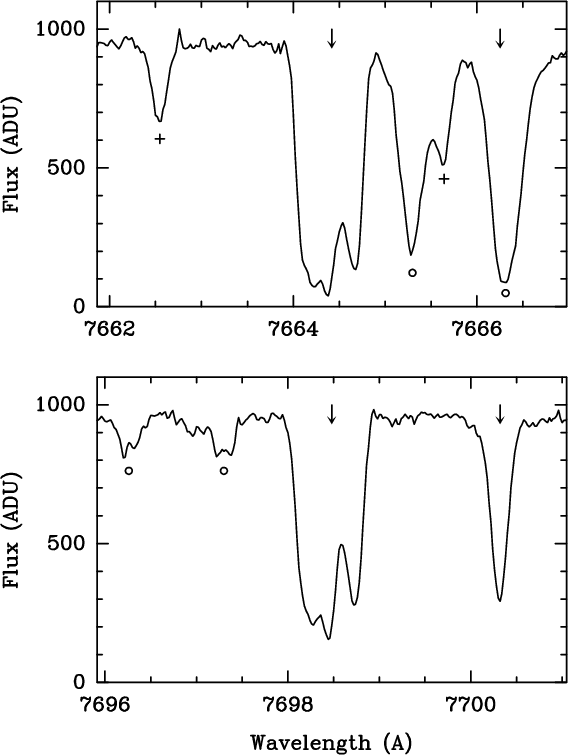
Figure 2:
Spectra of the K I doublet at 7664.91 Å
( upper panel) and 7698.97 Å ( lower panel). In each panel, the
arrow on the right marks the photospheric line (
|
| Open with DEXTER | |
Table 2: Parameters of the K I components in IRC+10216.
3 Envelope absorption lines
3.1 K I
Figure 2 shows the observed spectral regions covering the K I
doublet. The 7665 Å line is in the upper panel and the
7699 Å line is in the lower panel. Strong photospheric K I lines of Star 6
are present at the stellar radial velocity of
![]() km s-1, which is marked with an arrow at the right of each panel.
Also present are two weaker photospheric lines (marked +) and four
telluric lines (marked
km s-1, which is marked with an arrow at the right of each panel.
Also present are two weaker photospheric lines (marked +) and four
telluric lines (marked ![]() ).
).
The dominant feature in the middle of each spectral region is strong
K I absorption from the envelope of IRC+10216. This can be
unambiguously ascribed to the circumstellar envelope. It is centered
near the systemic radial velocity of IRC+10216 at -19.3 km s-1 (marked with an arrow in the figure) and has the broad width expected
from the expanding envelope. With the low interstellar absorption in
this region of the sky (
![]() ), any interstellar K I would contribute
), any interstellar K I would contribute ![]() a few percent of the strong lines observed,
based on the survey of interstellar K I by
Chaffee & White (1982).
a few percent of the strong lines observed,
based on the survey of interstellar K I by
Chaffee & White (1982).
We also searched for the much weaker ground state K I line at
4044 Å which has an f-value ![]() 110 times less than the
7664 Å line. The 4044 Å line was not detected, and the upper
limit is given in Table 1.
110 times less than the
7664 Å line. The 4044 Å line was not detected, and the upper
limit is given in Table 1.
Although the K I doublet lines formed in the envelope are broad, they
are clearly composed of several components. The presence of the
components is important because it affects the saturation of the lines
(see Sect. 4). Assuming gaussian broadening, we found that a best fit
synthesis taking into account the instrumental profile requires four
components to match the line shapes. A preliminary fit with
unconstrained parameters gave consistent estimates for the radial
velocities of the individual components in each line. We then fixed
the velocities at their mean values, and fit the profiles by varying
the relative column densities of the components and their line
broadening b-values, which we constrained to be the same for both
lines. The final mean parameters are given in Table 2, where the
strength is the column density of each component, relative to the
strongest component. The uncertainty in the velocities is ![]() 0.5 km s-1 and the relative strengths found from the two lines are the
same to within
0.5 km s-1 and the relative strengths found from the two lines are the
same to within ![]() 5%. Thus the results from the two lines are in
good agreement, as expected from their similar line profiles.
5%. Thus the results from the two lines are in
good agreement, as expected from their similar line profiles.
To illustrate the quality of the multi-component fit, Fig. 3 shows the results of a synthesis of the 7699 Å line using the parameters of Table 2. It can be seen that the model provides an excellent fit to the observational data.
We interpret the multiple component profiles of the K I lines as the effects of the multiple shell structure in the envelope (Mauron & Huggins 1999, 2000; see also Fig. 1), where the line of sight passes through regions of enhanced density. Although the gaussian line shapes give a good fit to the spectra, we do not know the detailed velocity distribution of the shells along the line of sight, so we cannot reliably determine the gas density contrast between the shell and inter-shell regions. However, the stronger components are clearly separate, and suggest that the contrast is at least a factor of a few. This is consistent with a large shell inter-shell contrast in the dust density derived from images in dust-scattered light by Mauron & Huggins (2000).

|
Figure 3: Comparison of the observed (black) and synthesized (grey) profiles of the K I 7698.97 Å line, using the parameters given in Table 2. The individual components are also shown. |
| Open with DEXTER | |
|
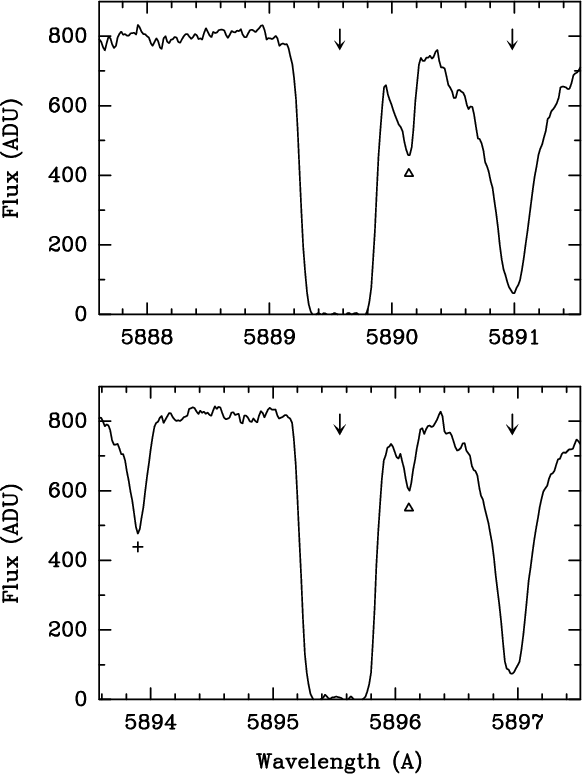
Figure 4:
Spectra of the Na I doublet at 5889.95 Å (upper
panel) and 5895.92 Å ( lower panel). Arrows mark the
photospheric and envelope components, as in Fig. 2. The triangles mark
an interstellar Na I component (at
|
| Open with DEXTER | |
3.2 Na I
Figure 4 shows the spectral regions covering the Na I D lines. The 5890 Å line is in the upper panel and the 5896 Å line is in the lower panel. The photospheric Na I lines of Star 6 (marked with arrows at the right in each panel) are strong, and there is another weaker photospheric line in the lower panel. The dominant feature in the middle of each spectrum is Na I absorption from the envelope of IRC+10216, centered near the systemic velocity. It can be seen that the circumstellar lines are extremely strong. All the components are highly saturated and the residual intensities are close to zero across both lines.
There is an additional, weak Na I component that appears in both
spectra near +9.5 km s-1 (marked with triangles) which we identify as an
interstellar component along this line of sight. Similar weak Na I absorption near this velocity is reported by Kendall et al. (2002)
along lines of sight to two other stars in this region of the sky, at
angular distances of 153
![]() and 2.5
and 2.5![]() from IRC+10216.
from IRC+10216.
We also searched for the much weaker ground state Na I line at
3302 Å, which has an f-value ![]() 70 times less than the
5890 Å D line. The 3302 Å line lies in a crowded, low
signal-to-noise part of the spectrum, but the template approach
(Sect. 2) reveals a
70 times less than the
5890 Å D line. The 3302 Å line lies in a crowded, low
signal-to-noise part of the spectrum, but the template approach
(Sect. 2) reveals a ![]() 5 sigma detection, and the equivalent width
is given in Table 1. The signal-to-noise ratio is too low to show any
details of the profile.
5 sigma detection, and the equivalent width
is given in Table 1. The signal-to-noise ratio is too low to show any
details of the profile.

|
Figure 5: Spectrum of the Ca I line at 4226.73 Å. Upper panel: the observed spectrum (full line) and fitted template (dotted line). Arrows indicate the photospheric and envelope components as in Fig. 2. Lower panel: spectrum normalized to the template. The dotted line replaces the spectrum over the photosperic core region. |
| Open with DEXTER | |
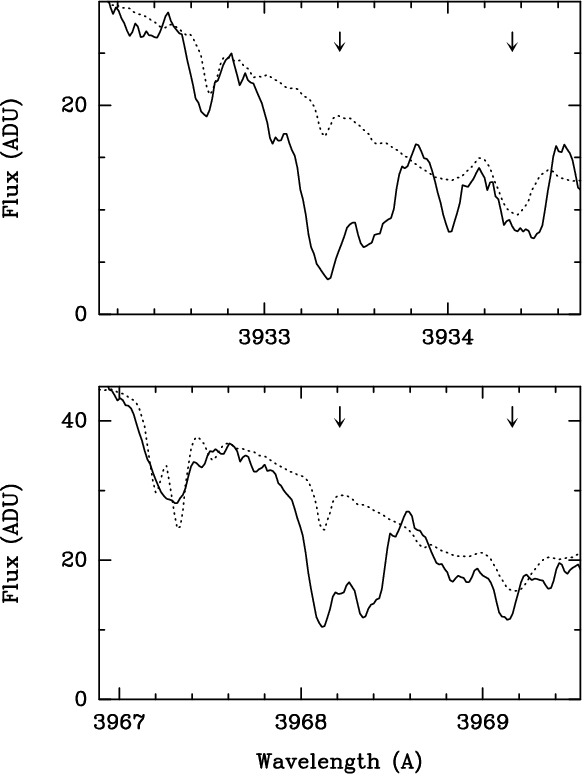
|
Figure 6: Spectra of the Ca II H and K doublet at 3933.66 Å ( upper panel) and 3968.46 Å ( lower panel). Arrows mark the photospheric and envelope components, as in Fig. 2. The solid lines show the observed spectra, the dotted lines show the template spectra. |
| Open with DEXTER | |
3.3 Ca I and Ca II
Figure 5 shows the spectral region around the Ca I line at 4226 Å. The line falls in a very crowded region of the spectrum and provides a good illustration of the template method.
The solid line in the upper panel shows the observed spectrum, and the envelope absorption is not immediately apparent. The dotted line in the upper panel shows the stellar template, scaled to match the observed spectrum. It can be seen that it gives a good overall fit to the data, and reveals the excess absorption from the envelope. The lower panel of Fig. 5 shows the envelope line, using the fitted template as the effective continuum. The small wavelength range around the core of the photospheric Ca I line has been masked (with the horizontal dotted line) because the effective continuum is poorly defined at the low intensity of the line core. The main deviation from a flat continuum in the normalized spectrum is caused by slight differences between the Ca I line profiles of Star 6 and the Sun, which probably arise from slightly different surface gravities.
It can be seen that the template fitting technique recovers the Ca I absorption in the envelope very effectively. The line shows a profile with narrow components similar to those seen in the K I lines.
We also detected Ca II absorption in the H and K lines shown in Fig. 6. The 3933 Å line is in the upper panel, and the 3968 Å line is in the lower panel. For these spectral regions the crowding by photospheric lines is not severe, and the envelope absorption can be seen in the direct spectra. The adjacent Ca II photospheric lines are very strong, and their blue wings form the local (tilted) continuum for the circumstellar absorption. In the photospheric line core, the template is not a good fit on account of differences in the core reversals between Star 6 and the Sun.
The Ca II line profiles show approximately the same profiles as the
K I lines but are somewhat broader, by ![]() 5-10 km s-1 (FWHM),
suggesting additional absorption. This could be an interstellar
contribution, or additional circumstellar absorption. Compared to the
neutral lines, the ionized Ca II lines sample the line of sight
through the envelope to larger distances from the central star, and
the kinematics of these outer regions have never previously been
observed.
5-10 km s-1 (FWHM),
suggesting additional absorption. This could be an interstellar
contribution, or additional circumstellar absorption. Compared to the
neutral lines, the ionized Ca II lines sample the line of sight
through the envelope to larger distances from the central star, and
the kinematics of these outer regions have never previously been
observed.
|
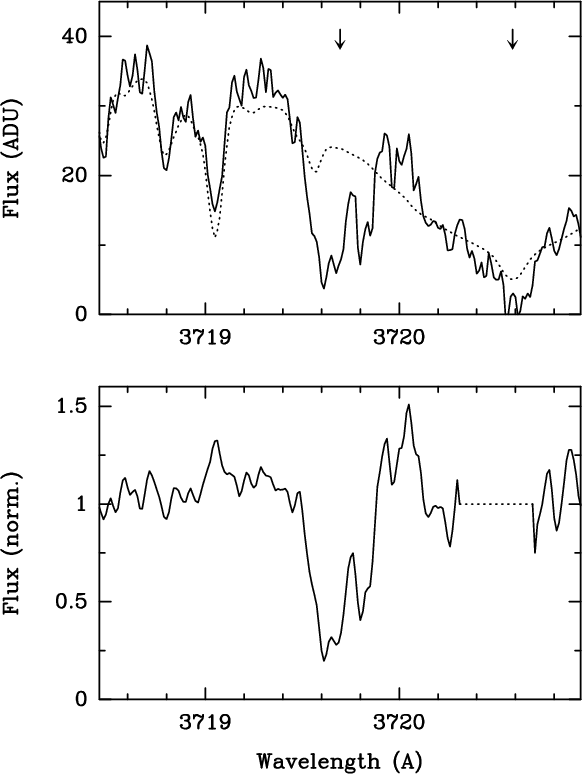
Figure 7: Spectrum of the Fe I line at 3719.93 Å. Details as in Fig. 5. |
| Open with DEXTER | |
|
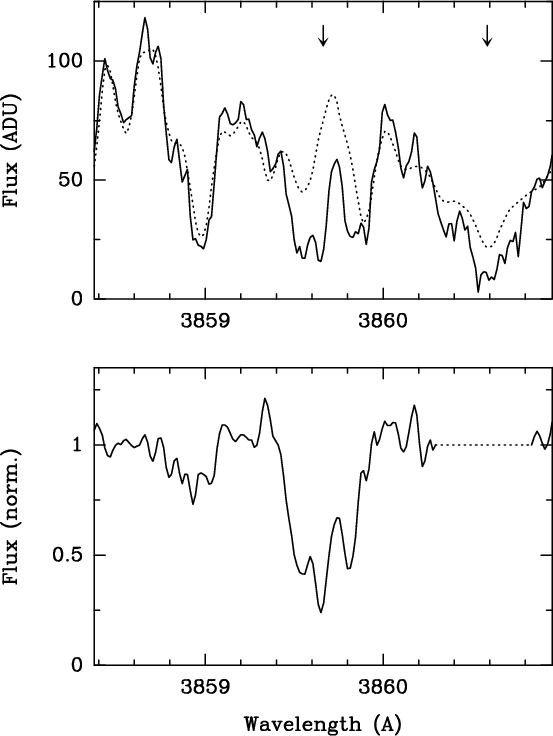
Figure 8: Spectrum of the Fe I line at 3859.91 Å. Details as in Fig. 5. |
| Open with DEXTER | |
3.4 Fe I
Figures 7 and 8 show the spectral regions around the Fe I lines at 3720 Å and 3860 Å, respectively. These fall in relatively crowded regions of the photospheric spectrum, and the template is needed to determine the envelope absorption. The upper panel in each figure shows the observed spectrum (solid line) and the fitted stellar template (dotted line). The lower panel shows the normalized spectrum with the envelope absorption centered near the systemic velocity of IRC+10216. The signal-to-noise ratio of these spectra is lower than those discussed above, and the template fit is affected by differences in the solar and stellar spectra. The limited quality of the fit is probably responsible for the fact that the equivalent width of the 3720 Å line is slightly less than that of the 3860 Å line, even though the f-value is larger (see Table 1). Nevertheless the lines are well detected, and the multi-component character of the envelope absorption is similar to that seen in the lines of the other species.
We also searched for two additional Fe I lines at 3824 Å and
3441 Å. The 3824 Å line is weaker on account of a significantly
lower f-value, and is marginally detected at ![]() 4 sigma. The
3441 Å line lies at shorter wavelengths where the spectrum is
poorer. It is detected with a strength comparable to the Fe I lines
shown in Figs. 7 and 8, but with a lower signal-to-noise ratio.
4 sigma. The
3441 Å line lies at shorter wavelengths where the spectrum is
poorer. It is detected with a strength comparable to the Fe I lines
shown in Figs. 7 and 8, but with a lower signal-to-noise ratio.
3.5 Other lines
Searches were also made for lines of several other species, including
Al I, Mn I, Cr I, Ti I and Ti II, and Sr II, as listed in
Table 1. With the exception of Cr I, no significant envelope
absorption was detected. For Cr I, weak (![]() 2-3
2-3![]() )
features
are seen at the wavelengths of most of the accessible lines. When
appropriately weighted by the oscillator strengths and noise levels
they provide an overall 4-sigma detection of this species.
)
features
are seen at the wavelengths of most of the accessible lines. When
appropriately weighted by the oscillator strengths and noise levels
they provide an overall 4-sigma detection of this species.
4 Abundances in the envelope
4.1 Column densities
The equivalent widths (![]() )
of the absorption lines observed
in the envelope are listed in Col. 4 of Table 1. For the
non-detected lines, we list 3-sigma limits given by:
)
of the absorption lines observed
in the envelope are listed in Col. 4 of Table 1. For the
non-detected lines, we list 3-sigma limits given by:
where
The column density (N) derived for each species is given in
Col. 5 of Table 1. It is based on the equivalent widths and the
f-values given in the table. For the weak lines, the column density
is directly related to the equivalent width by the optically thin
formula:
where
For the stronger lines, where the optical depths are larger, we
determine the relation between
![]() and N using the
multi-component model used to fit the high signal-to-noise profiles of
the K I lines (Table 2). With this model we find that the K I lines
are moderately saturated; the column densities derived from the 7699
and 7665 Å lines are larger than the optically thin values by
factors of 1.7 and 2.3, respectively. The column densities from the
two lines agree to within 20%, and are consistent with a limit of
and N using the
multi-component model used to fit the high signal-to-noise profiles of
the K I lines (Table 2). With this model we find that the K I lines
are moderately saturated; the column densities derived from the 7699
and 7665 Å lines are larger than the optically thin values by
factors of 1.7 and 2.3, respectively. The column densities from the
two lines agree to within 20%, and are consistent with a limit of
![]() cm-2 determined from the upper
limit to the optically thin 4044 Å K I line. For Na I, the D-lines
are extremely optically thick, and therefore insensitive to the column
density, although the very low residual intensity across the lines
yields a lower limit of
cm-2 determined from the upper
limit to the optically thin 4044 Å K I line. For Na I, the D-lines
are extremely optically thick, and therefore insensitive to the column
density, although the very low residual intensity across the lines
yields a lower limit of
![]() 1-
1-
![]() cm-2. Fortunately, we also detect the
optically thinner Na I line at 3302 Å line, and we use this with
the multi-component saturation curve to determine the column density
of Na I given in Table 1. The result is consistent with the lower
limit from the D-lines.
cm-2. Fortunately, we also detect the
optically thinner Na I line at 3302 Å line, and we use this with
the multi-component saturation curve to determine the column density
of Na I given in Table 1. The result is consistent with the lower
limit from the D-lines.
The profiles of the ionized lines might be expected to differ from those of the neutral lines because the absorption can occur at different locations along the line of sight. This does not affect the column density estimates for Sr II and Ti II because the lines are very weak (below the detection level) and are therefore optically thin. For the stronger Ca II lines, the profiles are found to be similar to the K I profiles, but as noted in Sect. 3.3, they are slightly broader with an additional contribution to the absorption. We therefore model the Ca II lines as the sum of two contributions; the fit of the K I multi-component model to the main part of the profile, and an additional, optically thin component to give the total equivalent width. The additional component contributes 32% and 17% of the equivalent widths (22% and 13% of the derived column densities) for the 3933 and 3968 Å lines, respectively. We assume that the additional absorption is circumstellar, but since it is relatively small, the results do not depend sensitively on this assumption.
4.2 Column density of hydrogen
Although there are no direct observations of hydrogen along the line
of sight, we can use estimates of the mass loss rate of the envelope
to determine the hydrogen column density. Since the early work by Kwan
& Hill (1977) there have been numerous estimates of the mass loss
rate based on millimeter CO observations, and the results are fairly
consistent when the different distances, CO abundances, dust-gas
heating rates, and He content are taken into account. For a distance
of 120 pc, we adopt a mass loss rate
![]() (in
hydrogen) of
(in
hydrogen) of
![]()
![]() yr-1 (corresponding to a total mass loss rate of
yr-1 (corresponding to a total mass loss rate of
![]()
![]() yr-1), based on the analysis of Schöier
& Olofsson (2001) approximately corrected for the effects of He.
This value is consistent with other recent estimates.
yr-1), based on the analysis of Schöier
& Olofsson (2001) approximately corrected for the effects of He.
This value is consistent with other recent estimates.
For
![]()
![]() yr-1,
the column density of hydrogen N(H), where N(H) = N(H I) + 2N(H2), is
yr-1,
the column density of hydrogen N(H), where N(H) = N(H I) + 2N(H2), is
![]() cm-2 along the line of sight 35
cm-2 along the line of sight 35
![]() from the center. The uncertainty is a factor
from the center. The uncertainty is a factor ![]() 2,
which results from uncertainties in
2,
which results from uncertainties in ![]() .
In addition to a smooth
decrease of the column density with distance from the center, there
are other variations caused by the multiple shell structure in the
envelope. From an analysis of scattered light images (e.g., Fig. 1) we
find typical variations in the dust column density of
.
In addition to a smooth
decrease of the column density with distance from the center, there
are other variations caused by the multiple shell structure in the
envelope. From an analysis of scattered light images (e.g., Fig. 1) we
find typical variations in the dust column density of ![]() 20%, and
somewhat smaller variations near the region of Star 6. These
variations are much smaller than the density contrast of the shells
because the column density averages the density along the line of sight
through several shell and inter shell regions. The envelope structure
is therefore not a major source of uncertainty for N(H).
20%, and
somewhat smaller variations near the region of Star 6. These
variations are much smaller than the density contrast of the shells
because the column density averages the density along the line of sight
through several shell and inter shell regions. The envelope structure
is therefore not a major source of uncertainty for N(H).
Table 3: Abundances in the envelope of IRC+10216.
4.3 Ionization fraction
The line of sight passes through regions of the circumstellar envelope where the metals are partially ionized. Since most of the observed lines arise from single stages of ionization, we need to consider ionization corrections in order to determine the total gas phase abundances. We estimate the corrections from the relative column densities of the ionization stages of each metal, obtained using the photo-ionization model of an expanding envelope discussed by Glassgold & Huggins (1986).
In the model, neutral atoms (which may result from the dissociation of molecules) emerge from the dense, shielded, inner envelope and are photo-ionized by the ambient interstellar radiation field. We calculate the ionization fraction as a function of radius, and use this to calculate the ionization fraction along the line of sight. The ionization of each element is governed by Eq. (4.9) of Glassgold & Huggins (1986), with no contribution from chromospheric radiation. The ionization depends on the photo-ionization rate (given by the interstellar rate and the envelope shielding) and recombination. In solving the ionization equations we use the interstellar photo-ionization rates and recombination rates from Péquignot & Aldrovandi (1986), except for Cr and Sr which are not included in their compilation; for these the photo-ionization rates are from Glassgold & Huggins (1986) and the recombination rates from Bernat (1976). The radial dependence of the electron abundance is adopted from Cordiner et al. (2007), although recombination is relatively unimportant except for Al. For the shielding of interstellar radiation in the envelope we use the standard carbon dust model and dust-to-gas ratio of Cherchneff et al. (1993) and the shielding function of Morris & Jura (1983).
There are a number of uncertainties in the parameters of the model,
the most important being the strength of the ambient radiation field
(which determines the interstellarphoto-ionization rates) and the
shielding in the envelope (which includes uncertainties in the dust
parameters, the mass loss rate, and the envelope
geometry). Fortunately we observe both the neutral and ionized column
densities of Ca, and we use this to set the ionization level in the
model. For the nominal parameters given above, the predicted ratio
![]() is a factor 3.6 larger than observed. This is fair
agreement considering that the ionization in the envelope has not
previously been constrained in this way. However, we can do much
better, by fine tuning the ionization level in the envelope to fit the
Ca ionization exactly. This can be done by adjusting the ambient
radiation field (by a factor of 0.46) or the shielding optical depth
(by a factor 1.5). Both variations are within their respective
uncertainties. For specificity, we adopt the reduced radiation field
to calculate the ionization of the other elements. The resulting
ionization corrections (
is a factor 3.6 larger than observed. This is fair
agreement considering that the ionization in the envelope has not
previously been constrained in this way. However, we can do much
better, by fine tuning the ionization level in the envelope to fit the
Ca ionization exactly. This can be done by adjusting the ambient
radiation field (by a factor of 0.46) or the shielding optical depth
(by a factor 1.5). Both variations are within their respective
uncertainties. For specificity, we adopt the reduced radiation field
to calculate the ionization of the other elements. The resulting
ionization corrections (
![]() ( I + II)/N( I) for neutral species, and N( I + II)/N( II) for singly ionized species), are given in Col. 4
of Table 3. Adjusting the shielding instead, by the amount given
above, produces essentially the same ionization corrections.
( I + II)/N( I) for neutral species, and N( I + II)/N( II) for singly ionized species), are given in Col. 4
of Table 3. Adjusting the shielding instead, by the amount given
above, produces essentially the same ionization corrections.
The ionization correction for Al I in Table 3 is much larger than for
the other metals because of its relatively high photo-ionization
rate. Our observations are therefore not very sensitive probes of the
column density of Al in the gas phase because the Al is nearly
completely ionized along the line of sight. The ionization
corrections for the other neutral species are much smaller. For
example, Na is predominantly neutral. This is in contrast to typical
interstellar clouds with a similar column density of hydrogen. In the
circumstellar envelope, the characteristic outflow time at 35
![]() is shorter than the photo-ionization time given by Glassgold &
Huggins (1986). Hence, even without dust shielding,
the Na atoms are expected to be largely neutral, as given in the table.
is shorter than the photo-ionization time given by Glassgold &
Huggins (1986). Hence, even without dust shielding,
the Na atoms are expected to be largely neutral, as given in the table.
4.4 Abundances
Except for Ca and Ti, the total gas phase column densities of the
metals are determined from the observed column densities and the
ionization corrections. The results are given in Col. 5 of Table 3.
Although the
![]() ratio was used to determine the
ionization level in the envelope, we use the sum of the ionization
stages to obtain the total Ca column density,independent of the
ionization. Similarly, the limit for Ti is based on the observed
limits for Ti I and Ti II, and so is independent of the ionization.
ratio was used to determine the
ionization level in the envelope, we use the sum of the ionization
stages to obtain the total Ca column density,independent of the
ionization. Similarly, the limit for Ti is based on the observed
limits for Ti I and Ti II, and so is independent of the ionization.
The gas phase abundances of the metals relative to hydrogen (X) are
determined from the total column densities and the value of
![]() from Sect. 4.2, and are given in Col. 6 of Table 3.
For reference, the solar values (
from Sect. 4.2, and are given in Col. 6 of Table 3.
For reference, the solar values (![]() )
are given in Col. 7 of
the table, taken from Lodders (2003). Comparison of the
envelope and solar abundances shows that there are large deficiencies
in the gas phase abundances in the envelope, which vary from metal to
metal.
)
are given in Col. 7 of
the table, taken from Lodders (2003). Comparison of the
envelope and solar abundances shows that there are large deficiencies
in the gas phase abundances in the envelope, which vary from metal to
metal.
5 Dust condensation
Several processes affect the state of the circumstellar material as it moves from the stellar photosphere out through the envelope into the interstellar medium. In order of increasing distance from the star these processes include: dust condensation in conditions of approximate thermodynamic equilibrium; gas phase chemical reactions; photo-dissociation of the molecules; and eventual photo-ionization of the atomic constituents in the outer envelope (e.g., Gilman 1969; Tsuji 1973; McCabe et al. 1979; Huggins & Glassgold 1982; Lafont et al. 1982). In the carbon-rich environment of IRC+10216, the main component of the dust is amorphous carbon with a minor component of SiC (e.g., Martin & Rogers 1987). The state of other elements, especially the refractory metals, is not well understood (e.g., Turner 1995). Hence our observations of the gas phase metals in the outer envelope provide new constraints on the gas phase chemistry and the dust condensation.
Table 4: Metal bearing molecules in IRC+10216.
5.1 Observed depletions
Comparison of the envelope abundances with the solar abundances in
Table 3 shows that most of the gas phase metal atoms in the
envelope are ``missing''. It is most unlikely that they are in the
form of gas phase molecules. The fractional abundance of even the most
extreme case of Ca, where
![]() ,
is an order of magnitude larger than the largest
fractional abundance of any metal bearing molecule detected outside of
the core region (see Table 4). In addition, most molecules are
dissociated closer to the star than the 35
,
is an order of magnitude larger than the largest
fractional abundance of any metal bearing molecule detected outside of
the core region (see Table 4). In addition, most molecules are
dissociated closer to the star than the 35
![]() offset of our line
of sight. It is therefore reasonable to infer that the atomic
abundances observed are good approximations to the total gas phase
metal abundances in the envelope, and that the missing atoms are
depleted onto dust grains.
offset of our line
of sight. It is therefore reasonable to infer that the atomic
abundances observed are good approximations to the total gas phase
metal abundances in the envelope, and that the missing atoms are
depleted onto dust grains.
In Col. (8) of Table 3 we give the conventional measure of depletion
![]() ,
where
,
where
![]() is the depletion
factor. The observational limits for the abundances of Al and Sr are
is the depletion
factor. The observational limits for the abundances of Al and Sr are ![]() the solar values, so in these cases we have no significant
limits for
the solar values, so in these cases we have no significant
limits for ![]() ,
although Sr is an s-process element and may be
enhanced in IRC+10216 and depleted.
,
although Sr is an s-process element and may be
enhanced in IRC+10216 and depleted.
Based on the measured depletions, there are two immediate conclusions. First, the metals in this carbon-rich archetype are primarily in the form of solids, and this is the dominant form returned to the interstellar medium. Second, in spite of the depletion, a significant residue of metallic atoms remains in the gas phase and varies from metal to metal.
5.2 Condensation and adsorption
There are no detailed predictions for the depletion of metals in IRC+10216, but there are some important considerations that bear on the issue. A commonly used approach to the condensation of solids in circumstellar envelopes is the assumption of thermodynamic equilibrium in the warm, dense, inner envelope, where the chemical time scales are rapid compared with the expansion time scale. Under these conditions the formation of solid particles is controlled by the condensation temperature of the primary condensate of each species.For a carbon-rich envelope, the condensation sequence depends somewhat on the C/O ratio and the gas pressure. The following sequence, for C/O = 1.1 and a pressure of 10-6 bar (from Lodders & Fegley 1995, updated for Fe by Lodders & Fegley 1999) is representative: C (1670 K), TiC (1640 K), SiC (1460 K), FeSi (1230 K), AlN (1170 K), CaS (1150 K), MgS (960 K), with other more volatile metals such as Na and K at lower temperatures. Cr and Mn probably form sulphides but their location in the sequence is uncertain. Thus the metals Ti, Fe, Al, Ca, and then K and Na, are expected to be removed from the gas phase successively. Those with lower condensation temperatures are less likely to go to completion because of the decreasing density with radius.
This qualitative picture is largely consistent with the observed depletion pattern. The observations provide a firm upper limit on the gas phase abundance of Ti (from the Ti I and Ti II lines); Fe and Ca are strongly depleted, although Ca is more depleted than Fe (in reverse order to the condensation sequence); and Na and K are less depleted.
The simplifying assumption of thermodynamic equilibrium is not a complete physical theory of condensation because kinetic effects must play a role near freeze-out. In addition, once formed, the grains can act as sites for the adsorption of gas phase species further out in the envelope (Jura & Morris 1985). The adsorption depends on the binding energy of the species to the grain surface, and on the sticking probability (p), which is essentially unknown. Using the analysis of Jura & Morris (1985), Turner (1995) finds that for IRC+10216, a volatile species such as K is depleted by adsorption to a fractional abundance of 0.84 (for p=0.1) and 0.17 (for p=1), and a more refractory species such as Al is depleted to a fractional abundance of 0.05 (for p=0.1) and 10-10 (for p=1). Thus adsorption of metals may be as important as the initial condensation.
Our observations of a residual atomic component in the gas phase constrain the efficiency of both condensation and adsorption. Below about 1150 K, the phase diagrams of Lodders & Fegley (1995) show that Ca is essentially completely removed from the gas phase, but our observations show that even for this refractory metal there is a residual component in the gas phase. Metal bearing molecules with Na and K (albeit with low fractional abundances) are seen in the core region (see Sect. 6) but not in the extended envelope. This may be the result of adsorption. On the other hand, adsorption of the more refractory species to levels of 10-10 are clearly ruled out by the observations.
We conclude that current theoretical ideas are qualitatively in accord with our observations of metal depletion, but improved models with specific quantitative predictions are needed to discriminate the underlying processes.
5.3 Comparison with PNe
Carbon-rich planetary nebulae (PNe) are the immediate descendants of carbon-rich AGB stars, in which the circumstellar material has undergone major changes. The gas has been photo-ionized, and the dust grains are exposed to intense radiation fields and high (Element abundances have been extensively measured in the ionized gas in PNe. The abundances are, however, subject to systematic, and sometimes, large uncertainties, and relatively few metals have accessible lines covering the appropriate stages of ionization. For comparison with IRC+10216 we focus on IRC+10216, which is one of the most intensively studied, carbon-rich PNe. IRC+10216 is relatively young and still surrounded by a substantial envelope of molecular gas (Cox et al. 2002). The circumstellar conditions before the formation of the nebula were therefore somewhat similar to the current state of IRC+10216.
There have been numerous abundance analyses of IRC+10216. We have taken
the abundances of Na, K, Ca, and Fe from recent, comprehensive studies
by Keyes et al. (1990), Middlemass et al. (1990), Bernard Salas
et al. (2001), and Zhang et al. (2005), and we give the corresponding
depletions in Col. (9) of Table 3. For species in common the
depletions have been averaged. Even with these state-of-the-art
analyses, the differences in abundances between the different studies
range up to a factor of ![]() 3.
3.
Comparison of the depletions in IRC+10216 and IRC+10216 reveals some significant differences. First, the metals Na and K are much less depleted in the ionized nebula, where they are close to the solar values. Second, Fe and Ca are still significantly depleted in the nebula but, evidently less than in the circumstellar envelope. These results suggest the following evolutionary effects in the transition from AGB star to PN: the nearly complete evaporation of the volatile species Na and K, and the partial erosion of more refractory species Ca, and possibly Fe. Further evidence for this view comes from the study of IRC+10216 by Kingdon et al. (1995), who argue that Ca is depleted by more than 2 orders of magnitude near the periphery of the nebula (as in IRC+10216), but is much less depleted near the center of the ionized nebula.
The abundances in IRC+10216 are fairly similar to other carbon-rich PNe, e.g., the Fe depletion is similar to the typical Fe depletion found in a sample of low ionization PNe by Delgado Inglada et al. (2009). The trends noted here may therefore be a general characteristic of the evolution of dust from the AGB to PNe.
5.4 Comparison with the ISM
It is also of interest to compare our results for IRC+10216 with depletions in the ISM. We take the line of sight towards IRC+10216 as representative of the ISM, bearing in mind that the overall level of IS depletions varies with location but the general pattern remains the same. The depletions towards IRC+10216, from Savage & Sembach (1996), are listed in Col. (10) of Table 3.In spite of the different physical and chemical environments that lead to grain formation in IRC+10216 and the ISM, it can be seen that the depletion patterns are qualitatively similar. Na and K are the least depleted, at comparable levels; Mn, Fe, and Cr are probably similar although the detailed pattern may differ; and Ca is the most depleted in both data sets.
In studies of the ISM it is found that element depletions correlate with the (oxygen-rich) condensation temperature of the element-bearing solid. This was interpreted in terms of grain formation at high temperatures in the winds of mass-losing giants (Field 1974). More recent studies indicate that a significant component of the dust in the ISM is formed in situ. The correlation with the condensation temperature may therefore reflect some aspect which is shared by the formation process in the ISM. The similarity of the pattern that we find in IRC+10216 may have some bearing on this question, and deserves further attention.
6 Metal chemistry
The circumstellar envelope of IRC+10216 exhibits a remarkable gas phase chemistry, with more than 50 molecular species detected to date, mainly through their rotational transitions at millimeter wavelengths. The majority of the molecules are formed of the abundant elements H, C, N, and O, several include Si and S, but a small number unexpectedly include metals, Na, K, Mg, and Al. The first of these were discovered by Cernicharo & Guélin (1987). Our observations of gas phase metal atoms in IRC+10216 constrain some aspects of the metal chemistry in the envelope.
The metal bearing molecules detected in the envelope are listed in Table 4. In addition to these, numerous other metal bearing species have been searched for at comparable levels, but not detected (e.g., Turner 1995). There are also other metal species whose rotational frequencies have not yet been measured in the laboratory (e.g., Ziurys 2006b).
For comparison with the atomic abundances reported here, we list
updated abundances for the metal molecules in Col. (3) of
Table 4. These are based on the column densities given in the
references in the table, but are derived for the distance and mass
loss rate used in this paper, and are relative to hydrogen. The
fractional abundance
![]() ,
is the fraction of
each metal in a particular molecular species.
,
is the fraction of
each metal in a particular molecular species.
![]() is
the measured, or inferred, angular radius of the molecular
distribution, adopted from the references.
is
the measured, or inferred, angular radius of the molecular
distribution, adopted from the references.
The metal bearing molecules divide naturally into two groups. The
first is confined to the dense core region represented by
![]() in the table. The second, which
includes only Mg and Al bearing molecules, is found in distinct shells
in the envelope, in the photo-dissociation region. The general level
of incorporation of the metals into molecules is very small in both
groups.
in the table. The second, which
includes only Mg and Al bearing molecules, is found in distinct shells
in the envelope, in the photo-dissociation region. The general level
of incorporation of the metals into molecules is very small in both
groups.
In the outer envelope, the fractional abundances of the metal bearing
molecules are ![]() 0.02 per cent, while the atoms that we detect have
fractional abundances of 0.3-20 per cent. This we used in Sect. 5.1
to justify the assumption that the observed atoms are the dominant gas
phase metal carriers along the line of sight.
0.02 per cent, while the atoms that we detect have
fractional abundances of 0.3-20 per cent. This we used in Sect. 5.1
to justify the assumption that the observed atoms are the dominant gas
phase metal carriers along the line of sight.
Even in the core region the molecules do not seem to be dominant. The
observed fraction of Na in the core in the form of molecules is ![]() 0.4 per cent, and we detect 20 percent in the form of atoms farther
out. Similarly, the fraction of K in the core in the form of molecules
is
0.4 per cent, and we detect 20 percent in the form of atoms farther
out. Similarly, the fraction of K in the core in the form of molecules
is ![]() 0.3 per cent, and we detect 4 per cent in atoms farther
out. For these species the numbers are consistent with the idea that
apart from condensation or adsorption onto dust grains, the dominant
gas phase species is atomic throughout the envelope. There is lack of
specific molecular information for the other metals, but the absence
of detected molecular species argues that this applies to them as
well.
0.3 per cent, and we detect 4 per cent in atoms farther
out. For these species the numbers are consistent with the idea that
apart from condensation or adsorption onto dust grains, the dominant
gas phase species is atomic throughout the envelope. There is lack of
specific molecular information for the other metals, but the absence
of detected molecular species argues that this applies to them as
well.
Our finding that residual metals are present in the envelope in the form of neutral atoms and ions provides an observational foundation for understanding certain aspects of the metal chemistry. For example, it has been proposed that metal cyanides are formed by reactions of metal ions with cyanopolyyenes (Dunbar & Petrie 2002), and the model of Cordiner & Millar (2009) shows that this can account for the observed abundance of MgCN if enough Mg+ is present in the gas phase. We have not observed Mg, but we expect that it behaves like the other metals. Its condensation temperature is significantly less than that of Ca and Fe, so it is likely to be less depleted in the envelope. The gas phase abundances of the metals that we observe are given in Col. (6) of Table 3. These may undergo reactions with cyanopolyyenes and other abundant neutral molecules, such as unsaturated hydrocarbons, and lead to a variety of metal bearing species. The largest abundances that we observe in the gas are those of Na and Fe (whose large depletion is balanced by its high cosmic abundance). Thus Fe offers interesting possibilities for a potentially observable Fe chemistry.
7 Conclusions
The observations of IRC+10216 reported in this paper represent the first comprehensive study of atomic metals in a carbon-rich circumstellar envelope. We detect lines of Na, K, Ca, Cr, and Fe, and obtain upper limits for Al, Ti, Mn, and Sr. Combined with a simple model of the ionization, the observations provide estimates of the gas phase metal abundances in the outer envelope.
The results show that the metals, especially Ca and Fe, are significantly depleted onto dust grains in the circumstellar envelope, and this is the dominant form returned to the ISM. The depletion pattern has some similarity with depletion in the ISM, and is roughly consistent with expectations of dust condensation in a carbon-rich envelope.
Although the metals are depleted in the envelope, atomic metals in the form of neutral atoms and ions appear to be the major metal species in the gas phase. As such, they likely play a key role in the metal chemistry of the envelope.
We thank Dr. K. Lodders for helpful information on dust condensation. We also thank an anonymous referee for helpful comments. This work is supported in part by the National Science Foundation, grant AST 08-06910 (PJH).
References
- Bakker, E. J., van Dishoeck, E. F., Waters, L. B. F. M., & Schoenmaker, T. 1997, A&A, 323, 469 [NASA ADS] [Google Scholar]
- Bernard Salas, J., Pottasch, S. R., Beintema, D. A., & Wesselius, P. R. 2001, A&A, 367, 949 [NASA ADS] [CrossRef] [EDP Sciences] [Google Scholar]
- Bernat, A. P. 1976, Ph.D. Thesis, University of Texas at Austin [Google Scholar]
- Cherchneff, I., Glassgold, A. E., & Mamon, G. A. 1993, ApJ, 410, 188 [NASA ADS] [CrossRef] [Google Scholar]
- Cernicharo, J., & Guélin, M. 1987, A&A 183, L10 [Google Scholar]
- Chaffee, F. H., Jr., & White, R. E. 1982, ApJS, 50, 169 [NASA ADS] [CrossRef] [Google Scholar]
- Coelho, P., Barbuy, B., Melendez, J., Schiavon, R. P., & Castilho, B. V. 2005, A&A, 443, 735 [NASA ADS] [CrossRef] [EDP Sciences] [Google Scholar]
- Cordiner, M. A., & Millar, T. J. 2009, ApJ, 697, 68 [NASA ADS] [CrossRef] [Google Scholar]
- Cordiner, M. A., Millar, T. J., Herbst, E., Chuimin, R. N., & Walsh, C. 2007, Molecules in Space and Laboratory, ed. J. L. Lemaire, & F. Combes, 98 [Google Scholar]
- Cox, P., Huggins, P. J., Maillard, J.-P., et al. 2002, A&A, 384, 603 [NASA ADS] [CrossRef] [EDP Sciences] [Google Scholar]
- Delbouille, L., Neven, L., & Roland, G. 1973, Photometric Atlas of the Solar Spectrum 3000 to 10 000 (Institut d'Astrophysique, University of Liège) [Google Scholar]
- Delgado Inglada, G., Rodríguez, M., Mampaso, A., & Viironen, K. 2009, ApJ, 694, 1335 [NASA ADS] [CrossRef] [Google Scholar]
- Draine, B. T. 2009, in Cosmic Dust-Near and Far, ed. Th. Henning, E. Grun, J. Steinacker, ASP Conf. Ser., [arXiv:0903.1658] [Google Scholar]
- Dunbar, R. C., & Petrie, S. 2002, ApJ, 564, 792 [NASA ADS] [CrossRef] [Google Scholar]
- Field, G. B. 1974, ApJ, 187, 453 [NASA ADS] [CrossRef] [Google Scholar]
- Gilman, R. C. 1969, ApJ, 155, L185 [Google Scholar]
- Glassgold, A. E., & Huggins, P. J. 1986, ApJ, 306, 605 [NASA ADS] [CrossRef] [Google Scholar]
- Highberger, J. L., & Ziurys, L. M. 2003, ApJ, 597, 1065 [NASA ADS] [CrossRef] [Google Scholar]
- Huggins, P. J., & Glassgold, A. E. 1982, ApJ, 252, 201 [NASA ADS] [CrossRef] [Google Scholar]
- Huggins, P. J., & Healy, A. P. 1986, ApJ, 304, 418 [NASA ADS] [CrossRef] [Google Scholar]
- Huggins, P. J., Olofsson, H., & Johansson, L. E. B. 1988, ApJ, 332, 1009 [NASA ADS] [CrossRef] [Google Scholar]
- Jura, M., & Morris, M. 1985, ApJ, 292, 487 [NASA ADS] [CrossRef] [Google Scholar]
- Kendall, T. R., Mauron, N., McCombie, J., & Sarre, P. J. 2002, A&A, 387, 624 [NASA ADS] [CrossRef] [EDP Sciences] [Google Scholar]
- Keyes, C. D., Aller, L. H., & Feibelman, W. A. 1990, PASP, 102, 59 [NASA ADS] [CrossRef] [Google Scholar]
- Kingdon, J., Ferland, G. J., & Feibelman, W. A. 1995, ApJ, 439, 793 [NASA ADS] [CrossRef] [Google Scholar]
- Kwan, J., & Hill, F. 1977, ApJ, 215, 781 [NASA ADS] [CrossRef] [Google Scholar]
- Lafont, S., Lucas, R., & Omont, A. 1982, A&A, 106, 201 [NASA ADS] [Google Scholar]
- Lodders, K. 2003, ApJ, 591, 1220 [NASA ADS] [CrossRef] [Google Scholar]
- Lodders, K., & Fegley, B., Jr. 1995, Meteoritics, 30, 661 [NASA ADS] [CrossRef] [Google Scholar]
- Lodders, K., & Fegley, B. Jr. 1999, Condensation Chemistry of Circumstellar Grains, in Asymptotic Giant Branch Stars, ed. T. Le Bertre, A. Lèbre, & C. Waelkens, IAU Symp., 191, 279 [Google Scholar]
- Loup, C., Forveille, T., Omont, A., & Paul, J. F. 1993, A&ASS, 99,291 [Google Scholar]
- Martin, P. G., & Rogers, C. 1987, ApJ, 322, 374 [NASA ADS] [CrossRef] [Google Scholar]
- Mauron, N., & Huggins, P. J. 1999, A&A, 349, 203 [NASA ADS] [Google Scholar]
- Mauron, N., & Huggins, P. J. 2000, A&A, 359, 707 [NASA ADS] [Google Scholar]
- Mauron, N., de Laverny, P., & Lopez, B. 2003, A&A, 401, 985 [NASA ADS] [CrossRef] [EDP Sciences] [Google Scholar]
- McCabe, E. M., Smith, R. C., & Clegg, R. E. S. 1979, Nature, 281, 263 [NASA ADS] [CrossRef] [Google Scholar]
- Middlemass, D. 1990, MNRAS, 244, 294 [NASA ADS] [Google Scholar]
- Morris, M., & Jura, M. 1983, ApJ, 264, 546 [NASA ADS] [CrossRef] [Google Scholar]
- Morton, D. C. 1991, ApJS, 77, 119 [NASA ADS] [CrossRef] [Google Scholar]
- Morton, D. C. 2000, ApJS, 130, 403 [NASA ADS] [CrossRef] [MathSciNet] [Google Scholar]
- Olofsson, H. 2005, ESA Spec. Publ., 577, 223 [NASA ADS] [Google Scholar]
- Péquignot, D., & Aldrovandi, S. M. V. 1986, A&A, 161, 169 [NASA ADS] [Google Scholar]
- Ramstedt, S., Schöier, F. L., Olofsson, H., & Lundgren, A. A. 2008, A&A, 487, 645 [NASA ADS] [CrossRef] [EDP Sciences] [Google Scholar]
- Savage, B. D., & Sembach, K. R. 1996, ARA&A, 34, 279 [NASA ADS] [CrossRef] [Google Scholar]
- Schöier, F. L., & Olofsson, H. 2001, A&A, 368, 969 [NASA ADS] [CrossRef] [EDP Sciences] [Google Scholar]
- Tsuji, T. 1973, A&A, 23, 411 [NASA ADS] [Google Scholar]
- Turner, B. E. 1995, Ap&SS, 224, 297 [NASA ADS] [CrossRef] [Google Scholar]
- Young, K., Phillips, T. G., & Knapp, G. R. 1993, ApJSS, 86, 517 [CrossRef] [Google Scholar]
- Zhang, Y., Liu, X.-W., Luo, S.-G., Péquignot, D., & Barlow, M. J. 2005, A&A, 442, 249 [NASA ADS] [CrossRef] [EDP Sciences] [Google Scholar]
- Ziurys, L. M. 2006a, Proceedings of the National Academy of Science, 103, 12274 [Google Scholar]
- Ziurys, L. M. 2006b, Astrochemistry - From Laboratory Studies to Astronomical Observations, 855, 231 [NASA ADS] [Google Scholar]
- Ziurys, L. M., Apponi, A. J., Guelin, M., & Cernicharo, J. 1995, ApJ, 445, L47 [NASA ADS] [CrossRef] [Google Scholar]
- Ziurys, L. M., Savage, C., Highberger, J. L., et al. 2002, ApJ, 564, L45 [NASA ADS] [CrossRef] [Google Scholar]
Footnotes
- ... IRC+10216
- Based on observations made with the VLT telescope and the UVES spectrograph at the European Southern Observatory in Paranal, Chile (ESO program 66.C-0220).
All Tables
Table 1: Metal lines in the envelope of IRC+10216.
Table 2: Parameters of the K I components in IRC+10216.
Table 3: Abundances in the envelope of IRC+10216.
Table 4: Metal bearing molecules in IRC+10216.
All Figures
|
|
Figure 1:
V-band image of the circumstellar envelope of IRC+10216,
made with the VLT. The field size is
|
| Open with DEXTER | |
| In the text | |
|
|
Figure 2:
Spectra of the K I doublet at 7664.91 Å
( upper panel) and 7698.97 Å ( lower panel). In each panel, the
arrow on the right marks the photospheric line (
|
| Open with DEXTER | |
| In the text | |
|
|
Figure 3: Comparison of the observed (black) and synthesized (grey) profiles of the K I 7698.97 Å line, using the parameters given in Table 2. The individual components are also shown. |
| Open with DEXTER | |
| In the text | |
|
|
Figure 4:
Spectra of the Na I doublet at 5889.95 Å (upper
panel) and 5895.92 Å ( lower panel). Arrows mark the
photospheric and envelope components, as in Fig. 2. The triangles mark
an interstellar Na I component (at
|
| Open with DEXTER | |
| In the text | |
|
|
Figure 5: Spectrum of the Ca I line at 4226.73 Å. Upper panel: the observed spectrum (full line) and fitted template (dotted line). Arrows indicate the photospheric and envelope components as in Fig. 2. Lower panel: spectrum normalized to the template. The dotted line replaces the spectrum over the photosperic core region. |
| Open with DEXTER | |
| In the text | |
|
|
Figure 6: Spectra of the Ca II H and K doublet at 3933.66 Å ( upper panel) and 3968.46 Å ( lower panel). Arrows mark the photospheric and envelope components, as in Fig. 2. The solid lines show the observed spectra, the dotted lines show the template spectra. |
| Open with DEXTER | |
| In the text | |
|
|
Figure 7: Spectrum of the Fe I line at 3719.93 Å. Details as in Fig. 5. |
| Open with DEXTER | |
| In the text | |
|
|
Figure 8: Spectrum of the Fe I line at 3859.91 Å. Details as in Fig. 5. |
| Open with DEXTER | |
| In the text | |
Copyright ESO 2010
Current usage metrics show cumulative count of Article Views (full-text article views including HTML views, PDF and ePub downloads, according to the available data) and Abstracts Views on Vision4Press platform.
Data correspond to usage on the plateform after 2015. The current usage metrics is available 48-96 hours after online publication and is updated daily on week days.
Initial download of the metrics may take a while.