| Issue |
A&A
Volume 513, April 2010
|
|
|---|---|---|
| Article Number | A63 | |
| Number of page(s) | 6 | |
| Section | Astrophysical processes | |
| DOI | https://doi.org/10.1051/0004-6361/200913355 | |
| Published online | 30 April 2010 | |
Aperiodic optical variability of intermediate polars - cataclysmic variables with truncated accretion disks
M. Revnivtsev1,2 - R. Burenin2 - I. Bikmaev3 - A. Kniazev4,5 - D. A. H. Buckley4,5 - M. L. Pretorius6,4,5 - I. Khamitov7 - T. Ak7,8 - Z. Eker7 - S. Melnikov3 - S. Crawford4 - M. Pavlinsky2
1 - Excellence Cluster Universe, Technische Universität München,
Boltzmannstr.2, 85748 Garching, Germany
2 -
Space Research Institute, Russian Academy of Sciences,
Profsoyuznaya 84/32, 117997 Moscow, Russia
3 - Kazan State University, ul. Kremlevskaya 18, Kazan, Russia
4 - South African Astronomical Observatory, PO Box 9, 7935 Observatory, Cape
Town, South Africa
5 -
Southern African Large Telescope Foundation, PO Box 9, 7935 Observatory,
Cape Town, South Africa
6 -
European Southern Observatory, Alonso de Cordova 3107, Santiago, Chile
7 - TUBITAK National Observatory, 07058 Antalya, Turkey
8 - Istanbul University Faculty of Science Department of Astronomy and
Space Sciences, 34119 University, Istanbul, Turkey
Received 25 September 2009 / Accepted 1 February 2010
Abstract
We study the power spectra of the variability of seven intermediate
polars containing magnetized asynchronous accreting white dwarfs, XSS
J00564+4548, IGR J00234+6141, DO Dra, V1223 Sgr, IGR
J15094-6649, IGR J16500-3307 and IGR J17195-4100, in the optical
band and demonstrate that their variability can be well described by a
model based on fluctuations propagating in a truncated accretion disk.
The power spectra have breaks at Fourier frequencies, which we
associate with the Keplerian frequency of the disk at the boundary of
the white dwarfs' magnetospheres. We propose that the properties of the
optical power spectra can be used to deduce the geometry of the inner
parts of the accretion disk, in particular: 1) truncation radii of the
magnetically disrupted accretion disks in intermediate polars, 2) the
truncation radii of the accretion disk in quiescent states of dwarf
novae.
Key words: accretion, accretion disks - instabilities - binaries: general - novae, cataclysmic variables - white dwarfs -
stars: variables: general
1 Introduction
Aperiodic variations in the intensity of many astrophysical sources carry
a lot of information about physical processes in and around them, which is
complementary to and completely independent of all other types of astrophysical
information. It was noticed already long ago that accreting sources
typically demonstrate flux variability on a wide range of time scales, from
milliseconds and seconds for galactic compact objects (e.g.
Linnell 1950 for accreting white dwarfs, Oda et al. 1974; Rappaport et al. 1971
for X-ray binaries) to months and years for accreting supermassive black
holes in active galactic nuclei (e.g. Zaitseva & Lyutyi 1969). Aperiodic flux
variations of X-ray emitting compact sources were discovered since the 1970s
and have been extensively studied since then. Typically these aperiodic flux
variations have a power spectrum (square of Fourier transform of the light
curve) that can be described as a power law with a slope
![]() ,
sometimes with flattening at low Fourier frequencies and
steepening at high Fourier frequencies. It was recognized that photons,
which contain this flux variability, originate in the innermost regions of
the accretion flow. While for X-ray accreting sources it was quite clear
from the beginning (simply from energy contained in the variable part of the
X-ray radiation), for accreting white dwarfs it was shown with the help of
eclipse mapping (e.g. Baptista & Bortoletto 2004; Bruch 1992,1996).
,
sometimes with flattening at low Fourier frequencies and
steepening at high Fourier frequencies. It was recognized that photons,
which contain this flux variability, originate in the innermost regions of
the accretion flow. While for X-ray accreting sources it was quite clear
from the beginning (simply from energy contained in the variable part of the
X-ray radiation), for accreting white dwarfs it was shown with the help of
eclipse mapping (e.g. Baptista & Bortoletto 2004; Bruch 1992,1996).
Table 1: Optical observations of accreting white dwarfs used for construction of power spectra.
However, until recently the origin of the these variations remained unclear. This variability possesses a set of properties that was not easy to explain in early models. For example, the shot-noise model (see e.g. Terrell 1972) proposed that the variability originates as a result of additive summation of randomly occurring exponential ``shots''. This model explained the shape of power spectra of some X-ray binaries (e.g. Kraicheva et al. 1999; Terrell 1972), but failed to reproduce very essential observational properties: 1) the extremely wide range of variability time scales, on which the variability has a self-similar power spectrum in some cases (Churazov et al. 2001); 2) the linear dependence of the amplitude of flux variability on the time average flux of the source (Uttley & McHardy 2001); 3) the log-normal distribution of instantaneous values of the flux and 4) the behavior of the frequency dependent phase lags between lightcurves in different energy bands (Kotov et al. 2001; Miyamoto et al. 1988).
Now it is widely accepted that the most appropriate model of the flux variability of accreting sources is the model of propagating fluctuations (Churazov et al. 2001; Lyubarskii 1997). In this model the variability of observed flux originates as a transformation of variability of the instantaneous mass accretion rate in the innermost regions of the accretion flow (where the majority of the emission is created) into a variability of the emergent luminosity. In turn, the variability of the mass accretion rate in the innermost region is a result of propagation (in the flow going inward) of variability created at all outer radii of the extended accretion disk. All inner regions of the disk create additional modulations to the instantaneous mass accretion rate on top of already existing longer time scale variability, transported to this radius from outer parts of the disk. The combined action of all radii of the disk creates power spectra with relatively shallow slopes (-1 ...-1.5) (see e.g. Churazov et al. 2001; Lyubarskii 1997). This relatively simple construction allows us to explain all the major observational characteristics of flux variability (see more details in Churazov et al. 2001; Revnivtsev 2008; Kotov et al. 2001; Uttley & McHardy 2001).
In the framework of this model one can make very specific predictions for the shape of the power spectra of flux variability of accretion flows. For example, the accretion disk with an inner boundary should have a break in the power density spectrum of its time variability, approximately at the Fourier frequency, which corresponds to the typical time scales of variability introduced into the flow at the inner radius of the disk.
Accretion-powered X-ray pulsars and asynchronous magnetic white dwarfs (intermediate polars) have magnetic fields strong enough to disrupt the inner parts of the accretion disks. Thus the the fastest variability timescales associated with the innermost regions of the disk should be absent or reduced in their power spectra.
This assumption was recently explored by Revnivtsev et al. (2009) in the X-ray energy domain, who analyzed a large sample of magnetized accretion- powered objects (X-ray pulsars and an intermediate polar) and showed that the variabilities of all these sources indeed have a break in their power spectra at the anticipated Fourier frequencies. The frequency of these breaks corresponds to the the inner disk Keplerian frequency at the boundary of the central object's magnetosphere. The conclusion was strongly supported because the frequency of the break varied during the giant outbursts of accretion-powered X-ray pulsars, in accordance with the simple prediction of how the radius of the dipole magnetosphere of the central object (and consequently the disk Keplerian frequency at this boundary) should vary with the mass accretion rate (X-ray luminosity). Among other things, this study opens a new possibility to measure the properties of magnetospheres of compact objects via the study of their flux variability. In a lot of cases this approach is much easier than trying to measure the cyclotron absorption lines in spectra of pulsars or polarization of photons originated in the magnetized accretion curtains in intermediate polars.
We present results of our pilot study of aperiodic variability of some asynchronous magnetized accreting white dwarfs (intermediate polars) with accretion disks (this is an essential ingredient of binary systems in our sample, because sometimes asynchronous magnetized accreting white dwarfs might be stream-fed rather then disk-fed , see e.g. Hellier & Beardmore 2002) in the optical bands (B,V,g',R) and show the applicability of the method.
Observational data for our study was collected with the help of the Russian-Turkish telescope RTT150, the Southern African Large Telescope (SALT), 0.76 m and 1 m telescopes of South African Astronomical Observatory.
2 Observational data
Power spectra of variability of optical light curves of accreting intermediate polars
were obtained via Lomb-Scargle periodograms (Scargle 1982; Lomb 1976),
averaged over all available uninterrupted datasets. As the typical
length of datasets is approximately several hours, the lowest Fourier
frequency probed by our power spectra were ![]() 10-4 Hz, while the highest frequencies depend on the time resolution used. In Table 1
we present the list of sources, used in our analysis. Optical
magnitudes of binaries are approximate, because of significant long
term flickering, present in all systems. Photometry of SALT is subject
to additional uncertainty because of the method of observations (see
below).
10-4 Hz, while the highest frequencies depend on the time resolution used. In Table 1
we present the list of sources, used in our analysis. Optical
magnitudes of binaries are approximate, because of significant long
term flickering, present in all systems. Photometry of SALT is subject
to additional uncertainty because of the method of observations (see
below).
2.1 RTT150
Optical observations of the intermediate polars XSS J00564+4548, IGR J00234+6141 and DO Dra (=YY Dra) were carried out with 1.5-m Russian-Turkish Telescope (RTT150) at TÜBITAK National Observatory (TUG), Bakirlitepe mountain, Turkey. The objects were observed as a part of a long-term program of study of aperiodic optical variability of cataclysmic variables (CVs).
We used a low-readout noise back-illuminated
![]() K Andor DW436 CCD in
combination with B, g', V, or R filters, mounted in F/7.7 Cassegrain
focus of the telescope. The measurements with >1 s time resolution were
obtained from the series of direct images taken with only a small CCD
subframe near the object. The bias was subtracted and flat-field correction
was applied for all images. The subframe included also at least one bright
non-variable reference star, used for differential photometry. The use of
differential photometry allowed us to diminish the influence of atmospheric
turbulence on the resulting measurements, which is extremely important for
aperiodic variability studies. Data reduction and photometric measurements
were made with IRAF
K Andor DW436 CCD in
combination with B, g', V, or R filters, mounted in F/7.7 Cassegrain
focus of the telescope. The measurements with >1 s time resolution were
obtained from the series of direct images taken with only a small CCD
subframe near the object. The bias was subtracted and flat-field correction
was applied for all images. The subframe included also at least one bright
non-variable reference star, used for differential photometry. The use of
differential photometry allowed us to diminish the influence of atmospheric
turbulence on the resulting measurements, which is extremely important for
aperiodic variability studies. Data reduction and photometric measurements
were made with IRAF![]() and our own
software.
and our own
software.
The measurements with ![]() 1 s time resolution were made with the
setup where the narrow strip of the CCD was binned in its width into only
one pixel, so that only one line of the data was read out of the CCD in each
exposure. That was done to diminish the CCD read-out time. This
setup also allowed us to make the differential photometric measurements, since
the bright non-variable bright reference star was also observed in another
part of this strip. We checked that these differential photometric
measurements effectively eliminated the influence of atmospheric turbulence
even at these higher frequencies. The detailed description of this setup and
appropriate calibration measurements can be found in Burenin et al. (in prep.).
1 s time resolution were made with the
setup where the narrow strip of the CCD was binned in its width into only
one pixel, so that only one line of the data was read out of the CCD in each
exposure. That was done to diminish the CCD read-out time. This
setup also allowed us to make the differential photometric measurements, since
the bright non-variable bright reference star was also observed in another
part of this strip. We checked that these differential photometric
measurements effectively eliminated the influence of atmospheric turbulence
even at these higher frequencies. The detailed description of this setup and
appropriate calibration measurements can be found in Burenin et al. (in prep.).
2.2 SAAO
Light curves of three intermediate polars IGR J15094-6649, IGR J16500-3307 and IGR J17195-4100 were obtained with the SAAO 1-m and 0.76-m telescopes and the UCT CCD (this is a frame-transfer CCD, implying that there is no dead time between exposures). Detailed description of these data is presented in Pretorius (2009).
2.3 SALT
High time-resolution observations of V1223 Sgr were taken at the prime
focus of the newly available 10-m class Southern African Large
Telescope (SALT; O'Donoghue et al. 2006; Buckley et al. 2006) during its performance
verification phase on 2008 May 13 and June 12. Observations were done with the
imaging camera (SALTICAM; O'Donoghue et al. 2003,2004) in ``slot mode''
(O'Donoghue et al. 2006). The SALTICAM is a CCD mosaic of two
![]() pixels
CCDs with full image size of about
pixels
CCDs with full image size of about
![]() arcmin,
but the nominal
science field is 8 arcmin. In ``slot mode'', a mask with a slot of
the width of 20 arcsec (144 unbinned rows) is projecting on
the CCDs. Only the central 72 rows receive all the light. The slot
extends across the full 8 arcmin in the horizontal direction.
After each exposure, only 144 rows are transferred across the
frame-transfer boundary, which shortens the vertical clocking overhead
to 14 ms. The instrument thus provided a sequence of images
8 arcmin long, but only 20 arcsec wide. These images were
split into four distinct sections, corresponding to the four readout
amplifiers of the two CCDs.
arcmin,
but the nominal
science field is 8 arcmin. In ``slot mode'', a mask with a slot of
the width of 20 arcsec (144 unbinned rows) is projecting on
the CCDs. Only the central 72 rows receive all the light. The slot
extends across the full 8 arcmin in the horizontal direction.
After each exposure, only 144 rows are transferred across the
frame-transfer boundary, which shortens the vertical clocking overhead
to 14 ms. The instrument thus provided a sequence of images
8 arcmin long, but only 20 arcsec wide. These images were
split into four distinct sections, corresponding to the four readout
amplifiers of the two CCDs.
Total tracking time was ![]() 2700 s on May 13 and
2700 s on May 13 and ![]() 1300 s on
June 12. The observations were made with the B filter. In order to
facilitate the shortest possible exposures,
1300 s on
June 12. The observations were made with the B filter. In order to
facilitate the shortest possible exposures,
![]() binning,
or 1.2 arcsec/pixel was used. The exposure time for each image was
112 ms (the time to move each image behind the mask, during which
image smearing takes place, is
14 ms). The observed data were all referenced to the nearby star
of similar
magnitude, 63 arcsec to the east and 7 arcsec south of the
target star. The
comparison star and the target star were imaged within the same
amplifier.
No flat-field calibration frames were obtained (the calibration system
was
not available at the time of the observations) and the frames were
simply
bias-subtracted with overscanned pixels from each row.
binning,
or 1.2 arcsec/pixel was used. The exposure time for each image was
112 ms (the time to move each image behind the mask, during which
image smearing takes place, is
14 ms). The observed data were all referenced to the nearby star
of similar
magnitude, 63 arcsec to the east and 7 arcsec south of the
target star. The
comparison star and the target star were imaged within the same
amplifier.
No flat-field calibration frames were obtained (the calibration system
was
not available at the time of the observations) and the frames were
simply
bias-subtracted with overscanned pixels from each row.
The data reduction of ``slot mode'' was done with the the PySALT user
package. This tool is primarily written in python/PyRAF with some
additional IRAF code![]() .
.
Analysis of the lightcurves obtained with SALTICAM in the described mode
revealed problems in power spectra of celestial sources at Fourier
frequencies higher than ![]() 1 Hz, while at lower frequencies the results
remained reliable. Therefore in our subsequent analysis we have not
considered power spectra of the considered source at Fourier frequency
higher than 0.7 Hz.
1 Hz, while at lower frequencies the results
remained reliable. Therefore in our subsequent analysis we have not
considered power spectra of the considered source at Fourier frequency
higher than 0.7 Hz.
Power spectra of V1223 Sgr obtained in different observations were virtually indistinguishable from each other, therefore we averaged them.
3 Discussion
3.1 Power spectra of optical emission of CVs
Optical emission of white dwarfs![]() consists of two parts: one is provided by the internal energy
dissipation inside the disk and another is a reprocessed EUV or X-ray
emission of white dwarf polar caps.
consists of two parts: one is provided by the internal energy
dissipation inside the disk and another is a reprocessed EUV or X-ray
emission of white dwarf polar caps.
![\begin{figure}
\par\includegraphics[width=9cm,clip]{13355_fig1.eps}
\end{figure}](/articles/aa/full_html/2010/05/aa13355-09/img9.png)
|
Figure 1: Scheme of accretion flow in magnetized accreting white dwarfs. |
| Open with DEXTER | |
In the framework of the model of propagating fluctuations we predict that the variability of the optical light in intermediate polars will be similar to that of the X-rays. There are two main scenarios:
- 1.
- If the optical emission of the system originates from the reprocessed X-rays, the X-ray and optical variability should be similar by construction.
- 2.
- If the optical light is due to internal heating of the extended accretion disk, we should still expect to observe similar power spectra of optical and X-ray light curves. That is because in both cases the flux variability is caused by the same fluctuations of the mass accretion rate. These fluctuations first affect the optical emission of the disk and after that, when this same matter falls down onto the polar caps of the white dwarf, it changes the X-ray emission in the accretion column.
The majority of white dwarfs are faint in X-rays (typical fluxes are less than on the order of few photons/1000 sq.cm./s), therefore it is very difficult to observe them in X-rays. However, they can be more easily observed in the optical band. Therefore the study of optical variability in accreting white dwarfs can provide important diagnostics of the geometry of the inner parts of the accretion flow. In particular, we can immediately apply the diagnostics:
- to make estimates of the magnetic moment of white dwarfs. In the simplest model of dipolar magnetosphere of the white dwarf, the dependence of the inner disk radius on the mass accretion rate in the disk is determined mainly by the white dwarf magnetic moment. Therefore measurements of power spectra of white dwarf variability in different accretion states will allow us to make estimates of the magnetic field. The proposed approach might be more sensitive than the search for cyclotron emission lines in optical-NIR spectra of objects.
- to make estimates of holes in the innermost regions of the accretion disk due to evaporation, predicted in some models of the quiescent accretion on white dwarfs (e.g. Meyer & Meyer-Hofmeister 1994).
3.2 Observed power spectra
![\begin{figure}
\par\includegraphics[width=8.8cm,clip]{13355_fig2.eps}
\end{figure}](/articles/aa/full_html/2010/05/aa13355-09/img11.png)
|
Figure 2: Power spectra of
V1223 Sgr in X-ray and in optical spectral bands. Dashed curves
denote the simple analytic model described in the text (
|
| Open with DEXTER | |
The observations of one of the brightest intermediate polars, V1223 Sgr, agree
well with the considerations presented above. In Fig. 2 we
present the power spectra of V1223 Sgr in optical and in X-rays
(from Revnivtsev et al. 2009). The similarity of these power spectra is striking. We
fitted these power density spectra with a simple analytical function
![]() (essential property whose is that
it has a slope
(essential property whose is that
it has a slope
![]() at frequencies f<f0 and a slope
at frequencies f<f0 and a slope
![]() at higher Fourier frequencies). The values of the break frequencies
in optical and in X-rays are:
at higher Fourier frequencies). The values of the break frequencies
in optical and in X-rays are:
![]() Hz,
Hz,
![]() Hz (in order to determine the
Hz (in order to determine the
![]() values and their confidence intervals we used the
values and their confidence intervals we used the ![]() minimization technique). The break
frequencies are compatible at the 2
minimization technique). The break
frequencies are compatible at the 2![]() level. There is marginal
evidence for a higher break-frequency in X-rays, but it may be
explained, for example, by a long-term difference in the accretion-rate of the source,
since the optical and X-ray data were obtained in different epochs.
level. There is marginal
evidence for a higher break-frequency in X-rays, but it may be
explained, for example, by a long-term difference in the accretion-rate of the source,
since the optical and X-ray data were obtained in different epochs.
Assuming that the break frequency corresponds to the Keplerian frequency at
the boundary of the white dwarf magnetosphere (Revnivtsev et al. 2009), we can
estimate its radius as
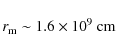
or
In Fig. 3 we present power spectra of optical variability of seven objects -- XSS J00564+4548, IGR J00234+6141, V1223 Sgr, DO Dra, IGR J15094-6649, IGR J16500-3307 and IGR J17195-4100, measured with data described in the Sect. 2. The frequency axis of the power spectra was multiplied by the spin period of the white dwarf magnetospheres. In the power spectra of a majority of these objects we removed the peak (simply by removing measurements of a power at Fourier frequencies near the inverse of WD rotational period), which was caused by spin modulated variations of the optical brightness of the sources. Fainter (and possibly wider) QPO peaks may be present also in power spectra of objects without us detecting them. If such QPO peaks reside near the break frequency, they could somehow contribute to the observed sharpness of the break in some power spectra in Fig. 3. However, the discussion of these possible QPO peaks is beyond the scope of this paper.
In the framework of our model we predict that on this plot all accreting magnetic white dwarfs, in which the inner parts of the accretion disks are in corotation with white dwarf magnetospheres, will have breaks in the power spectra at a value around unity, i.e. around the WD spin frequency (see e.g. Fig. 3 and Table 2). If the accretion disk continues significantly below the corotation radius, the break in the power spectrum should be observed at a higher Fourier frequency.
Table 2: Parameters of the break frequencies of the power spectra of the studied sources.
![\begin{figure}
\par\includegraphics[width=8.8cm,clip]{13355_fig3.eps}
\end{figure}](/articles/aa/full_html/2010/05/aa13355-09/img31.png)
|
Figure 3: Power spectra of optical variability of a sample of intermediate polars. Power spectra of DO Dra, XSS J00564+4548, IGR J00234+6141, IGR J17195-4100, and IGR J15094-6649 were scaled down for clarity by factors, written on the figure. For comparison we present two power spectra of accreting X-ray pulsar A0535+26, collected during episodes of high and low mass accretion rates (thick solid histograms). See text for the details. |
| Open with DEXTER | |
For comparison, we also show in Fig. 3 the power spectra of an
accreting X-ray pulsar, A0535+26, during its low and high luminosity state,
i.e. during the periods of its high and low mass accretion rates (from Revnivtsev et al. 2009). One can
see that the power spectrum of the X-ray emission of A0535+26 with a high mass
accretion rate continues to higher Fourier frequencies (
![]() ), while variability at lower frequencies (
), while variability at lower frequencies (
![]() )
remained at almost the same level.
)
remained at almost the same level.
The difference at high frequencies can be explained as an addition of an extra noise component, which is presumably generated in the annulus of accretion disk between the radii corresponding to the magnetosphere size in the high accretion rate (small radius) and low accretion rate (large radius). This ring and therefore the associated variability were absent in the state with low accretion rate.
We can see that the behavior of accreting WDs is qualitatively very similar to that of accreting neutron stars. Power spectra of all IPs except for V1223 Sgr indicate that their white dwarfs are close to corotation with the inner edges of their accretion disks, while in V1223 Sgr the accretion disk should be truncated at a radius smaller than that of corotation. Simple models predict a spin-up of the central object in this case.
This prediction
does not agree with the detection of spin down, reported for this system
approximately 20 years ago by van Amerongen et al. (1987),
but this discrepancy
may be explainable. For example, the source may have started to spin up
since that time. Therefore additional observations are needed to
investigate
this. Also, there may be a more complicated interaction of the
accretion disk with the white dwarf magnetosphere, in which the angular
momentum of the white
dwarf is diminishing while the accretion disk extends significantly
below
the corotation radius (corotation radius in this case is ![]() 16
16
![]() ). As an argument in favor of this scenario we can mention that there
are many of cases when actively accreting magnetic neutron stars do
have a spin-down, while in a simple picture of accretion the matter settling
to the surface of the star should always speed up the rotation (if the disk
is prograde).
). As an argument in favor of this scenario we can mention that there
are many of cases when actively accreting magnetic neutron stars do
have a spin-down, while in a simple picture of accretion the matter settling
to the surface of the star should always speed up the rotation (if the disk
is prograde).
4 Summary and perspectives
We demonstrated that high quality power spectra of optical and X-ray variability of the intermediate polar, V1223 Sgr (accreting white dwarf with a magnetosphere that disrupts the accretion disk at relatively large distances from white dwarf surface), are very similar to each other. Both power spectra have a very distinct break at a Fourier frequency which we associate with the Keplerian frequency at the inner radii of the truncated accretion disk. At higher Fourier frequencies the power spectra steepen.
The similarity of the V1223 Sgr power spectra in the X-ray and the optical is expected in both scenarios of the origin of optical emission - if optical emission is dominated by the reprocessing of X-rays and if optical emission originates in the disk itself due to its internal heating. However, these two scenarios predict different lags between the optical and X-ray emission of IPs. In the former case the optical emission should lag the X-rays, in the latter it should lead the X-rays. This issue can be studied using simultaneous optical and X-ray observations of the source.
With a sample of magnetized white dwarfs we demonstrated that this behavior may be universal for white dwarfs with truncated accretion disks, like intermediate polars, with the break frequencies depending on the mass accretion rate. This behavior is very similar to that of accreting neutron stars with truncated accretion disks (e.g. accretion powered X-ray pulsars).
We suggest that the values of the break frequencies in power spectra of accreting white dwarfs can be used to make estimates of the inner radii of the truncated accretion disks. In turn, these can be used to make estimates of the white dwarf magnetic fields.
We proposed a few tests of the outlined paradigm. In particular, for observations of intermediate polars at different mass accretion rates our interpretation predicts that the break frequency of their power spectra should increase with an increasing mass accretion rate in the binary system.
AcknowledgementsWe thank TUBITAK, IKI and KSU for partial supports in using the RTT150 (Russian-Turkish 1.5-m telescope in Antalya) with the project numbers 998,999. The authors thank Vadim Arefiev (IKI) and Marat Gilfanov (IKI, MPA) for providing us data of their observational sets; Denis Stetsenko, Roman Zhuchkov, Almaz Galeev (KSU), Alexey Tkachenko, Denis Denissenko, Nikolay Aleksandrovitch (IKI) for assistance in observations at RTT150. M.R. thanks Eugene Churazov and Koji Mukai for useful discussions. This research made use of data obtained from the High Energy Astrophysics Science Archive Research Center Online Service, provided by the NASA/Goddard Space Flight Center. This work was supported by a grant of Russian Foundation of Basic Research 07-02-01004, 07-02-01051, 07-02-00961, 08-08-13734, 09-02-97013-p-povolzh'e-a, NSh-5579.2008.2, NSh-4224.2008.2 and program of Presidium of RAS ``The origin and evolution of stars and galaxies'' (P04). Some of the observations reported in this paper were obtained with the Southern African Large Telescope (SALT), a consortium consisting of the National Research Foundation of South Africa, Nicholas Copernicus Astronomical Center of the Polish Academy of Sciences, Hobby Eberly Telescope Founding Institutions, Rutgers University, Georg-August-Universitaet Göttingen, University of Wisconsin-Madison, Carnegie Mellon University, University of Canterbury, United Kingdom SALT Consortium, University of North Carolina - Chapel Hill, Dartmouth College, American Museum of Natural History and the Inter-University Centre for Astronomy and Astrophysics, India. We are grateful for the support of numerous people during the SALT PV phase.
References
- Arévalo, P., & Uttley, P. 2006, MNRAS, 367, 801 [NASA ADS] [CrossRef] [Google Scholar]
- Balbus, S. A., & Papaloizou, J. C. B. 1999, ApJ, 521, 650 [NASA ADS] [CrossRef] [Google Scholar]
- Baptista, R., & Bortoletto, A. 2004, AJ, 128, 411 [NASA ADS] [CrossRef] [Google Scholar]
- Barros, S. C. C., Marsh, T. R., Dhillon, V. S., et al. 2007, MNRAS, 374, 1334 [NASA ADS] [CrossRef] [Google Scholar]
- Beuermann, K., Harrison, Th. E., McArthur, B. E., Benedict, G. F., & Gnsicke, B. T. 2004, A&A, 419, 219 [Google Scholar]
- Bradt, H. V., Rothschild, R. E., & Swank, J. H. 1993, A&AS, 97, 355 [NASA ADS] [Google Scholar]
- Bruch, A. 1992, A&A, 266, 237 [NASA ADS] [Google Scholar]
- Bruch A. 1996, A&A, 312, 97 [NASA ADS] [Google Scholar]
- Buckley, D. A. H., Swart, G. P., & Meiring, J. G. 2006, SPIE, 6267 [Google Scholar]
- Churazov, E., Gilfanov, M., & Revnivtsev, M. 2001, MNRAS, 321, 759 [NASA ADS] [CrossRef] [Google Scholar]
- Hellier, C., & Beardmore, A. P. 2002, MNRAS, 331, 407 [NASA ADS] [CrossRef] [Google Scholar]
- Jensen, K. A., Middleditch, J., Grauer, A. D., et al. 1983, ApJ, 270, 211 [NASA ADS] [CrossRef] [Google Scholar]
- Kotov, O., Churazov, E., & Gilfanov, M. 2001, MNRAS, 327, 799 [NASA ADS] [CrossRef] [Google Scholar]
- Kraicheva, Z., Stanishev, V., Genkov, V., et al. 1999, A&A, 351, 607 [NASA ADS] [Google Scholar]
- Lomb, N. R. 1976, Ap&SS, 39, 447 [NASA ADS] [CrossRef] [Google Scholar]
- Linnell, A. P. 1950, HarCi, 455, 1 [NASA ADS] [Google Scholar]
- Lyubarskii, Y. E. 1997, MNRAS, 292, 679 [NASA ADS] [CrossRef] [Google Scholar]
- Meyer, F., & Meyer-Hofmeister, E. 1994, A&A, 288, 175 [NASA ADS] [Google Scholar]
- Miyamoto, S., Kitamoto, S., Mitsuda, K., et al. 1988, Nature, 336, 450 [NASA ADS] [CrossRef] [Google Scholar]
- Oda, M., Takagishi, K., Matsuoka, M., Miyamoto, S., & Ogawara, Y. 1974, PASJ, 26, 303 [NASA ADS] [Google Scholar]
- O'Donoghue, D., Buckley, D. A. H., Balona, L. A., et al. 2003, SPIE, 4841, 465 [Google Scholar]
- O'Donoghue, D. Balona, L. A., Carter, D. B., et al. 2004, SPIE, 5499, 406 [NASA ADS] [CrossRef] [Google Scholar]
- O'Donoghue, D., Buckley, D. A. H., Balona, L. A., et al. 2006, MNRAS, 372, 151 [NASA ADS] [CrossRef] [Google Scholar]
- Pandel, D., Córdova, F. A., & Howell, S. B. 2003, MNRAS, 346, 1231 [NASA ADS] [CrossRef] [Google Scholar]
- Pretorius, M. L. 2009, MNRAS, 395, 386 [NASA ADS] [CrossRef] [Google Scholar]
- Rappaport, S., Doxsey, R., & Zaumen, W. 1971, ApJ, 168, L43 [NASA ADS] [CrossRef] [Google Scholar]
- Revnivtsev, M. 2008, AIPC, 1054, 143 [NASA ADS] [Google Scholar]
- Revnivtsev, M., Churazov, E., Postnov, K., et al. 2009, A&A, 507, 1211 [NASA ADS] [CrossRef] [EDP Sciences] [Google Scholar]
- Scargle J. D. 1982, ApJ, 263, 835 [NASA ADS] [CrossRef] [Google Scholar]
- Shakura, N. I., & Sunyaev, R. A. 1973, A&A, 24, 337 [NASA ADS] [Google Scholar]
- Suleimanov, V., Revnivtsev, M., & Ritter, H. 2005, A&A, 435, 191 [NASA ADS] [CrossRef] [EDP Sciences] [Google Scholar]
- Terrell, N. J. J. 1972, ApJ, 174, L35 [NASA ADS] [CrossRef] [Google Scholar]
- Uttley, P., & McHardy, I. M. 2001, MNRAS, 323, L26 [NASA ADS] [CrossRef] [Google Scholar]
- van Amerongen, S., Augusteijn, T., & van Paradijs, J. 1987, MNRAS, 228, 377 [NASA ADS] [Google Scholar]
- Zaitseva, G. V., & Lyutyi, V. M. 1969, SvA, 13, 184 [NASA ADS] [Google Scholar]
Footnotes
- ... IRAF
![[*]](/icons/foot_motif.png)
- http://tucana.tuc.noao.edu/
- ... code
- See http://www.salt.ac.za/science-support/salt-data-reduction/pysalt-users-package/ for more information.
- ... dwarfs
- We emphasize that we consider here only magnetic cataclysmic variables with accretion disks which might not always be the case even for asynchronous magnetic CVs, taking into account the existence of stream fed systems like V2400 Oph, see, e.g. Hellier & Beardmore (2002).
All Tables
Table 1: Optical observations of accreting white dwarfs used for construction of power spectra.
Table 2: Parameters of the break frequencies of the power spectra of the studied sources.
All Figures
|
|
Figure 1: Scheme of accretion flow in magnetized accreting white dwarfs. |
| Open with DEXTER | |
| In the text | |
|
|
Figure 2: Power spectra of
V1223 Sgr in X-ray and in optical spectral bands. Dashed curves
denote the simple analytic model described in the text (
|
| Open with DEXTER | |
| In the text | |
|
|
Figure 3: Power spectra of optical variability of a sample of intermediate polars. Power spectra of DO Dra, XSS J00564+4548, IGR J00234+6141, IGR J17195-4100, and IGR J15094-6649 were scaled down for clarity by factors, written on the figure. For comparison we present two power spectra of accreting X-ray pulsar A0535+26, collected during episodes of high and low mass accretion rates (thick solid histograms). See text for the details. |
| Open with DEXTER | |
| In the text | |
Copyright ESO 2010
Current usage metrics show cumulative count of Article Views (full-text article views including HTML views, PDF and ePub downloads, according to the available data) and Abstracts Views on Vision4Press platform.
Data correspond to usage on the plateform after 2015. The current usage metrics is available 48-96 hours after online publication and is updated daily on week days.
Initial download of the metrics may take a while.