| Issue |
A&A
Volume 513, April 2010
|
|
|---|---|---|
| Article Number | A61 | |
| Number of page(s) | 14 | |
| Section | Atomic, molecular, and nuclear data | |
| DOI | https://doi.org/10.1051/0004-6361/200911967 | |
| Published online | 29 April 2010 | |
Neutron-induced astrophysical reaction rates for translead nuclei![[*]](/icons/foot_motif.png)
I. V. Panov1,2,3 - I. Yu. Korneev3 - T. Rauscher1 - G. Martínez-Pinedo45 - A. Kelic-Heil4 - N. T. Zinner5 - F.-K. Thielemann1
1 - Department of Physics, University of Basel, Klingelbergstr. 82,
4056 Basel, Switzerland
2 - Institute for Theoretical and Experimental Physics,
B. Cheremushkinskaya St. 25, 117259 Moscow, Russia
3 -
Russian Research Center Kurchatov Institute, pl. Kurchatova 1, Moscow 123182,
Russia
4 -
GSI Helmholtz Center for Heavy Ion Research, Planckstr. 1, 64291 Darmstadt,
Germany
5 -
Department of Physics, Harvard University, Cambridge, MA 02138, USA
Received 27 February 2009 / Accepted 12 January 2010
Abstract
Neutron-induced reaction rates, including fission and neutron
capture, are calculated in the temperature range
![]() within the framework of the statistical model
for targets with the atomic number
within the framework of the statistical model
for targets with the atomic number
![]() (from Po to Uuo) from the neutron to the proton drip-line. Four
sets of rates have been calculated, utilizing - where possible -
consistent nuclear data for neutron separation energies and fission
barriers from Thomas-Fermi (TF), Extended Thomas-Fermi plus
Strutinsky Integral (ETFSI), Finite-Range Droplet Model (FRDM) and
Hartree-Fock-Bogolyubov (HFB) predictions. Tables of calculated
values as well as analytic seven parameter fits in the standard
REACLIB format are supplied. We also discuss the sensitivity of
the rates to the input, aiming at a better understanding of the
variations introduced by the nuclear input.
(from Po to Uuo) from the neutron to the proton drip-line. Four
sets of rates have been calculated, utilizing - where possible -
consistent nuclear data for neutron separation energies and fission
barriers from Thomas-Fermi (TF), Extended Thomas-Fermi plus
Strutinsky Integral (ETFSI), Finite-Range Droplet Model (FRDM) and
Hartree-Fock-Bogolyubov (HFB) predictions. Tables of calculated
values as well as analytic seven parameter fits in the standard
REACLIB format are supplied. We also discuss the sensitivity of
the rates to the input, aiming at a better understanding of the
variations introduced by the nuclear input.
Key words: nuclear reactions, nucleosynthesis, abundances - supernovae: general - stars: neutron
1 Introduction
Investigations of nucleosynthesis processes make use of reaction networks including thousands of nuclei and tens of thousands of reactions. Most of these reactions occur far from stability and thus cannot yet be directly studied in the laboratory. In addition most of the nuclear properties including reaction rates, which are also required for the calculation of cross sections and astrophysical reaction rates, are not experimentally known either. Therefore, predictions based on theoretical models are necessary. While close to stability partial experimental information is available, relying fully on theoretical information leads to relatively large variations in computed cross sections far from stability. This is especially true for the region of fissionable nuclei, which is the focus of the present investigation.In the past, a series of efforts were applied to calculate neutron-capture rates for r-process nucleosynthesis and other astrophysical applications (e.g., Woosley et al. 1978; Rauscher & Thielemann 2000; Aikawa et al. 2005; Goriely et al. 2008; Holmes et al. 1976; Arnould 1972; Sargood 1982; Cowan et al. 1991; Thielemann et al. 1987, and references therein).
Fission has often been neglected in astrophysical calculations.
In early applications to astrophysical nucleosynthesis, usually only one mode was
considered,
beta-delayed fission (Thielemann et al. 1983) or a phenomenological model of spontaneous
fission (Freiburghaus et al. 1999; Cowan et al. 1999; Goriely & Clerbaux 1999).
However, it was shown recently that neutron-induced fission is more
important than beta-delayed fission in r-process nucleosynthesis
(Martínez-Pinedo et al. 2007; Panov & Thielemann 2003,2004). Thus, the need to provide a compilation of
neutron-induced fission rates is obvious. Initial investigations have
been undertaken by Panov et al. (2005) and Goriely et al. (2009). Here we
present extended calculations of neutron-induced fission rates for
different
predictions of masses and fission barriers.
The present work also completes existing
nuclear neutron-capture rate sets by extending the works of Rauscher & Thielemann (2000)
and Panov et al. (2005) to the region
![]() in order to provide the
necessary input for nucleosynthesis studies under high neutron densities.
As in Panov et al. (2005), the statistical model
approach of Wolfenstein-Hauser-Feshbach (Hauser & Feshbach 1952; Wolfenstein 1951) for compound nuclear
reactions was used, but employing more recent and complete data and predictions
for masses, spins, and fission barriers.
in order to provide the
necessary input for nucleosynthesis studies under high neutron densities.
As in Panov et al. (2005), the statistical model
approach of Wolfenstein-Hauser-Feshbach (Hauser & Feshbach 1952; Wolfenstein 1951) for compound nuclear
reactions was used, but employing more recent and complete data and predictions
for masses, spins, and fission barriers.
Nuclear mass and fission barrier predictions have a strong model dependence, and none of the existing models can reproduce all experimentally known data. Moreover, the fission process itself is complicated, and extended calculations for neutron-induced fission across the nuclear chart have to be done carefully. Here, we aim to provide rates for studying the endpoint of the r-process and the possible production of super-heavy elements. By comparing rates obtained with different choices of mass and fission barrier predictions we attempt to give a measure of the involved variations. Astrophysical models, providing the nucleosynthesis conditions, bear large variations in themselves. This is especially true for the r-process, for which the astrophysical site is still unknown despite decades of study. For a realistic and exhaustive exploration of synthesis conditions, simulations do not only have to vary astrophysical parameters, but also have to include a variation range of involved reaction rates given by different mass and fission barrier models.
Our paper is structured as follows. In Sect. 2 we briefly
describe
the statistical model used in the calculations as well as the nuclear
input data and give a comparison of cross sections or rates for a number of
experimentally known nuclei with existing experimental information and other
theoretical models.
These methods are then applied to supplement
the rate sets of Rauscher & Thielemann (2000) of
![]() -rates for chemical elements
with Z>83 and predict neutron-induced fission cross sections and rates (where
available in comparison to experiments). Section 3 presents these
results and shows the sensitivity with respect to mass models and fission
barriers employed. Rate fits for utilization in astrophysical calculations are
discussed in Sect. 4. In Sect. 5 we give a
brief discussion and some examples of the mass distribution of fission
fragments, which will be provided in an extended way in a forthcoming paper.
The final Sect. 6 contains conclusions and a summary. The
explanation of the tables and their structure are given in Appendix A.
The complete tables of reaction rates and their fits are found at CDS in
electronic form.
-rates for chemical elements
with Z>83 and predict neutron-induced fission cross sections and rates (where
available in comparison to experiments). Section 3 presents these
results and shows the sensitivity with respect to mass models and fission
barriers employed. Rate fits for utilization in astrophysical calculations are
discussed in Sect. 4. In Sect. 5 we give a
brief discussion and some examples of the mass distribution of fission
fragments, which will be provided in an extended way in a forthcoming paper.
The final Sect. 6 contains conclusions and a summary. The
explanation of the tables and their structure are given in Appendix A.
The complete tables of reaction rates and their fits are found at CDS in
electronic form.
![\begin{figure}
\par\mbox{\includegraphics[width=5.8cm,clip]{11967fg01a.eps}\hspa...
...udegraphics[width=5.7cm,clip]{11967fg01i.eps} }
\par\vspace*{5.5mm}
\end{figure}](/articles/aa/full_html/2010/05/aa11967-09/img19.png)
|
Figure 1:
Present predictions of energy-dependent (n,f) cross sections
|
| Open with DEXTER | |
2 The statistical model and nuclear data input
As in previous approaches (e.g., Rauscher & Thielemann 2000; Cowan et al. 1991; Thielemann et al. 1987)
we have applied the
statistical Wolfenstein-Hauser-Feshbach formalism (Hauser & Feshbach 1952; Wolfenstein 1951)
for the calculation of neutron-induced cross sections
and reaction rates. In addition to
![]() -reactions the
fission channel was also included as outlined in Thielemann et al. (1983,1989),
Cowan et al. (1991), Panov et al. (2005). The statistical model is applicable for
astrophysical rate calculations as long as there is a sufficiently high
density of excited states in the compound nucleus at the relevant
bombarding energy, which is the case for most heavy nuclei. However, at
shell closures and with decreasing neutron separation energies, level
densities at the astrophysically relevant compound formation energy in
neutron-induced reactions become too small for the application of the
model, as shown by Rauscher et al. (1997). In those cases, single resonances and
contributions from the direct reaction mechanism have to be taken into
account (Goriely & Khan 2002; Rauscher et al. 1998). This underlines on the one hand that
reliable mass predictions for the separation energies are absolutely
necessary for r-process applications far from stability, and on the
other hand that the prediction of spectroscopic properties for resonant
and direct capture awaits improvement as well. Here we calculate
neutron-induced rates still based purely on the statistical model
to provide a full set of rates for extended r-process
calculations and the possible formation of superheavy nuclei for a
variety of different sets of mass models and fission barrier
predictions. The influence of the direct reaction mechanism on the
rates far from stability needs to be explored separately in a future
study.
-reactions the
fission channel was also included as outlined in Thielemann et al. (1983,1989),
Cowan et al. (1991), Panov et al. (2005). The statistical model is applicable for
astrophysical rate calculations as long as there is a sufficiently high
density of excited states in the compound nucleus at the relevant
bombarding energy, which is the case for most heavy nuclei. However, at
shell closures and with decreasing neutron separation energies, level
densities at the astrophysically relevant compound formation energy in
neutron-induced reactions become too small for the application of the
model, as shown by Rauscher et al. (1997). In those cases, single resonances and
contributions from the direct reaction mechanism have to be taken into
account (Goriely & Khan 2002; Rauscher et al. 1998). This underlines on the one hand that
reliable mass predictions for the separation energies are absolutely
necessary for r-process applications far from stability, and on the
other hand that the prediction of spectroscopic properties for resonant
and direct capture awaits improvement as well. Here we calculate
neutron-induced rates still based purely on the statistical model
to provide a full set of rates for extended r-process
calculations and the possible formation of superheavy nuclei for a
variety of different sets of mass models and fission barrier
predictions. The influence of the direct reaction mechanism on the
rates far from stability needs to be explored separately in a future
study.
We outlined the general treatment within the statistical model for
applications, the cross section for a neutron-induced reaction
![]() (``out'' standing for gamma-emission or fission) from the
target ground state i0 with center of mass energy Ein and
reduced mass
(``out'' standing for gamma-emission or fission) from the
target ground state i0 with center of mass energy Ein and
reduced mass ![]() given by
given by

The total transmission coefficient
![\begin{figure}
\par\mbox{\includegraphics[width=7.5cm,clip]{11967fg02a.eps} \hsp...
...ncludegraphics[width=7.5cm,clip]{11967fg02b.eps} }
\vspace*{-2mm}
\end{figure}](/articles/aa/full_html/2010/05/aa11967-09/img30.png)
|
Figure 2:
Comparison of
|
| Open with DEXTER | |
![\begin{figure}
\par\mbox{\includegraphics[width=7.5cm,clip]{11967fg03a.eps}\hspa...
...includegraphics[width=7.5cm,clip]{11967fg03b.eps} }
\vspace*{-2mm}
\end{figure}](/articles/aa/full_html/2010/05/aa11967-09/img31.png)
|
Figure 3: Comparison of (n,f)-rates (integrated over Maxwell-Boltzmann distributions of targets and projectiles for the displayed temperatures) from present calculations and other existing predictions for the target nuclei 238U ( left) and 242Pu ( right) with the experiment. The symbols are chosen as follows: Goriely et al. (2009) (green two-dot-dash line), JENDL-3.3 (Nakagawa et al. 2005) (crosses). Our calculations are shown for reaction rates including only the ground state (GS) or a thermally populated target (GS+tps) for different nuclear data predictions (HFB or ETFSI). The results of Goriely et al. (2009) correspond to GS + tps conditions. |
| Open with DEXTER | |
In Fig. 1 we compare our predictions for neutron-induced fission cross sections of some U, Np and Pu isotopes with evaluated neutron data from JENDL-3.3 (Soppera et al. 2008; Nakagawa et al. 2005). (The accuracy of the evaluated data is usually not declared. In the region of interest, 0.01<T9< MeV, the accuracy of up-to-date measurements for plutonium isotopes by Tovesson et al. 2009 varies from 2% to 15%, and for our plots is not bigger than the plot signs. The detailed experimental information can be found in the experimental nuclear reaction data library 2009.) Experimental masses and fission barriers or masses and fission barriers were employed from different mass models: ETFSI (Aboussir et al. 1995; Mamdouh et al. 1998), TF (Myers & Swiatecki 1996,1999), HFB-14 (Goriely et al. 2009) and the older liquid drop predictions by Howard & Möller (1980), here shown as Panov et al. 2005). It can be seen that when using experimental fission barriers, the agreement with experimental (n,f) cross sections is within the typical factor of two to three known for statistical model calculations. It can also be seen that different barrier predictions can lead to large variations, which will clearly remain for predictions far from stability where no experimental information is available. These results can also be compared to a recent investigation by the Reference Input Parameter Library (RIPL) community (Goriely et al. 2009), making use of the code TALYS and HFB-14 fission barriers plus nuclear level densities obtained from a combinatorial approach based on single particle spectra from the corresponding Hartree-Fock-Bogolyubov calculations. The fission barriers in (Goriely et al. 2009) were employed following the fission path via a Wentzel-Kramers-Brillouin phase integral, which should be superior to a Hill-Wheeler inverted parabola treatment. When examining their Fig. 8, which is based on pure predictions, it can be recognized that our results with HFB-14 fission barriers employed via a double-humped fission barrier approach are similar or even closer to the experiment than the results given therein. As we make use of the same barriers, we relate the difference mainly to the different level density predictions (here a back-shifted Fermi gas with parameters obtained from a global mass model, there a combinatorial approach to single particle spectra from a microscopic HFB mass model). We draw the same conclusions from the comparison with their Fig. 9 and our calculations with experimental barriers. While microscopic investigations should be in principle more advanced, the back-shifted Fermi gas approach based on global mass models seems still more robust in its predictive power. While renormalizations of fission paths and level densities can improve this picture (see their Figs. 10-12), this is only possible if experimental data are available. As our investigations are meant for astrophysical applications far from stability, where no experimental information is available, we come to the conclusion that our approach is well suited for this endeavor. It does, however, depend on the quality of mass and fission barrier predictions, and this will be the focus of the present work.
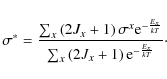
In astrophysical plasmas, reactions also occur on thermally excited
target states. The stellar cross section ![]() can then be defined
as a sum of the cross sections
can then be defined
as a sum of the cross sections ![]() for those excited states xwith excitation energy Ex and spin Jx, weighted by the Boltzmann
excitation probability
for those excited states xwith excitation energy Ex and spin Jx, weighted by the Boltzmann
excitation probability
![\begin{figure}
\par\mbox{\includegraphics[width=7.5cm,clip]{11967fg04a.eps} \hspace{1.cm} \includegraphics[width=7.5cm,clip]{11967fg04b.eps} }
\par
\end{figure}](/articles/aa/full_html/2010/05/aa11967-09/img35.png)
|
Figure 4: Contour plot of the quantity Bf-Sn (in MeV) for two choices of models for masses and fission barriers: FRDM masses plus TF fission barriers ( left) and ETFSI-predictions ( right). Also indicated are known superheavy nuclei (boxes) and the drip-line (line), where Bf-Sn determines whether the r-process continues towards heavier nuclei or fission cycling to lighter fission products occurs. |
| Open with DEXTER | |
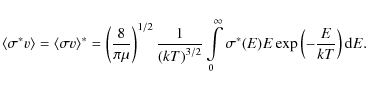
The ![]() were calculated in the same way as shown in Eq. (1) for the ground state, i.e. for x=0. Only the
stellar cross sections can be used to compute the appropriate
astrophysical reaction rates. The reaction rate for a specific
reaction at a given stellar temperature T was then determined
by folding the stellar reaction cross section
were calculated in the same way as shown in Eq. (1) for the ground state, i.e. for x=0. Only the
stellar cross sections can be used to compute the appropriate
astrophysical reaction rates. The reaction rate for a specific
reaction at a given stellar temperature T was then determined
by folding the stellar reaction cross section ![]() *(E) with a Maxwell-Boltzmann distribution of relative
velocities between projectiles and targets (Fowler 1974):
*(E) with a Maxwell-Boltzmann distribution of relative
velocities between projectiles and targets (Fowler 1974):
Figures 2 and 3 show a typical comparison of present neutron capture rate calculations of 238U and 242Pu to experimentally based rates from JENDL-3.3 (Nakagawa et al. 2005) and the predictions of Aikawa et al. (2005); Goriely et al. (2008,2009). The agreement between rate predictions and data for other nuclei in this mass range are of the same order. Note that these predictions along the valley of stability are based on experimental masses, which leads to an average agreement with experimental cross sections within a factor of 1.5. The expected variation will be larger far from stability where theoretical mass and barrier predictions have to be utilized.
3 Neutron-induced fission rates for a variety of mass models
Early r-process calculations (Thielemann et al. 1983), which included fission, made use of the mass predictions by Hilf et al. (1976) and the fission barriers of a macroscopic-microscopic model by Howard & Möller (1980). For many years different authors used the fission barriers from Howard & Möller (1980), as they were the only complete set of barriers available. More recently, renewed interest (and increased computing power) spurred a number of new calculations of large sets of barrier predictions within various models, resulting on ``average'' in higher values of fission barriers than predicted by Howard & Möller (1980). For a consistent treatment of nucleosynthesis, fission rates should be calculated with the neutron separation energies, reaction Q-values and fission barrier heights derived from the same mass model (see the discussion in Rauscher et al. 1994; Cowan et al. 1991).
As explained in Sect. 2, different mass- and fission barrier predictions were utilized to test the sensitivity stemming from different underlying models. The models used are: masses taken from the Finite Range Droplet Model (FRDM) by Möller et al. (1995), the Extended Thomas-Fermi with Strutinsky Integral (ETFSI) model by Aboussir et al. (1995), and the Thomas-Fermi (TF) model of Myers & Swiatecki (1996); fission barriers are taken from the ETFSI (Mamdouh et al. 2001) and TF (Myers & Swiatecki 1999) models. It should be emphasized that the ETFSI masses employed here (http://www-astro.ulb.ac.be/Nucdata/Masses/etfsi2-plain) are based on the force SkSC18 (Goriely 2000), while the ETFSI fission barriers (http://www-astro.ulb.ac.be/Nucdata/Fisbar/fisbar1) were obtained with the force SkSC4 (Mamdouh et al. 1998). Thus, it is difficult to perform fully consistent calculations, and the quality of barrier heights is not really known especially in the region far from experimentally known nuclei, where the r-process proceeds. For this reason the choice of two different sets of fission barriers, TF and the ETFSI, permits to test the sensitivity range. When utilized together with mass predictions from the same models (see however the remarks in the previous paragraph), a reasonably consistent treatment is possible. In addition, we also chose to explore a combination of TF fission barriers and FRDM nuclear mass predictions and to gauge the resulting effect. The latter are close to the TF predictions, containing also the same shell corrections (Myers & Swiatecki 1996) and have already been used in some astrophysical rate calculations for nuclei with Z<84.
Figure 4 shows the quantity of primary importance, Bf-Sn, for the calculation of neutron-induced fission cross sections, based on the two model sets FRDM+TF and ETFSI. Bf-Sn indicates the regions of nuclei where neutron induced fission rates can be high enough (Bf-Sn<0) and are important for the r-process nucleosynthesis (see also the discussion of Fig. 6). We see that both sets display a quite different behavior and note that Bf-Sn is generally larger for ETFSI than FRDM+TF.
![\begin{figure}
\par\mbox{\includegraphics[width=5.9cm,clip]{11967fg05a.eps} \hsp...
...ace{0.2cm}\includegraphics[width=5.9cm,clip]{11967fg05c.eps} }
\par
\end{figure}](/articles/aa/full_html/2010/05/aa11967-09/img38.png)
|
Figure 5: Calculated maxwellian averaged neutron-induced fission cross sections in comparison to evaluated experimental fission cross sections at 30 keV. Left panel: experimental fission barriers were utilized in the calculations (circles) of maxwellian averaged cross-sections in comparison to experimental values for 58 isotopes from Th to Fm taken from JENDL-3.3 (Nakagawa et al. 2005); central panel: the same ratio of calculated and evaluated experimental values, but employing theoretical fission barrier predictions from different sources: the Extended Thomas-Fermi model by Mamdouh et al. (2001) (diamonds), the Thomas-Fermi by Myers & Swiatecki (1999) (squares), and recent predictions from Möller et al. (2009) (green triangles up). When not experimentally known, consistent nuclear masses were utilized from the corresponding model predictions. Right panel: comparison of maxwellian averaged cross-sections from our calculations (triangles) and from the Talys (Goriely et al. 2009) calculations (crosses), both utilizing HFB predictions (with BSk14 Skyrme force) of masses and fission barriers. |
| Open with DEXTER | |
Table 1: Neutron separation energy Sn and fission barrier predictions for nucleus 262U formed after neutron capture by 261U.
Our fission cross section calculations were performed within
the framework of a double-hump fission barrier (permitting the
existence of a double or single hump barrier). The
heights of both barriers f were predicted in the calculations of
Howard & Möller (1980) (HM) and Mamdouh et al. (2001). However, the TF model predicts
only one of the fission barriers. In order to employ
this model in our calculations we assumed that the predicted
fission barrier is the higher of both barriers and
derived the lower one as described below and in Panov et al. (2005).
In order to derive the height of the lower barrier, we compared two
methods: (i) keeping the difference in height of the first and second
barrier
of the original HM barriers and (ii) keeping the same height ratio,
i.e. relative height, of the barriers. The resulting cross sections
were not
very different because the heights of the lower barriers calculated in
these
two ways differ only by a few percent for the majority of cases. Only
in a
small number of cases the cross sections differ by more than 10% (but
the
largest deviations do not exceed a factor of two). For the rates shown
here we
chose to use the difference in height of the first and second barrier
of HM to
predict the lower barrier for the TF approach. In this manner, the new
fission
rate calculations were extended to the region above charge Z = 100, whereas
Howard & Möller (1980) presented results only for ![]() .
This allows us to
perform r-process calculations in extremely neutron-rich environments as well
as to study superheavy element production in rapid neutron capture
nucleosynthesis processes.
.
This allows us to
perform r-process calculations in extremely neutron-rich environments as well
as to study superheavy element production in rapid neutron capture
nucleosynthesis processes.
An extended comparison to evaluated neutron-induced fission cross sections, based on evaluated data (Nakagawa et al. 2005) for the trans-lead region is shown in Fig. 5. The left panel displays the ratio of predicted to evaluated cross section when using experimentally known fission barriers (circles). The agreement of the calculated rates based on the experimental values of fission barriers is quite good with the majority of ratios, and is within factors of two to three. Some outliers of up to a factor of ten are observed in a few cases, but the experimental accuracy of the barrier determination is not known for these cases. The middle panel shows the difference between the calculated ones when the HFB mass and fission barrier predictions were used: in this work (triangles down) and by Talys (crosses). Existing difference in two Hauser-Feshbach calculations can have emerged from the differences in fission barriers values (due to renormalization by Goriely et al. 2009), different level density used etc. In the right panel of Fig. 5 the calculated cross sections made use of mass and fission barrier predictions from TF and ETFSI as well as new predictions by Möller et al. (2009).
Contrary to the comparison with the left panel (circles), when using only experimental barriers we found that the difference between calculated cross sections and measured ones can be many orders of magnitude (up to a factor 104). It is interesting to note that a weak systematic can be seen. Cross sections calculated with ETFSI as well as HFB fission barrier predictions show a large scatter above and below the measured values for the lighter end of the plotted mass range, whereas they tend to underpredict the fission cross sections for heavy masses. The calculations using the recent barriers by Möller et al. (2009) seem to show a similar behavior with a smaller scatter, but they are currently available only for a more limited number of nuclei. The results obtained with the TF barriers exhibit a different pattern, the predicted cross sections agree well for the lighter mass nuclei, but seem to be systematically too large for the heavier ones.
The above comparison underlines the considerable variations still inherent in fission barrier predictions. However, we suggest that by comparing TF with ETFSI (and with Möller et al. 2009) predictions, the relevant variation range can be estimated. Theoretical cross sections depend strongly on the fission barriers, and a high accuracy for their values is required. Because of the impact of the fission barrier uncertainties, nucleosynthesis studies at present should explore a variety of barrier sets, while waiting for further measurements and improved predictions. For this reason we compute and compare below rates for different sets of nuclear properties and also provide tables and fits of the rates for all these cases.
Figure 6 shows fission cross sections (left panel) and
rates (right panel) calculated by combining different sets for predictions
of masses and fission barriers. The arrows in the left plot show the
difference between the fission barrier height and the neutron
separation energy Bf-Sn given by predictions of the TF model (red
arrow at the top of the left panel) and the ETFSI model (dashed arrow
at the bottom). The exact values can be found in Table 1.
The cross sections (and thus the rates) depend essentially on the
available energy Bf-Sn in the fission channel, minor dependencies
on fission barriers heights and neutron separation energies, individually,
are due to the competition with the
![]() -channel.
-channel.
![\begin{figure}
\par\mbox{\includegraphics[width=6.5cm,clip]{11967fg06a.eps} \hspace{1.5cm} \includegraphics[width=6.5cm,clip]{11967fg06b.eps} }
\par
\end{figure}](/articles/aa/full_html/2010/05/aa11967-09/img44.png)
|
Figure 6:
Dependence of neutron-induced fission cross sections
|
| Open with DEXTER | |
![\begin{figure}
\par\mbox{\includegraphics[width=6.8cm,clip]{11967fg07a.eps} \hspace{2cm} \includegraphics[width=6.8cm,clip]{11967fg07b.eps} }
\par %
\end{figure}](/articles/aa/full_html/2010/05/aa11967-09/img46.png)
|
Figure 7:
Ratio
|
| Open with DEXTER | |
It can be seen from Fig. 6 that the neutron-induced fission
cross sections (as well as the rates) increase with decreasing
fission barriers and that
![]() .
The difference at low energies is due to the different mass
predictions used (comparing calculations with TF fission barriers
but different neutron separation energies
.
The difference at low energies is due to the different mass
predictions used (comparing calculations with TF fission barriers
but different neutron separation energies ![]() ). The small
decrease in
). The small
decrease in
![]() ,
when predictions for masses and fission barriers (based on
the two sets of input data) are changed from TF+TF to FRDM+TF,
results in a decrease of the neutron-induced fission cross sections
(accompanied by decreasing
,
when predictions for masses and fission barriers (based on
the two sets of input data) are changed from TF+TF to FRDM+TF,
results in a decrease of the neutron-induced fission cross sections
(accompanied by decreasing
![]() -cross sections). The same
influence is illustrated by the cases where sets of consistent
determinations for Sn and Bf are replaced by sets from different mass
predictions.
For example, different predictions of neutron separation energies
were used for the same TF - fission barrier predictions.
Therefore, cross sections for low energies differ significantly,
but for higher E the difference in cross section becomes much smaller for the
same fission barriers (here we used TF barriers).
The temperature averaged rates (Fig. 6, right panel) show the same
dependence.
-cross sections). The same
influence is illustrated by the cases where sets of consistent
determinations for Sn and Bf are replaced by sets from different mass
predictions.
For example, different predictions of neutron separation energies
were used for the same TF - fission barrier predictions.
Therefore, cross sections for low energies differ significantly,
but for higher E the difference in cross section becomes much smaller for the
same fission barriers (here we used TF barriers).
The temperature averaged rates (Fig. 6, right panel) show the same
dependence.
As expected, the rate sets calculated on the basis of FRDM masses and the TF
model for masses and fission barriers are quite comparable (Fig. 7). On the other hand, when the sets include ETFSI vs. FRDM+TF or
TF comparisons, the results can differ by up to eight orders of
magnitude. The most extreme difference of ETFSI-based and other rates was
obtained for nuclei with neutron numbers close to 184, for which the ETFSI
model predicts very high fission barriers, leading to small fission rates. The
difference between rates, calculated on the basis of ETFSI and HFB mass and
fission barriers predictions is less than between ETFSI and TF, especially for
higher T9. For smaller T9 the we can see that difference of rate values
has the opposite sign for regions with
![]() and A>280. This
agrees with Fig. 5. Some of the combinations
employed in Fig. 7 are shown to underline the huge problems
which can arise when not using consistent data. The extrapolation of rate
calculations to regions of very exotic nuclei is a hard task, and only further
investigations can answer which kind of prediction is more preferable. At the
moment the only choice is to test all available predictions in r-process
calculations that are compared to astronomical abundance observations.
and A>280. This
agrees with Fig. 5. Some of the combinations
employed in Fig. 7 are shown to underline the huge problems
which can arise when not using consistent data. The extrapolation of rate
calculations to regions of very exotic nuclei is a hard task, and only further
investigations can answer which kind of prediction is more preferable. At the
moment the only choice is to test all available predictions in r-process
calculations that are compared to astronomical abundance observations.
Table 2:
Ranges of isotopes for which we calculated rates based on input
from the models TF, FRDM, ETFSI and HFB. Given are the charge number ![]() and the lower and upper limits
and the lower and upper limits
![]() and
and
![]() of the neutron number of the
targets in the isotopic chain.
of the neutron number of the
targets in the isotopic chain.
4 Computed rate sets and mass ranges
As we discussed in the introduction, our aim was to prepare sets of
neutron-induced reaction rates, suited for calculations of the r-process up to
very high atomic masses. In this sense, our rates extend the previously
published ones for Z<84 (Rauscher & Thielemann 2001) up to the region
![]() (
(
![]() depends on available nuclear input and varies from
102
for HFB-predictions to 118 for FRDM data). The exact
range of nuclei for the different choices of mass and fission barrier
input is given in Table 2.
depends on available nuclear input and varies from
102
for HFB-predictions to 118 for FRDM data). The exact
range of nuclei for the different choices of mass and fission barrier
input is given in Table 2.
Our calculations include all outgoing channels and give simultaneously
predictions for neutron-induced fission, (n,![]() )-, (n,p)-, and
(n,
)-, (n,p)-, and
(n,![]() )
rates. However, here we only provide tables and fits for the
neutron-induced fission and neutron capture rates. Due to their small values
for neutron-rich nuclei, the rates of the other calculated reaction types are
not important in astrophysical applications.
)
rates. However, here we only provide tables and fits for the
neutron-induced fission and neutron capture rates. Due to their small values
for neutron-rich nuclei, the rates of the other calculated reaction types are
not important in astrophysical applications.
The format of the tables is explained in Appendix A. The full electronic versions of the tables available on-line at the CDS include all rates for all mass predictions (Tables 3-6). The isotope and element ranges for which rates as well as rate fits are available are given in Table 2 for the FRDM, TF, ETFSI and HFB mass predictions. This amounts to 2151 (ETFSI), 2637 (TF), 2400 (FRDM-masses, TF-barriers) and 1323 (HFB) involved nuclei. The partition functions for all isotopes are given on a grid of 24 temperatures: T9 = 0.1, 0.15, 0.2, 0.3, 0.4, 0.5, 0.6, 0.7, 0.8, 0.9, 1.0, 1.5, 2.0, 2.5, 3.0, 3.5, 4.0, 4.5, 5.0, 6.0, 7.0, 8.0, 9.0, 10.0 and can be found in CDS's Tables 3-6 as well. We also provide the fit coefficient needed to compute the photodisintegration rate (see Sect. 4.1 ).
![\begin{figure}
\hspace*{1.5cm}%
\par\mbox{\includegraphics[width=7.3cm,clip]{11...
...cludegraphics[width=7.3cm,clip]{11967fg08b.eps} }
\par\vspace*{2mm}
\end{figure}](/articles/aa/full_html/2010/05/aa11967-09/img56.png)
|
Figure 8: Representative fits of neutron-induced fission rates (273Cf and 291Cm) for two types of temperature dependences. The general aim is to attain sufficient accuracy with one set of seven fitting coefficients (see Eq. (4)), as shown in the left curve. In some cases the superposition of two such sets is necessary ( right panel) to correctly reproduce the low- as well as high-temperature behavior. A correct extrapolation to low temperatures ( 0.01 < T9 < 0.1) is important to avoid unphysical abundance changes (see also the explanation of tables). |
| Open with DEXTER | |
![\begin{figure}
\par\mbox{\includegraphics[width=7.3cm,clip]{11967fg09a.eps}\hspa...
...\includegraphics[width=7.3cm,clip]{11967fg09b.eps} }
\vspace*{2mm}
\end{figure}](/articles/aa/full_html/2010/05/aa11967-09/img57.png)
|
Figure 9:
The accuracy of fits is defined by a mean-square error
(see Eq. (5)), shown here for
|
| Open with DEXTER | |
4.1 The fits for neutron-induced and reverse rates
Reaction rates have been calculated on a grid of 24 temperatures: T9 = 0.1, 0.15, 0.2, 0.3, 0.4, 0.5, 0.6, 0.7, 0.8, 0.9, 1.0, 1.5, 2.0, 2.5, 3.0, 3.5, 4.0, 4.5, 5.0, 6.0, 7.0, 8.0, 9.0, 10.0, same as for partition functions. These rates include the thermal modification in the stellar plasma, i.e. consider reactions from excited states in the target. For easy application in astrophysical investigations, these stellar rates were fitted with the same REACLIB parameterization as used for other reaction types earlier (Rauscher & Thielemann 2000):with the seven open parameters a0-a6 and the stellar temperature T9 given in 109 K. This parameterization proved to be flexible enough to accommodate the different temperature dependencies of the various reaction types across the fitted temperature range of
The flexibility of the fitting function makes it prone to numerical
problems outside the calculated range at low temperatures. In some
cases they tend to diverge strongly. This difficulty can be avoided by
additionally providing fit data at low temperatures to the calculated
values by appropriately extrapolating the rates to lower temperatures.
However, it has to be emphasized that the considered parameterization
is only valid within the temperature range of
![]() ,
although many fits will show a ``proper'' behavior down to
lower temperature.
,
although many fits will show a ``proper'' behavior down to
lower temperature.
As a measure of the accuracy of a given fit, the quantity ![]() (marked in tables and figures as Dev) is used. It is
defined by
(marked in tables and figures as Dev) is used. It is
defined by
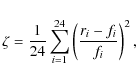
with r being the original rate value as calculated at each of the 24 temperatures T9 = 0.1, 0.15 ...10.0, and fi is the rate calculated from the fit at these temperatures. A small value of
The temperature dependence of the rate can be one of two
types, as illustrated in Fig. 8.
These types of behavior can be understood when one recalls
the discussion of Fig. 6. A fission transmission
coefficient which is constant or slowly varying as a function of energy
leads to an (n,f)-cross section which (similar to a pure neutron
capture) shows a
![]() dependence, if s-wave dominated.
Averaging such a cross section over a Maxwell-Boltzmann distribution
yields a constant rate. This situation occurs for
example when the neutron bombarding energy leads to a compound nucleus
energy above the lower and below the higher barrier of a double-hump
fission barrier. Then the lower barrier is open and the penetration
through the remaining higher barrier is close to constant, but the
height of the higher barrier determines the size of the (n,f) cross
section. This behavior is seen in Fig. 6 below about 0.1 MeV (left
panel). In the right panel the corresponding rate is
shown and seen to be close to constant below about T9=1.
dependence, if s-wave dominated.
Averaging such a cross section over a Maxwell-Boltzmann distribution
yields a constant rate. This situation occurs for
example when the neutron bombarding energy leads to a compound nucleus
energy above the lower and below the higher barrier of a double-hump
fission barrier. Then the lower barrier is open and the penetration
through the remaining higher barrier is close to constant, but the
height of the higher barrier determines the size of the (n,f) cross
section. This behavior is seen in Fig. 6 below about 0.1 MeV (left
panel). In the right panel the corresponding rate is
shown and seen to be close to constant below about T9=1.
In contrast, the opening of a fission barrier as a function of energy, i.e. an exponentially increasing transmission coefficient close to the barrier energy, leads to a sudden rise of the cross section, and consequently also of the rate as a function of temperature. We see this behavior for bombarding energies on the order of Bf-Sn in the left panel of Fig. 6 and a similar behavior for the rates in the right panel. The size of this change from an almost constant to a steeply rising rate is a function of the barrier height. The right panel of Fig. 8 is a very representative example of such a case (almost constant rate at low temperatures and a steep rise by orders of magnitude at a critical temperature). On the other hand, when the compound energy is close to the barrier height already for small bombarding energies, the cross section and rate are already large at small energies (temperatures). Such an example can be seen in the left panel of Fig. 8, reflecting a double-hump behavior with small energy differences between the lower and higher barrier. For a discontinuity in the T9-dependence (right panel), the fit was performed as a sum of two contributions and is given by two lines in the Table A.2 of the paper and CDS's Tables 7-18.
For all cases it is recommended to use the fits only down to the
temperature
![]() .
Moreover, close to the drip-line, the
statistical model may not be applicable for reactions with low Qvalue, even above that temperature. Although the fit may be good, the
user should be aware of that possible complication.
.
Moreover, close to the drip-line, the
statistical model may not be applicable for reactions with low Qvalue, even above that temperature. Although the fit may be good, the
user should be aware of that possible complication.
4.2 Photodisintegration rates and partition functions
For a full implementation of the neutron captures in a reaction network, the
inverse photodisintegration rates also have to be known. The
photodisintegration rates (and their fits) are not explicitly given in the
tables, but can be computed from the information contained therein. To calculate
the reverse rate of the reaction B(n,![]() )D, i.e. the reaction
D(
)D, i.e. the reaction
D(![]() ,n)B, the seven parameters
,n)B, the seven parameters
![]() are determined as follows:
are determined as follows:
with
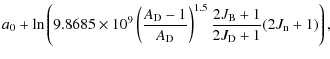
It is important to note that the value computed by applying Eq. (4) with the above coefficients has to be multiplied by the
ratio of the partition functions for the residual and target nucleus
![]() to obtain the actual photodisintegration
rate. Examples are shown in
Appendix A. As it was shown in detail earlier
(Rauscher & Thielemann 2000), the temperature-dependent partition function G(T*) normalized to the ground state spin J0 of a nucleus
is defined as in Fowler et al. (1967)
to obtain the actual photodisintegration
rate. Examples are shown in
Appendix A. As it was shown in detail earlier
(Rauscher & Thielemann 2000), the temperature-dependent partition function G(T*) normalized to the ground state spin J0 of a nucleus
is defined as in Fowler et al. (1967)
| (2J0+1)G(T*) | = | 
|
|
|
(7) |
with
This subsection discussed photo-induced reaction rates as inverse reactions of neutron capture rates, which are presented in full detail in the present publication. Photo-induced reactions can also lead to fission when the Planck distribution of photons provides a significant fraction of photons with energies above the fission barrier. This reaction channel is not discussed here but its possible influence in r-process environments will be analyzed in a future investigation.
5 Fission fragment distributions
A proper inclusion of fission in r-process calculations also requires the knowledge of the resulting distribution of fission fragments, which have to be entered as reaction products. This by itself requires a major effort and will be presented with a thorough description of the treatment plus detailed fission yield distributions in a forthcoming paper. However, at the end of the present investigation we want to give a short outlook on how this topic will be approached.
In principle, such distributions are dependent on the excitation energy of the compound nucleus and thus would lead to a changing yield distribution for each bombarding energy. However, we found that the distributions vary smoothly and slowly as a function of the excitation energy. Thus, for the neutron energy range in astrophysical applications, the yield distribution at the neutron separation energy (i.e., for a vanishing neutron bombarding energy) is a very good approximation. This would permit us to multiply the fitted (n,f)-rates from the previous section with a static distribution of yields for all temperatures.
Here we only briefly show a few examples of such fission distributions. Properties of fission fragments, i.e., masses, atomic numbers, excitation and kinetic energies, were calculated based on the macro-microscopic approach (similar to the FRDM model) and the separability of compound-nucleus and fragment properties on the fission path (Wilkins et al. 1976; Schmidt et al. 2008). The original technical description of the fragment-formation model was published in Benlliure et al. (1998) and Kruglov et al. (2002). In the calculations shown here we used an updated description that will be the subject of a forthcoming publication.
In the model it is assumed that the different ways of splitting up the total
mass are basically determined by the number of available transition states
above the potential energy surface behind the outer saddle point. The
macroscopic properties of the potential-energy landscape of the fissioning
system are attributed to the strongly deformed fissioning system, which are
deduced from mass distributions at high excitation energies (Rusanov 1997)
and Langevin calculations (Nadtochy et al. 2005). The microscopic properties of the
potential-energy landscape of the fissioning system are given by the
qualitative features of the shell structure in the nascent fragments. They are
determined from the observed features of the fission channels (Brosa et al. 1990)
according to the procedure described by Schmidt et al. (2008). The dynamics of the
fission process responsible for the fragment formation was considered in an
approximate way: it was assumed that the phase space near the outer saddle
point determines the mass asymmetry of the system, which is more or less frozen
during the descent to scission. On the other hand, it was also assumed that the
N/Z collective degree of freedom is determined near the scission point. The
excitation energies of the created fragments were calculated from the available
excitation energy at the scission point and the deformation energies of the
fragments at scission. The deformation energies of the fragments were assumed
to be specific to the individual fission channels. They were deduced from
experimental data (Wahl 1988; Böckstiegel et al. 2008, and references therein)
on total kinetic energies and neutron yields. Kinetic energies were then
calculated applying the energy conservation law. Finally, the two excited
fission fragments are subject to particle (mostly neutrons) and ![]() ray
emission until they reach their ground state configurations. The de-excitation
process was described in the framework of the statistical model as described in
Kelic et al. (2008).
ray
emission until they reach their ground state configurations. The de-excitation
process was described in the framework of the statistical model as described in
Kelic et al. (2008).
![\begin{figure}
\par\mbox{\includegraphics[width=6.5cm]{11967fg10a.eps}\hspace*{1...
...1mm}
\includegraphics[width=5.8cm]{11967fg10c.eps} }
\vspace*{2mm}
\end{figure}](/articles/aa/full_html/2010/05/aa11967-09/img83.png)
|
Figure 10: The final mass distributions of fission fragments for the compound nuclei (after neutron capture) 238U, 282Cm and 292Cf. The distributions were computed with the ABLA code (Kelic et al. 2008) as described in the text. In addition, we show the yields computed with the phenomenological parameterizations of Panov et al. (2008) and Kodama & Takahashi (1975), as well as experimental data (crosses). |
| Open with DEXTER | |
The left panel of Fig. 10 compares the mass distributions resulting from such an approach with the experimental data for 238U (Nagy et al. 1978). We also show the yields computed using the empirical parameterizations developed by Panov et al. (2008) and Kodama & Takahashi (1975), which previously were used in r-process calculations. In order to give an impression of the impact of the results for r-process nuclei, the two right panels of Fig. 10 show the mass distributions resulting from the fission of 282Cm and 292Cf. For these nuclei, clear differences appear between the phenomenological approaches (Kodama & Takahashi 1975; Panov et al. 2008) and the macroscopic-microscopic approach described above. For application in r-process simulations the (n,f)-reaction rates (which are the focus of the present paper) will have to be multiplied by the displayed percentages for obtaining a production rate of a specific fragment nucleus (Martínez-Pinedo et al. 2007; Panov et al. 2008; Kelic et al. 2005).
6 Summary and conclusions
We provide predictions of neutron-induced fission rates and
![]() -rates for a wide range of astrophysical temperatures
(
-rates for a wide range of astrophysical temperatures
(
![]() )
and targets (proton- to
neutron- drip-line for
)
and targets (proton- to
neutron- drip-line for
![]() ,
i.e. from Po to Uuo )
in the framework of the Wolfenstein-Hauser-Feshbach model, making
use of a variety of different mass and fission barrier predictions
(Aboussir et al. 1995; Mamdouh et al. 2001; Howard & Möller 1980; Goriely et al. 2009; Möller et al. 1995; Myers & Swiatecki 1999). The astrophysical
(stellar) reaction rates were fitted as in previous works
(Rauscher & Thielemann 2000; Thielemann et al. 1987) in the common REACLIB seven parameter form,
and these parameters are also tabulated. This provides the basis for
r-process nucleosynthesis calculations where the abundance
predictions for the highest mass numbers as well as the effect of
fission cycling are strongly dependent on the interplay of neutron
capture and fission.
,
i.e. from Po to Uuo )
in the framework of the Wolfenstein-Hauser-Feshbach model, making
use of a variety of different mass and fission barrier predictions
(Aboussir et al. 1995; Mamdouh et al. 2001; Howard & Möller 1980; Goriely et al. 2009; Möller et al. 1995; Myers & Swiatecki 1999). The astrophysical
(stellar) reaction rates were fitted as in previous works
(Rauscher & Thielemann 2000; Thielemann et al. 1987) in the common REACLIB seven parameter form,
and these parameters are also tabulated. This provides the basis for
r-process nucleosynthesis calculations where the abundance
predictions for the highest mass numbers as well as the effect of
fission cycling are strongly dependent on the interplay of neutron
capture and fission.
In order to give an impression of the reliability of the results, we compared them with experiment and with available independent predictions before exploring the currently unreachable regions of the nuclear chart with a variety of theoretical predictions for nuclear masses and fission barriers (FRDM, ETFSI, TF, HFB). An extended comparison of neutron-induced fission rates with experiment and with available independent predictions was done. The dependence of rates on nuclear input data, most of all fission barriers, is high. Astrophysical nucleosynthesis yield predictions, especially in the transuranium region, should take into account these large differences in order to explore the variations involved. For this reason extended tables for neutron-induced fission rates as well neutron capture rates are presented for different mass and fission barrier predictions in fitted form for nucleosynthesis calculations. Their structure is given in the Appendix A (note that the full rate and fit tables are available at the CDS). Given that fission predictions far from stability have not been tested yet, and even close to stability none of the existing models has yet been proven to be superior (see Fig. 3). Nucleosynthesis calculations should probably continue to use a variety of these models. A further requirement for nucleosynthesis modeling in the region of fissioning nuclei is the knowledge of the mass distribution of fission products. This work is in progress (see Sect. 5).
AcknowledgementsThe authors thank E. Kolbe, K.-L. Kratz, K. Langanke, P. Möller, D. K. Nadyozhin, and B. Pfeiffer for useful discussions. This work was supported by the Swiss National Science Foundation (SCOPES projects No. IB7320-110996 and No. IZ73Z0-128180/1) and grant 2000-105328. I.P. and I.K. were partly supported by Federal Programm ``Scientific and pedagogical specialists of innovation Russia'', contract number 02.740.11.0250 and RFBR-grant 09-02-12168-ofi_m.
Appendix A: Explanation of the tables and examples of how to use them
Table A.1:
Example of format of rates presented in the Tables 3-6, available at the CDS: reaction rates
![]() and partition functions show a subset of calculation based on ETFSI
predictions.
and partition functions show a subset of calculation based on ETFSI
predictions.
Table A.2:
Parameterization of the (![]() )-,
)-,
![]() -
and (n,f)-rates, available at the CDS Tables 6-18.
-
and (n,f)-rates, available at the CDS Tables 6-18.
This section is intended to help with interpreting the information given in the electronic tables. We also give examples for calculating the reaction rate for a given reaction and its inverse reaction.
Table A.1 shows which information is contained in the rate
Tables 3-6 for different mass predictions, available at the CDS (Table A.1 illustrated some lines from CDS Table 3: rates on the basis of
ETFSI-predictions).
The organization of Tables 3-6 with calculated rates for 24 different
values of T9 is extremely simple - all data are in eight columns. The columns
give, in this order, the target element, the atomic mass number A of the
target, the temperature in T9, the partition function of the target,
the neutron-induced fission rate for the ground state,
the neutron-induced fission rate
with thermally populated target states, the neutron capture rate for the ground
state, and the neutron capture rate with thermally populated target states (units
of all rates: cm
![]() ).
).
The rates in Tables 3-6 were calculated on the basis of different mass and fission barrier predictions: ETFSI, TF, FRDM(masses)+TF(barriers) and HFB respectively (see main text of the paper for details).
The entries are denoted as follows:
- [mother] mother nucleus (target),
- [T9] stellar temperature in 109 K,
- [p.f.] nuclear partition function,
- [(n,g)](n,
 )-rate,

- [(n,g)*](n,)-rate,
,
with thermally populated
target levels,
- [(n,f)] (n,fission)-rate,

- [(n,f)*] (n,fission)-rate,
,
with thermally populated
target levels.
Table A.2 shows which information is contained in the fit Tables 7-18, available at the CDS. The following information is provided:
- [mother]reaction target
- [Dev]fit accuracy
 (Eq. (5))
- [a0...a6]seven fit parameters for the forward rate
- [
 ...
...
 ]
seven fit parameters for the reverse rate fit (see Sect. 4.2).
]
seven fit parameters for the reverse rate fit (see Sect. 4.2).
The fitting coefficients for the (neutron,![]() )-, (
)-, (![]() ,n)-, and
neutron-induced fission rates with different mass and fission-barrier
predictions are placed in the Tables 7-18.
The columns in Tables 7-18 are organized as follows: target element, atomic
mass number A of the target, target charge number Z, the number of fitting
curves
,n)-, and
neutron-induced fission rates with different mass and fission-barrier
predictions are placed in the Tables 7-18.
The columns in Tables 7-18 are organized as follows: target element, atomic
mass number A of the target, target charge number Z, the number of fitting
curves
![]() ,
seven coefficients of the forward reaction ai, and the
mean square error.
,
seven coefficients of the forward reaction ai, and the
mean square error.
A value
![]() means that there is only one seven-parameter set to fit the
rate. Values
means that there is only one seven-parameter set to fit the
rate. Values
![]() give the number of parameter sets which have to be
added up to yield the final rate, i.e. the rate r is calculated as
give the number of parameter sets which have to be
added up to yield the final rate, i.e. the rate r is calculated as
![]() ,
with each ri computed from the ith parameter set and using Eq. (4).
,
with each ri computed from the ith parameter set and using Eq. (4).
The examples of Tables 3-6 are given for 1 isotope for 24 values of T9, and for Tables 7-18 - for 10 isotopes. Note that the tables of CDS show the values with an accuracy of seven digits.
Below we give two examples for calculating a rate at T9 = 7.0 with the fit parameters listed in the tables.
The first example is the reaction 273Cf(n,f). In
Table A.2 one finds the parameters
a0= 38.72,
a1=-0.057,
a2=8.78,
a3=-27.85,
a4= 1.90,
a5=-0.097,
a6= 10.45. With the help of Eq. (4) one calculates
![]() cm3s-1mole-1 or
cm3s-1mole-1 or
![]() at T9=7.0.
at T9=7.0.
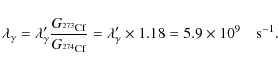
The second example is for the rates of the capture reaction 273Cf(n,![]() )274Cf and its reverse reaction. Similar to the above
example, using the parameters from Table A.2 and Eq. (4) the
capture rate is easily found to be
)274Cf and its reverse reaction. Similar to the above
example, using the parameters from Table A.2 and Eq. (4) the
capture rate is easily found to be
![]() 120 cm3s-1mole-1. With
the reverse parameters the first value in the determination of the reverse rate
is found to be
120 cm3s-1mole-1. With
the reverse parameters the first value in the determination of the reverse rate
is found to be
![]()
![]() 5.0
5.0 ![]() 109 s-1 at T9=7.0. In order to obtain the actual value of the
reverse rate, one first has to determine the ratio of the partition functions
109 s-1 at T9=7.0. In order to obtain the actual value of the
reverse rate, one first has to determine the ratio of the partition functions
![]() (see Table A.1 and Sect. 4.2). The value
(see Table A.1 and Sect. 4.2). The value
![]() has to be multiplied by this ratio to derive the
photodisintegration rate
has to be multiplied by this ratio to derive the
photodisintegration rate ![]() :
:
The values of the partition functions at T9 are also given in the online Tables 3-6. Note that the procedure is always the same as described above, regardless of whether it is an exoergic or an endoergic reaction.
References
- Aboussir, Y., Pearson, J. M., Dutta, A. K., & Tondeur, F. 1995, At. Data Nucl. Data Tables, 61, 127 [NASA ADS] [CrossRef] [Google Scholar]
- Aikawa, M., Arnould, M., Goriely, S., Jorissen, A., & Takahashi, K. 2005, A&A, 441, 1195 [NASA ADS] [CrossRef] [EDP Sciences] [Google Scholar]
- Arnould, M. 1972, A&A, 19, 92 [NASA ADS] [Google Scholar]
- Belgya, T., Bersillon, O., & Capote, R. 2006, in Handbook for calculations of nuclear reaction data, RIPL-2, IAEA-TECDOC-1506 (Vienna: IAEA Vienna), Available online at http://www-nds.iaea.org/RIPL-2/ [Google Scholar]
- Benlliure, J., Grewe, A., de Jong, M., Schmidt, K.-H., & Zhdanov, S. 1998, Nucl. Phys. A, 628, 458 [NASA ADS] [CrossRef] [Google Scholar]
- Bjornholm, S., & Lynn, J. E. 1980, Rev. of Mod. Phys., 52, 725 [Google Scholar]
- Böckstiegel, C., Steinhäuser, S., Schmidt, K.-H., et al. 2008, Nucl. Phys., A802, 12 [NASA ADS] [Google Scholar]
- Brosa, U., Grossmann, S., & Müller, A. 1990, Phys. Rep., 197, 167 [NASA ADS] [CrossRef] [Google Scholar]
- Cowan, J., Pfeiffer, B., Kratz, K.-L., et al. 1999, ApJ, 521, 194 [NASA ADS] [CrossRef] [Google Scholar]
- Cowan, J. J., Thielemann, F.-K., & Truran, J. W. 1991, Phys. Rep., 208, 267 [NASA ADS] [CrossRef] [Google Scholar]
- Cyburt, R. H., & Davids, B. 2008, Phys. Rev. C., 78, 064614 [NASA ADS] [CrossRef] [Google Scholar]
- Dymov, S. N., Kurbatov, V. S., Silin, I. N., & Yaschenko, S. V. 2000, Nucl. Instr. Meth. Phys. Res. A, 440, 43 [CrossRef] [Google Scholar]
- Experimental nuclear reaction data library. 2009, EXFOR: http://www-nds.iaea.or.at/exfor, IAEA, NDC [Google Scholar]
- Firestone, R. B., & Shirley, V. S. 1996, Table of Isotopes, 8th ed. (New York: Wiley) [Google Scholar]
- Fowler, W. A. 1974, QJRAS, 15, 82 [NASA ADS] [Google Scholar]
- Fowler, W. A., Caughlan, G. E., & Zimmerman, B. A. 1967, ARA&A, 5, 525 [NASA ADS] [CrossRef] [Google Scholar]
- Freiburghaus, C., Rembges, J.-F., T. Rauscher, T., et al. 1999, ApJ, 516, 381 [NASA ADS] [CrossRef] [Google Scholar]
- Goriely, S. 2000, in 10th Int. Symp. Capture gamma-ray spectroscopy and related topics (AIP), AIP Conf. Proc., 52, 287 [Google Scholar]
- Goriely, S., & Clerbaux, B. 1999, A&A, 346, 798 [NASA ADS] [Google Scholar]
- Goriely, S., Hilaire, S., & Koning, A. J. 2008, A&A., 487, 767 [NASA ADS] [CrossRef] [EDP Sciences] [Google Scholar]
- Goriely, S., Hilaire, S., Koning, A. J., Sin, M., & Capote, R. 2009, Phys. Rev. C., 79, 024612, available online at http://www.astro.ulb.ac.be/Html [NASA ADS] [CrossRef] [Google Scholar]
- Goriely, S., & Khan, E. 2002, Nucl. Phys. A, 706, 217 [NASA ADS] [CrossRef] [Google Scholar]
- Hauser, W., & Feshbach, H. 1952, Phys. Rev., 87, 366 [NASA ADS] [CrossRef] [Google Scholar]
- Hilf, E. R., Groote, H. V., & Takahashi, K. 1976, in Proc. 3rd Int. Conf. on Nuclei far from Stability, CERN-76-13 (CERN), 142 [Google Scholar]
- Holmes, J., Woosley, S., Fowler, W., & Zimmerman, B. 1976, At. Data Nucl. Data Tables, 18, 305 [Google Scholar]
- Howard, W. M., & Möller, P. 1980, At. Data Nucl. Data Tables, 25, 219 [NASA ADS] [CrossRef] [Google Scholar]
- Kelic, A., Ricciardi, M. V., & Schmidt, K.-H. 2008, in Joint ICTP-IAEA Advanced Workshop on Model Codes for Spallation Reactions, ed. D. F. et al., INDC(NDS)-530 (Vienna: IAEA), 181 [Google Scholar]
- Kelic, A., Zinner, N., Kolbe, E., Langanke, K., & Schmidt, K.-H. 2005, Phys. Lett. B, 616, 48 [NASA ADS] [CrossRef] [Google Scholar]
- Kodama, T., & Takahashi, K. 1975, Nucl. Phys. A, 239, 489 [NASA ADS] [CrossRef] [Google Scholar]
- Kruglov, K., Andreyev, A., Bruyneel, B. et al. 2002, Europ. Phys. J., A14, 365 [Google Scholar]
- Mamdouh, A., Pearson, J. M., Rayet, M., & Tondeur, F. 1998, Nucl. Phys., A664, 389 [NASA ADS] [Google Scholar]
- Mamdouh, A., Pearson, J. M., Rayet, M., & Tondeur, F. 2001, Nucl. Phys., A679, 337 [Google Scholar]
- Martínez-Pinedo, G., Mocelj, D., Zinner, N. T., et al. 2007, Prog. Part. Nucl. Phys., 59, 199 [Google Scholar]
- Möller, P., Nix, J. R., & Kratz, K.-L. 1997, At. Data Nucl. Data Tables, 66, 131 [Google Scholar]
- Möller, P., Nix, J. R., Myers, W. D., & Swiatecki, W. J. 1995, At. Data Nucl. Data Tables, 59, 185 [Google Scholar]
- Möller, P., Sierk, A. J., Ichikawa, T., et al. 2009, Phys. Rev. C., 79, 064304 [NASA ADS] [CrossRef] [Google Scholar]
- Myers, W. D., & Swiatecki, W. J. 1996, Nucl. Phys., A601, 141 [Google Scholar]
- Myers, W. D., & Swiatecki, W. J. 1999, Phys. Rev. C, 60, 014606 [NASA ADS] [CrossRef] [Google Scholar]
- Nadtochy, P.-N., Adeev, G.D., & Karpo, A.V. 2005, Phys. Rev. C, 65, 064615 [Google Scholar]
- Nagy, S., Flynn, K. F., Gindler, J. E., Meadows, J. W., & Glendenin, L. E. 1978, Phys. Rev. C, 17, 163 [NASA ADS] [CrossRef] [Google Scholar]
- Nakagawa, T., Chiba, S., Hayakawa, T., & Kajino, T. 2005, At. Data Nucl. Data Tables, 91, 77 [Google Scholar]
- Panov, I., & Thielemann, F.-K. 2004, Astron. Lett., 30, 647 [NASA ADS] [CrossRef] [Google Scholar]
- Panov, I. V., & Thielemann, F.-K. 2003, Nucl. Phys., A718, 647 [Google Scholar]
- Panov, I. V., Kolbe, E., Pfeiffer, B., et al. 2005, Nucl. Phys., A747, 633 [Google Scholar]
- Panov, I. V., Korneev, I. Y., & Thielemann, F.-K. 2008, Astron. Lett., 34, 189 [NASA ADS] [Google Scholar]
- Rauscher, T., & Thielemann, F.-K. 2000, At. Data Nucl. Data Tables, 75, 1 [NASA ADS] [CrossRef] [Google Scholar]
- Rauscher, T., & Thielemann, F.-K. 2001, At. Data Nucl. Data Tables, 79, 47 [Google Scholar]
- Rauscher, T., Bieber, R., Oberhummer, H., et al. 1998, Phys. Rev. C, 57, 2031 [NASA ADS] [CrossRef] [Google Scholar]
- Rauscher, T., Thielemann, F.-K., & Kratz, K.-L. 1997, Phys. Rev. C, 56, 1613 [NASA ADS] [CrossRef] [Google Scholar]
- Rauscher, T., Applegate, J., Cowan, J., Thielemann, F.-K., & Wiescher, M. 1994, ApJ, 429, 499 [NASA ADS] [CrossRef] [Google Scholar]
- Rusanov, A. Y., Itkis, M.G., & Okolovich, V. N. 1997, Phys. At. Nucl., 60, 683 [Google Scholar]
- Sargood, D. G. 1982, Phys. Rep., 93, 61 [NASA ADS] [CrossRef] [Google Scholar]
- Schmidt, K.-H., Kelic, A., & Ricciardi, M. 2008, Europhys. Lett., 83, 32001 [Google Scholar]
- Smirenkin, G. N. 1993, Tech. Rep. INDC(CCP)-359, IAEA [Google Scholar]
- Soppera, N., Bossant, M., Henriksson, H., Nagel, P., & Rugama, Y. 2008, in Proc. Int. Conf. on Nuclear Data for Science and Technology, April 22-27, 2007, ed. e. a. O. Bersillon (EDP Sciences), 1 [Google Scholar]
- Strutinsky, V. M. 1967, Nucl. Phys., A95, 420 [NASA ADS] [Google Scholar]
- Thielemann, F.-K., Arnould, M., & Truran, J. W. 1987, in Advances in Nuclear Astrophysics, ed. E. V.-F. et al. (Gif-sur-Yvette: Editions Frontières), 525 [Google Scholar]
- Thielemann, F.-K., Cameron, A., & Cowan, J. J. 1989, in Fifty Years with Nuclear Fission, ed. J. Behrens & A. Carlson (Gaithersburg: American Nuclear Society), 592 [Google Scholar]
- Thielemann, F.-K., Metzinger, J., & Klapdor-Kleingrothaus, H. V. 1983, Z. Phys. A, 309, 301 [Google Scholar]
- Tovesson, F., Hill, T. S., Baker, J. D., & McGrath, C. A. 2009, Phys. Rev. C., 79, 014613 [NASA ADS] [CrossRef] [Google Scholar]
- Wahl, A. C. 1988, At. Data Nucl. Data Tables, 39, 1 [Google Scholar]
- Wilkins, B., Steinberg, E., & Chasman, R. 1976, Phys. Rev. C, 14, 1832 [NASA ADS] [CrossRef] [Google Scholar]
- Wolfenstein, L. 1951, Phys. Rev., 82, 690 [Google Scholar]
- Woosley, S., Fowler, W., Holmes, J., & Zimmerman, B. 1978, At. Data Nucl. Data Tables, 22, 371 [Google Scholar]
Footnotes
- ... nuclei
- Tables 3-18 with these data are only available in electronic form at the CDS via anonymous ftp to cdsarc.u-strasbg.fr (130.79.128.5) or via http://cdsweb.u-strasbg.fr/cgi-bin/qcat?J/A+A/513/A61
All Tables
Table 1: Neutron separation energy Sn and fission barrier predictions for nucleus 262U formed after neutron capture by 261U.
Table 2:
Ranges of isotopes for which we calculated rates based on input
from the models TF, FRDM, ETFSI and HFB. Given are the charge number ![]() and the lower and upper limits
and the lower and upper limits
![]() and
and
![]() of the neutron number of the
targets in the isotopic chain.
of the neutron number of the
targets in the isotopic chain.
Table A.1:
Example of format of rates presented in the Tables 3-6, available at the CDS: reaction rates
![]() and partition functions show a subset of calculation based on ETFSI
predictions.
and partition functions show a subset of calculation based on ETFSI
predictions.
Table A.2:
Parameterization of the (![]() )-,
)-,
![]() -
and (n,f)-rates, available at the CDS Tables 6-18.
-
and (n,f)-rates, available at the CDS Tables 6-18.
All Figures
|
|
Figure 1:
Present predictions of energy-dependent (n,f) cross sections
|
| Open with DEXTER | |
| In the text | |
|
|
Figure 2:
Comparison of
|
| Open with DEXTER | |
| In the text | |
|
|
Figure 3: Comparison of (n,f)-rates (integrated over Maxwell-Boltzmann distributions of targets and projectiles for the displayed temperatures) from present calculations and other existing predictions for the target nuclei 238U ( left) and 242Pu ( right) with the experiment. The symbols are chosen as follows: Goriely et al. (2009) (green two-dot-dash line), JENDL-3.3 (Nakagawa et al. 2005) (crosses). Our calculations are shown for reaction rates including only the ground state (GS) or a thermally populated target (GS+tps) for different nuclear data predictions (HFB or ETFSI). The results of Goriely et al. (2009) correspond to GS + tps conditions. |
| Open with DEXTER | |
| In the text | |
|
|
Figure 4: Contour plot of the quantity Bf-Sn (in MeV) for two choices of models for masses and fission barriers: FRDM masses plus TF fission barriers ( left) and ETFSI-predictions ( right). Also indicated are known superheavy nuclei (boxes) and the drip-line (line), where Bf-Sn determines whether the r-process continues towards heavier nuclei or fission cycling to lighter fission products occurs. |
| Open with DEXTER | |
| In the text | |
|
|
Figure 5: Calculated maxwellian averaged neutron-induced fission cross sections in comparison to evaluated experimental fission cross sections at 30 keV. Left panel: experimental fission barriers were utilized in the calculations (circles) of maxwellian averaged cross-sections in comparison to experimental values for 58 isotopes from Th to Fm taken from JENDL-3.3 (Nakagawa et al. 2005); central panel: the same ratio of calculated and evaluated experimental values, but employing theoretical fission barrier predictions from different sources: the Extended Thomas-Fermi model by Mamdouh et al. (2001) (diamonds), the Thomas-Fermi by Myers & Swiatecki (1999) (squares), and recent predictions from Möller et al. (2009) (green triangles up). When not experimentally known, consistent nuclear masses were utilized from the corresponding model predictions. Right panel: comparison of maxwellian averaged cross-sections from our calculations (triangles) and from the Talys (Goriely et al. 2009) calculations (crosses), both utilizing HFB predictions (with BSk14 Skyrme force) of masses and fission barriers. |
| Open with DEXTER | |
| In the text | |
|
|
Figure 6:
Dependence of neutron-induced fission cross sections
|
| Open with DEXTER | |
| In the text | |
|
|
Figure 7:
Ratio
|
| Open with DEXTER | |
| In the text | |
|
|
Figure 8: Representative fits of neutron-induced fission rates (273Cf and 291Cm) for two types of temperature dependences. The general aim is to attain sufficient accuracy with one set of seven fitting coefficients (see Eq. (4)), as shown in the left curve. In some cases the superposition of two such sets is necessary ( right panel) to correctly reproduce the low- as well as high-temperature behavior. A correct extrapolation to low temperatures ( 0.01 < T9 < 0.1) is important to avoid unphysical abundance changes (see also the explanation of tables). |
| Open with DEXTER | |
| In the text | |
|
|
Figure 9:
The accuracy of fits is defined by a mean-square error
(see Eq. (5)), shown here for
|
| Open with DEXTER | |
| In the text | |
|
|
Figure 10: The final mass distributions of fission fragments for the compound nuclei (after neutron capture) 238U, 282Cm and 292Cf. The distributions were computed with the ABLA code (Kelic et al. 2008) as described in the text. In addition, we show the yields computed with the phenomenological parameterizations of Panov et al. (2008) and Kodama & Takahashi (1975), as well as experimental data (crosses). |
| Open with DEXTER | |
| In the text | |
Copyright ESO 2010
Current usage metrics show cumulative count of Article Views (full-text article views including HTML views, PDF and ePub downloads, according to the available data) and Abstracts Views on Vision4Press platform.
Data correspond to usage on the plateform after 2015. The current usage metrics is available 48-96 hours after online publication and is updated daily on week days.
Initial download of the metrics may take a while.