| Issue |
A&A
Volume 512, March-April 2010
|
|
|---|---|---|
| Article Number | A3 | |
| Number of page(s) | 12 | |
| Section | Interstellar and circumstellar matter | |
| DOI | https://doi.org/10.1051/0004-6361/200912859 | |
| Published online | 17 March 2010 | |
L1506: a prestellar core in the making![[*]](/icons/foot_motif.png)
L. Pagani1 - I. Ristorcelli2 - N. Boudet2 - M. Giard2 - A. Abergel3 - J.-P. Bernard2
1 - LERMA & UMR 8112 du CNRS, Observatoire de Paris, 61 Av. de
l'Observatoire, 75014 Paris, France
2 - CESR & UMR 5187 du CNRS/Université de Toulouse, 9 Av. du
Colonel Roche, BP 4346, 31028 Toulouse Cedex 4, France
3 - IAS, Bât. 121, Université Paris-Sud, 91435 Orsay, France
Received 9 July 2009 / Accepted 2 December 2009
Abstract
Context. Exploring the structure and dynamics of
cold starless clouds is necessary to understand the different steps
leading to the formation of protostars. Because clouds evolve slowly,
many of them must be studied in detail to
identify different moments in a cloud's lifetime.
Aims. We study a fragment of the long filament
L1506 in the Taurus region, which we name L1506, a
core with interesting dust properties observed by the PRONAOS
balloon-borne telescope.
Methods. To trace the mass content of L1506C and its
kinematics, we mapped the dust emission, and the line emission of two
key species, C18O and N2H+.
We also observed 13CO and C17O.
We model the species emission using 1D Monte Carlo
models.
Results. This cloud is reminiscent of L1498 but also
exhibits peculiar features: i) a large envelope
emitting solely in 13CO that contains a much
smaller core with strong C18O depletion at its
centre despite a low maximum opacity (![]()
![]() 20 mag); ii) extremely narrow C18O
lines indicating a low, non-measurable turbulence;
iii) contraction traced by C18O itself
(plus rotation); iv) unexpectedly, the kinematical signature
of the external envelope is opposite to that of the core, the 13CO
and C18O velocity gradients having opposite
directions and the C18O line profile being blue
peaked in contrast to the 13CO one which is red
peaked. The core is large (r = 3
20 mag); ii) extremely narrow C18O
lines indicating a low, non-measurable turbulence;
iii) contraction traced by C18O itself
(plus rotation); iv) unexpectedly, the kinematical signature
of the external envelope is opposite to that of the core, the 13CO
and C18O velocity gradients having opposite
directions and the C18O line profile being blue
peaked in contrast to the 13CO one which is red
peaked. The core is large (r = 3 ![]() 104 AU)
and not very dense (n(H2)
104 AU)
and not very dense (n(H2) ![]() 5
5 ![]() 104 cm-3,
possibly less). This core is therefore not yet prestellar.
104 cm-3,
possibly less). This core is therefore not yet prestellar.
Conclusions. All these properties imply that the
core is kinematically detached from its envelope and in the process of
forming a prestellar core. This is the first time that the
dynamical formation of a prestellar core has been witnessed. The
extremely low turbulence could explain the strong depletion of this
core despite its relatively low density and opacity in contrast to
undepleted cores such as L1521E, which exhibits a turbulence
at least 4 times as high.
Key words: stars: formation - ISM: clouds - ISM: abundances - ISM: molecules - ISM: structure - ISM: individual objects: L1506
1 Introduction
On their way to forming stars, clouds go through a contraction phase
leading to the formation of prestellar cores (n ![]() 1
1 ![]() 105 cm-3,
Keto & Caselli 2008),
which are usually identified by their lack of internal heating sources,
their large CO depletion, and their strong NH3
and N2H+ emission
lines for which turbulence is often subthermal. These cores
subsequently collapse to form protostars. Many details pertaining to
these two condensation steps remain obscure and we do not understand
the conditions necessary to produce stars of different masses, high or
low, the conditions necessary to initiate the contraction of the cloud
or the collapse of the prestellar core, nor the rôle of the magnetic
field in supporting the clouds against collapse. Obviously, since the
evolution time is long, one has to observe many clouds as a
substitute to tracking any single cloud in the process of forming a
star. For each cloud, physical and chemical properties should be
studied in detail to assess all important parameters such as
temperature, density, kinematics, and their respective gradients,
if any, and also chemical abundances by volume.
By accumulating this type of studies, we can hope to evaluate
the impact of cloud age or density upon the depletion phenomenon,
distinguish contraction from oscillation, and describe how prestellar
cores and protostars form.
105 cm-3,
Keto & Caselli 2008),
which are usually identified by their lack of internal heating sources,
their large CO depletion, and their strong NH3
and N2H+ emission
lines for which turbulence is often subthermal. These cores
subsequently collapse to form protostars. Many details pertaining to
these two condensation steps remain obscure and we do not understand
the conditions necessary to produce stars of different masses, high or
low, the conditions necessary to initiate the contraction of the cloud
or the collapse of the prestellar core, nor the rôle of the magnetic
field in supporting the clouds against collapse. Obviously, since the
evolution time is long, one has to observe many clouds as a
substitute to tracking any single cloud in the process of forming a
star. For each cloud, physical and chemical properties should be
studied in detail to assess all important parameters such as
temperature, density, kinematics, and their respective gradients,
if any, and also chemical abundances by volume.
By accumulating this type of studies, we can hope to evaluate
the impact of cloud age or density upon the depletion phenomenon,
distinguish contraction from oscillation, and describe how prestellar
cores and protostars form.
Many prestellar cores have been identified and some have
already been studied in detail, including L1506,
L1506, L1506, and L1506. Among these
objects, a few cases have been identified as early
prestellar cores if their density is already higher than
1 ![]() 105 cm-3,
or simple cores probably about to form
prestellar cores if not. The first type includes L1506,
L1506, and L1506 (Hirota et al. 2004;
Tafalla
& Santiago 2004; Hirota et al. 2002),
which, despite having a high density, show no sign of depletion (strong
CO lines, weak or absent NH3
and N2H+ lines)
and are considered to be both physically and chemically young, while
the second type is represented by two cases presently, L1506 (Shirley
et al. 2005; Tafalla et al. 2004)
and the very dense globule L1506 in the Coalsack
complex (Lada
et al. 2004). In the study by Shirley et al. (2005),
L1498 exhibits a low density (1-3
105 cm-3,
or simple cores probably about to form
prestellar cores if not. The first type includes L1506,
L1506, and L1506 (Hirota et al. 2004;
Tafalla
& Santiago 2004; Hirota et al. 2002),
which, despite having a high density, show no sign of depletion (strong
CO lines, weak or absent NH3
and N2H+ lines)
and are considered to be both physically and chemically young, while
the second type is represented by two cases presently, L1506 (Shirley
et al. 2005; Tafalla et al. 2004)
and the very dense globule L1506 in the Coalsack
complex (Lada
et al. 2004). In the study by Shirley et al. (2005),
L1498 exhibits a low density (1-3 ![]() 104 cm-3)
and molecular depletion (as already reported by several other
authors, especially Willacy
et al. 1998, who, by studying L1498,
reported the first C18O depletion in a
prestellar core by comparison with a dust map). The G2 gas
content has not yet been studied in detail and only its peculiar,
ring-like dust shape indicates its unstable nature despite its low
density. This core is expected to turn into a prestellar core (Lada et al. 2004).
In this second category, which is considered to represent
cores that are physically young but chemically evolved, we present a
newcomer, a fraction of the L1506 filament.
104 cm-3)
and molecular depletion (as already reported by several other
authors, especially Willacy
et al. 1998, who, by studying L1498,
reported the first C18O depletion in a
prestellar core by comparison with a dust map). The G2 gas
content has not yet been studied in detail and only its peculiar,
ring-like dust shape indicates its unstable nature despite its low
density. This core is expected to turn into a prestellar core (Lada et al. 2004).
In this second category, which is considered to represent
cores that are physically young but chemically evolved, we present a
newcomer, a fraction of the L1506 filament.
The cloud that we present in this paper, L1506,
attracted attention during a large-scale 13CO
survey (Abergel
et al. 1994) because of its low (though not unique)
DIRBE![]()
![]() /
/
![]() and IRAS
and IRAS![]()
![]() /
/
![]() colour ratios to
which the 13CO maps were compared.
Its dust properties were studied later on using the PRONAOS
colour ratios to
which the 13CO maps were compared.
Its dust properties were studied later on using the PRONAOS![]() balloon-borne experiment
continuum emission data in the submillimetre range (200-600
balloon-borne experiment
continuum emission data in the submillimetre range (200-600 ![]() m) (Stepnik et al. 2003),
albeit with a limited angular resolution (2-3.5
m) (Stepnik et al. 2003),
albeit with a limited angular resolution (2-3.5![]() ). A significant
change in the dust properties was detected between the diffuse and the
dense part of the cloud: no emission from transiently heated
small particles and a strong enhancement (by a factor
of 3.4) in the submillimetre emissivity of the latter. This
was interpreted as the signature of dust coagulation leading to the
formation of fluffy aggregates (consisting of a mixture of very small
and large grains). To understand this evolution and
investigate the physical conditions associated with efficient aggregate
formation (ice mantles, level of turbulence,
densities, ...), we concentrate on the gas properties.
It is presently clear that depletion plays a key rôle in the
gas phase of dark clouds and basically two species are needed to map
the gas inside the clouds, namely C18O and N2H+.
We may also use NH3 as a tracer but N2H+
has some advantages over NH3 among which the
possibility to use the same telescope as for C18O,
giving a similar resolution and beam correction and also superior
diagnostic capabilities as discussed by Pagani et al. (2007).
By observing these species, both the undepleted (outer) and
the depleted (inner) cores can be traced and their kinematics and
physical properties can be modeled. With 13CO,
we are also able to trace a fraction of the extended envelope. We
present and model these observations in this paper and discuss the
properties of this cloud.
). A significant
change in the dust properties was detected between the diffuse and the
dense part of the cloud: no emission from transiently heated
small particles and a strong enhancement (by a factor
of 3.4) in the submillimetre emissivity of the latter. This
was interpreted as the signature of dust coagulation leading to the
formation of fluffy aggregates (consisting of a mixture of very small
and large grains). To understand this evolution and
investigate the physical conditions associated with efficient aggregate
formation (ice mantles, level of turbulence,
densities, ...), we concentrate on the gas properties.
It is presently clear that depletion plays a key rôle in the
gas phase of dark clouds and basically two species are needed to map
the gas inside the clouds, namely C18O and N2H+.
We may also use NH3 as a tracer but N2H+
has some advantages over NH3 among which the
possibility to use the same telescope as for C18O,
giving a similar resolution and beam correction and also superior
diagnostic capabilities as discussed by Pagani et al. (2007).
By observing these species, both the undepleted (outer) and
the depleted (inner) cores can be traced and their kinematics and
physical properties can be modeled. With 13CO,
we are also able to trace a fraction of the extended envelope. We
present and model these observations in this paper and discuss the
properties of this cloud.
2 Observations
All observations were performed using the IRAM-30 m telescope![]() . The dark nebula L1506 is
an elongated object (Onishi et al. 1996;
Nercessian
et al. 1988) and the SIMBAD
. The dark nebula L1506 is
an elongated object (Onishi et al. 1996;
Nercessian
et al. 1988) and the SIMBAD![]() reference position (
reference position (
![]() = 4
= 4![]() 18
18![]() 31.1
31.1![]()
![]() = +25
= +25![]() 19
19![]() 25
25
![]() )
is outside the part of the cloud that we present here, which is centred
on the PRONAOS emission peak (
)
is outside the part of the cloud that we present here, which is centred
on the PRONAOS emission peak (
![]() = 4
= 4![]() 18
18![]() 50
50![]()
![]() = +25
= +25![]() 19
19![]() 15
15
![]() ,
Stepnik et al. 2003)
that we propose to name L1506 (A and B are
already defined, Lee
& Myers 1999). Its distance is estimated to
be 140 pc (Elias 1978; Kenyon
et al. 1994).
,
Stepnik et al. 2003)
that we propose to name L1506 (A and B are
already defined, Lee
& Myers 1999). Its distance is estimated to
be 140 pc (Elias 1978; Kenyon
et al. 1994).
In September 2004, we mapped the filament dust emission at
1.2 mm with the MAMBO![]() II
bolometre. Skydips, pointings, and calibration source observations were
regularly performed, and data reduction was executed using IRAM
proprietary software. The cold filament studied by Stepnik et al. (2003)
is clearly visible at the centre (Fig. 1). Spectroscopic
observations were performed over several runs: 29
and 30 November 2003,
22 and 23 May 2004,
28 July 2004, and 18 July 2008. In
all cases, the VESPA
II
bolometre. Skydips, pointings, and calibration source observations were
regularly performed, and data reduction was executed using IRAM
proprietary software. The cold filament studied by Stepnik et al. (2003)
is clearly visible at the centre (Fig. 1). Spectroscopic
observations were performed over several runs: 29
and 30 November 2003,
22 and 23 May 2004,
28 July 2004, and 18 July 2008. In
all cases, the VESPA![]() autocorrelator was used with frequency sampling varying from 6
to 20 kHz for 3 mm lines and 40 kHz for
1.3 mm lines (Table 1). All
observations were performed in frequency switching mode.
Receivers A&B were used except in July 2008,
when the 1 mm 9 pixel cameras HERA
autocorrelator was used with frequency sampling varying from 6
to 20 kHz for 3 mm lines and 40 kHz for
1.3 mm lines (Table 1). All
observations were performed in frequency switching mode.
Receivers A&B were used except in July 2008,
when the 1 mm 9 pixel cameras HERA![]() 1&2 were
used in the On-the-Fly mode still using frequency switching. The C18O
and 13CO (J:1-0) lines were
observed simultaneously by tuning the receiver halfway between the two
frequencies and offsetting the VESPA autocorrelator subwindows by
1&2 were
used in the On-the-Fly mode still using frequency switching. The C18O
and 13CO (J:1-0) lines were
observed simultaneously by tuning the receiver halfway between the two
frequencies and offsetting the VESPA autocorrelator subwindows by ![]() 210 MHz
in front of the two lines. Pointing was regularly checked and found to
be stable to within 3
210 MHz
in front of the two lines. Pointing was regularly checked and found to
be stable to within 3
![]() .
.
![\begin{figure}
\par\includegraphics[angle=-90,width=7.5cm,clip]{12859fg1.eps}
\end{figure}](/articles/aa/full_html/2010/04/aa12859-09/img21.png)
|
Figure 1:
Dust emission at 1.2 mm as measured by MAMBO II. Resolution
was degraded to 30
|
| Open with DEXTER | |
Table 1: Telescope settings.
![\begin{figure}
\par\includegraphics[angle=-90,width=17cm,clip]{12859fg2.eps}
\end{figure}](/articles/aa/full_html/2010/04/aa12859-09/img24.png)
|
Figure 2:
Left: low resolution 13CO
(J:1-0) integrated intensity map of the
L1506 Taurus cloud filament (original data from Nercessian et al. 1988).
Contour levels are 0.5
to 4.5 K km s-1
in steps of 1 K km s-1.
The POM-1 2.5-m dish has a 4.5 |
| Open with DEXTER | |
![\begin{figure}
\par\includegraphics[width=12cm,clip]{12859fg3.eps}
\end{figure}](/articles/aa/full_html/2010/04/aa12859-09/img25.png)
|
Figure 3: Spectra taken along the PRONAOS cut (see Fig. 2). The upper row shows the 13CO (J:1-0) spectra. The middle row shows the C18O (J:1-0) spectra. The lower row shows the N2H+ (J:1-0) spectra. The velocity scale is 6.5 to 8 km s-1 for 13CO and C18O, and 5.5 to 9 km s-1 for N2H+. Offsets increase from North-West to South-East. |
| Open with DEXTER | |
3 Results and analysis
Figure 2
shows a large-scale 13CO (J:1-0)
map obtained with POM-1![]() ,
a 2.5 m dish telescope with 4.5
,
a 2.5 m dish telescope with 4.5![]() resolution and
100 kHz filters - 0.27 km s-1 -
that was in service at Bordeaux Observatory. The original data were
taken from Nercessian
et al. (1988) and the region of interest is
delineated by a square. This map traces the large-scale envelope of the
cloud. On the right-hand side, the C18O (J:2-1)
integrated intensity map obtained on-the-fly with the 30-m over L1506C
is shown. We degraded the resolution to 24
resolution and
100 kHz filters - 0.27 km s-1 -
that was in service at Bordeaux Observatory. The original data were
taken from Nercessian
et al. (1988) and the region of interest is
delineated by a square. This map traces the large-scale envelope of the
cloud. On the right-hand side, the C18O (J:2-1)
integrated intensity map obtained on-the-fly with the 30-m over L1506C
is shown. We degraded the resolution to 24
![]() to increase the signal-to-noise ratio. A large hole in
emission is visible in the centre of the map which is caused by
CO depletion, as now well established. The PRONAOS
strip centred on the 100
to increase the signal-to-noise ratio. A large hole in
emission is visible in the centre of the map which is caused by
CO depletion, as now well established. The PRONAOS
strip centred on the 100 ![]() m emission peak traverses the most depleted part
of the filament. This depletion is also remarkable in terms of spectrum
peak temperature (Fig. 3)
or integrated intensity (Fig. 4) along the
PRONAOS strip. In these figures, the decrease in C18O intensity
is correlated with the appearance of N2H+,
another sure sign of CO depletion as CO readily
destroys N2H+ (Caselli
2002; Pagani et al. 2005;
Bergin
& Langer 1997). To verify that the C18O
lines do not decrease for opacity reasons in the centre of the cloud,
we observed 3 positions in C17O (J:1-0).
We chose two positions close to the C18O peaks
on each side of the strip (
m emission peak traverses the most depleted part
of the filament. This depletion is also remarkable in terms of spectrum
peak temperature (Fig. 3)
or integrated intensity (Fig. 4) along the
PRONAOS strip. In these figures, the decrease in C18O intensity
is correlated with the appearance of N2H+,
another sure sign of CO depletion as CO readily
destroys N2H+ (Caselli
2002; Pagani et al. 2005;
Bergin
& Langer 1997). To verify that the C18O
lines do not decrease for opacity reasons in the centre of the cloud,
we observed 3 positions in C17O (J:1-0).
We chose two positions close to the C18O peaks
on each side of the strip (![]() 75
75
![]() )
and one in the middle, close to the local minimum of the C18O
emission (Fig. 5).
These 3 positions are indicated in Fig. 2 by
3 small white boxes superimposed on 3 of the crosses
along the PRONAOS strip. Several interesting features are visible:
)
and one in the middle, close to the local minimum of the C18O
emission (Fig. 5).
These 3 positions are indicated in Fig. 2 by
3 small white boxes superimposed on 3 of the crosses
along the PRONAOS strip. Several interesting features are visible:
- 1.
- The (0, 0) and (+75
 ,
0) offset positions (along the cut) display extremely narrow C17O
and C18O lines (FWHM = 0.16
to 0.26 km s-1, where FWHM
represents full width half maximum).
,
0) offset positions (along the cut) display extremely narrow C17O
and C18O lines (FWHM = 0.16
to 0.26 km s-1, where FWHM
represents full width half maximum).
- 2.
- The existence of a velocity gradient across the strip, which possibly traces rotation in the C18O data.
- 3.
- The existence of another velocity gradient for 13CO of opposite direction.
- 4.
- The C18O (J:1-0) splitting towards the reference position, which is not very visible in the (J:2-1) line but is clearly so in the C17O (J:1-0) line, as the dotted lines indicate in Fig. 5.
![\begin{figure}
\par\includegraphics[angle=-90,width=8.8cm,clip]{12859fg4.eps}
\end{figure}](/articles/aa/full_html/2010/04/aa12859-09/img26.png)
|
Figure 4:
Integrated intensity of C18O and N2H+
(J:1-0) compared to the dust emission as measured by
MAMBO along the PRONAOS cut. MAMBO data are smoothed
to 40
|
| Open with DEXTER | |
As far as we know, these CO narrow lines are the narrowest C18O
and C17O lines reported
so far, being comparable to the very narrow features seen in NH3
and N2H+ in sources such
as L183 (Pagani
et al. 2007). The main difference is that these C18O
and C17O lines are emitted outside the
depleted core, in a region where turbulence is
usually still high. The lines are narrow enough for the C17O
![]() :17/2-05/2
and
:17/2-05/2
and ![]() :13/2-05/2 hyperfine
components, which are usually blended, to be completely
separated here.
:13/2-05/2 hyperfine
components, which are usually blended, to be completely
separated here.
Figure 6
confirms the extraordinary narrowness of the lines towards the centre
of the cloud. These C18O spectra were taken at
(0, -25
![]() )
in the frame of the PRONAOS cut, which is (-21.6
)
in the frame of the PRONAOS cut, which is (-21.6
![]() , -12.6
, -12.6
![]() )
in the Equatorial J2000 frame. The (J:1-0)
spectrum clearly contains two components, which we fitted with
2 independent Gaussians. We also fitted the (J:2-1)
spectrum with two unconstrained Gaussians. The velocity of each of the
two components agree for both lines within the uncertainty of the fit
(a difference of 10 m s-1
for an uncertainty of 30 and 40 m s-1
for the left and right components, respectively). As for C17O
in Fig. 5,
the splitting of the two components is
)
in the Equatorial J2000 frame. The (J:1-0)
spectrum clearly contains two components, which we fitted with
2 independent Gaussians. We also fitted the (J:2-1)
spectrum with two unconstrained Gaussians. The velocity of each of the
two components agree for both lines within the uncertainty of the fit
(a difference of 10 m s-1
for an uncertainty of 30 and 40 m s-1
for the left and right components, respectively). As for C17O
in Fig. 5,
the splitting of the two components is ![]() 200 m s-1
and the width of the individual components is 150 (right) and
180 (left) m s-1. For
a standard gas kinetic temperature of 10 K,
for which the optically thin thermal linewidth of CO is
200 m s-1
and the width of the individual components is 150 (right) and
180 (left) m s-1. For
a standard gas kinetic temperature of 10 K,
for which the optically thin thermal linewidth of CO is ![]() 0.12 km s-1,
this constrains the turbulent width contribution to the
linewidth to be
0.12 km s-1,
this constrains the turbulent width contribution to the
linewidth to be ![]() 90 m s-1.
90 m s-1.
![\begin{figure}
\par\includegraphics[width=8.5cm,clip]{12859fg5.eps}
\end{figure}](/articles/aa/full_html/2010/04/aa12859-09/img28.png)
|
Figure 5:
Spectra of 13CO (dotted lines), C17O,
and C18O taken at 3 different positions
along the PRONAOS strip: in the middle and close to each side peak C18O
emission. The full width at half maximum is indicated for some
remarkably narrow lines. Only the C17O |
| Open with DEXTER | |
![\begin{figure}
\par\includegraphics[angle=-90,width=8.8cm,clip]{12859fg6.eps}
\end{figure}](/articles/aa/full_html/2010/04/aa12859-09/img29.png)
|
Figure 6:
C18O (J:1-0) ( top)
and (J:2-1) ( bottom) spectra
(histogram plot) taken 25
|
| Open with DEXTER | |
If the C18O and C17O
splitting was caused by self-absorption, the exact reverse would be
true, the C18O (J:2-1) line
would have contained the deepest self-absorption feature and normally
no such feature would have been seen in C17O
since, due to its low abundance and to its hyperfine
structure, it is very difficult to make it optically thick.
These symmetric features cannot be caused by rotational Döppler
shifting because for a narrow beam directed at the rotational axis,
most of the material picked up by the beam moves at right angles to the
line of sight with therefore no contribution to the velocity component
along it. Only material very close to the rotational axis
would contribute to the Döppler shifted emission. Since the inner core
is depleted in CO, this contribution near the axis is not
possible and therefore rotation cannot explain this splitting.
To explain this double peak feature, the only possibility left
is that the CO envelope is radially moving. The direction of
movement (expansion or contraction) can be inferred from the asymmetry
of the C18O (J:1-0) and (J:2-1) lines.
Here, these C18O lines are stronger in
the blue component than in the red component. As we confirm
using the Monte Carlo model (Sect. 4), this can only
be explained by contraction and not expansion despite the absence of
heavy self-absorption, which is usually invoked to justify blue peaked
profiles (Myers
et al. 1996). Since the lines are almost independent
because of their narrowness, the blue and red line contributions are
each emitted from only one side of the cloud - front or back
depending on the movement, expansion or contraction - and have
no or very little interaction. The line formed in the rear part of the
core originates in the (backside) low density envelope and obtains
contribution from a material that becomes denser as the photons travel
towards the observer, until they reach the depleted zone and then cross
the remaining cloud without interaction. For a constant kinetic
temperature, this means that the excitation temperature of the
contributing material increases (or remains constant if
thermalized) towards the observer and the successive layers add their
contribution to the emergent signal. In contrast,
the line formed on the near side of the cloud originates in
the highest density and excitation temperature layer, just outside the
depleted zone and obtains contributions from increasingly less dense
material with therefore decreasing excitation temperature. When the
excitation temperature decreases, a net absorption of photons can occur
if opacity is not null. The C18O lines are not
really optically thin (opacities are in the range of 0.1
to 0.5) and this is enough to slightly differentiate between
the line that originates in the rear part of the cloud, which
experiences no attenuation after leaving the highest excitation
temperature layer and the line which comes from the front part and
experienced a small absorption due to the outer, less excited layers.
The effect is clearly visible towards the
(0, 0) position: the C18O (J:1-0)
line is 20% stronger on the blue side (1.81 and
1.48 K peak temperature for the blue and red components,
a difference greater than 10![]() ,
with
,
with ![]() = 27 mK),
and the C18O (J:2-1) line has
lost its red peak because of higher opacity and higher sensitivity to
density conditions (Fig. 5).
The red component is therefore that emitted from the front part of the
cloud, the blue component from the rear part and this indicates that
the cloud is contracting rather than expanding
= 27 mK),
and the C18O (J:2-1) line has
lost its red peak because of higher opacity and higher sensitivity to
density conditions (Fig. 5).
The red component is therefore that emitted from the front part of the
cloud, the blue component from the rear part and this indicates that
the cloud is contracting rather than expanding![]() .
The amount of contraction of the C18O core is
indicated by the two dotted lines in Fig. 5, namely
.
The amount of contraction of the C18O core is
indicated by the two dotted lines in Fig. 5, namely ![]() 100 m s-1.
Therefore, the C18O outer core both rotates
(from the (
100 m s-1.
Therefore, the C18O outer core both rotates
(from the (![]() 75
75
![]() , 0)
symmetrical velocity offsets seen in Fig. 5 as mentioned
above) and contracts. To our knowledge, this is the first time
that core contraction is observed based on C18O
and C17O lines.
, 0)
symmetrical velocity offsets seen in Fig. 5 as mentioned
above) and contracts. To our knowledge, this is the first time
that core contraction is observed based on C18O
and C17O lines.
The N2H+ hyperfine structure lines do not have such a high signal-to-noise ratio and do not show structured profiles. However, their displacement in velocity along the cut is similar to that of C18O as we can see in Fig. 7.
The 13CO (J:1-0)
line, which was observed simultaneously with the C18O
(J:1-0) line, has a very different behaviour
(Figs. 3, 5 and 7).
Its peak intensity is redshifted and its velocity gradient
along the cut is opposite to that of the C18O line.
From the large-scale 13CO map obtained with
POM-1, we know that the L1506 filament has a width of ![]() 40
40![]() in the region around L1506C (Fig. 2). This is
in the region around L1506C (Fig. 2). This is ![]() 6 times
larger than the C18O extent. As we do
not know how the 13CO velocity behaves beyond
these central 6
6 times
larger than the C18O extent. As we do
not know how the 13CO velocity behaves beyond
these central 6![]() ,
we cannot claim that this velocity drift is the signature of a rotation
of the large-scale filament but it definitely indicates that it is
opposite to the C18O rotation (Figs. 5 and 7). Similarly,
the red peak in the 13CO velocity profile is
probably a sign of gas expansion (Figs. 3 and 5), while C18O
traces a contraction. Therefore, the extended envelope has a
dynamical behaviour that is the opposite of that of the core.
,
we cannot claim that this velocity drift is the signature of a rotation
of the large-scale filament but it definitely indicates that it is
opposite to the C18O rotation (Figs. 5 and 7). Similarly,
the red peak in the 13CO velocity profile is
probably a sign of gas expansion (Figs. 3 and 5), while C18O
traces a contraction. Therefore, the extended envelope has a
dynamical behaviour that is the opposite of that of the core.
![\begin{figure}
\par\includegraphics[angle=-90,width=18cm,clip]{12859fg7.eps}
\end{figure}](/articles/aa/full_html/2010/04/aa12859-09/img32.png)
|
Figure 7:
Position-velocity plots along the PRONAOS cut. For each line, we show
the observations on the left and the model on the right with the same
contour levels. For N2H+,
we reproduce only the 3 inner hyperfine components. The dashed
line indicates the systemic velocity of the cloud. For 13CO
and C18O observations, the dotted contours
delineate interpolated data (data is missing for
offsets |
| Open with DEXTER | |
Figure 4 shows the asymmetry of the cloud in both dust and gas. It is remarkable that the C18O lines on each side of the cut have the same maximum integrated intensity despite a variation of 25% in peak intensity. It indicates that the quantity of gas is comparable and that the main reason for the intensity change is the line width difference. We also note that the N2H+ integrated intensity profile is strongly asymmetric and varies abruptly at the top, two features that we cannot reproduce with our standard one-dimensional (1D) model (see Sect. 4). Its peak position is close to but not coincident with the dust peak position.
We observed the position with the second strongest N2H+
integrated intensity (offset +25
![]() along the PRONAOS strip) in N2D+
(J:1-0) to check the level of deuteration in the
inner core (the strongest peak -
offset +37.5
along the PRONAOS strip) in N2D+
(J:1-0) to check the level of deuteration in the
inner core (the strongest peak -
offset +37.5
![]() - was identified
afterwards). We found only a very weak signal (Fig. 8), the main
hyperfine component being only 70 mK. A hyperfine fit
was performed using the CLASS fitting routine MINIMIZE with the
HFS option
- was identified
afterwards). We found only a very weak signal (Fig. 8), the main
hyperfine component being only 70 mK. A hyperfine fit
was performed using the CLASS fitting routine MINIMIZE with the
HFS option![]() .
.
![\begin{figure}
\par\includegraphics[angle=-90,width=8.8cm,clip]{12859fg8.eps}
\end{figure}](/articles/aa/full_html/2010/04/aa12859-09/img33.png)
|
Figure 8:
Spectrum of N2D+ taken at
offset +25
|
| Open with DEXTER | |
4 Models
4.1 Density profile
The density radial distribution was derived from the MAMBO map emission
using a Wiener linear inversion method as described by Dupac & Giard (2002).
Considering the elongated distribution (along the RA axis), we
modelled the filament with a cylindrical geometry approximation, its
axis being in the plane of the sky and perpendicular to the PRONAOS
strip, as in Stepnik
et al. (2003). We also accounted for a temperature
inward decrease from 15 K to 8 K. This range was
inferred from the ![]() profile
of the filament (Stepnik
et al. 2003) combined with the predictions of either
the Zucconi
et al. (2001) or Bernard
et al. (1992) dust temperature models in cold cores.
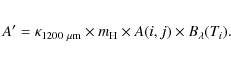
We discretized the cylinder into iso-density and iso-temperature rings,
and defined the array A to be
profile
of the filament (Stepnik
et al. 2003) combined with the predictions of either
the Zucconi
et al. (2001) or Bernard
et al. (1992) dust temperature models in cold cores.
We discretized the cylinder into iso-density and iso-temperature rings,
and defined the array A to be
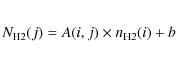
or
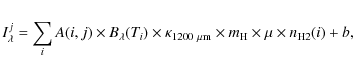
where (i,j) are, respectively, the indices of the rings and the lines of sight,

(cf. Dupac & Giard 2002), where
The most successful optimization was obtained using a ring thickness value of 50
![\begin{figure}
\par\includegraphics[angle=-90,width=12cm,clip,origin=rb]{12859fg9.eps}
\end{figure}](/articles/aa/full_html/2010/04/aa12859-09/img49.png)
|
Figure 9: Fit of the individual C18O (J:1-0) spectra along the PRONAOS cut. The histogram plot represents the data, the thick continuous curve, the model. A FWHM turbulent velocity of 0.11 km s-1 was used throughout the cut, which explains why the model lines are larger than the observations for the positive offsets. Offsets along the PRONAOS cut in arcseconds are given in the upper right corner of each spectrum. |
| Open with DEXTER | |
![\begin{figure}
\par\includegraphics[angle=-90,width=12cm,clip,origin=rb]{12859f10.eps}
\end{figure}](/articles/aa/full_html/2010/04/aa12859-09/img50.png)
|
Figure 10: Same as Fig. 9 for C18O (J:2-1) spectra. |
| Open with DEXTER | |
![\begin{figure}
\par\includegraphics[angle=-90,width=12cm,clip,origin=rb]{12859f11.eps}
\end{figure}](/articles/aa/full_html/2010/04/aa12859-09/img51.png)
|
Figure 11: Fit of the individual 13CO (J:1-0) spectra along the PRONAOS cut. The histogram plot represents the data, the thick continuous curve, the model. |
| Open with DEXTER | |
![\begin{figure}
\par\includegraphics[angle=-90,width=12cm,clip,origin=rb]{12859f12.eps}
\end{figure}](/articles/aa/full_html/2010/04/aa12859-09/img52.png)
|
Figure 12: Fit of the individual N2H+ (J:1-0) spectra along the PRONAOS cut. The histogram plot represents the data, the thick continuous curve, the model. Only the 3 central hyperfine structure components are displayed. A turbulent velocity of 0.068 km s-1 has been used. |
| Open with DEXTER | |
4.2 Line modeling
The density profile derived from the dust data was used as a first
estimate in our 1D line radiative transfer models but we
allowed the profile to change because the raw dust map is noisy and its
final resolution in the inversion method is only 50
![]() compared to the C18O (J:1-0)
24
compared to the C18O (J:1-0)
24
![]() and (J:2-1) 12
and (J:2-1) 12
![]() and because the dust properties are not strongly constrained and can
vary, therefore causing a typical uncertainty of a factor of 2
in the derived density.
and because the dust properties are not strongly constrained and can
vary, therefore causing a typical uncertainty of a factor of 2
in the derived density.
Table 2: The Monte Carlo cloud model used to fit the spectra (Figs. 7 and 9-12).
For all three species, 13CO, C18O,
and N2H+, we fit a
non-local thermodynamic equilibrium radiative transfer
Monte Carlo model and attempt to reproduce the spectra
(Figs. 9-12) and the
velocity-position diagram (Fig. 7). The
1D Monte Carlo model was originally developed by Bernes (1979), and
incorporates both microscopic turbulence and a radial velocity field.
It was subsequently modified to include rotation (Pagani & Breart de
Boisanger 1996) and a variant was developed to treat the
hyperfine structure of N2H+
(Pagani et al. 2007).
The 1D cloud parameters are shown in Table 2 and the species
abundances are traced as a function of radius in Fig. 13. Here the
model is spherical with a radius equal to the dust cylinder radius and
a rotation axis similar to the cylinder axis of the dust model, i.e.,
assumed to be aligned with the embedding filament elongation and
therefore perpendicular to the PRONAOS strip. The model data to be
compared with the observations are taken at the equator that is
considered to be a good approximation of a cylinder slice, as already
discussed in Pagani
et al. (2007) for a similar case. For the 13CO
emission, since our high spatial and velocity resolution strip only
extends across 6![]() and because the 13CO line is optically thick
and far more extended, it is difficult to develop a simple
1D model to reproduce and constrain the 30-m 13CO
observations (the POM-1 data are both too coarse and noisy for
this purpose). More generally, the cloud is not symmetrical and
therefore our 1D Monte Carlo model cannot reproduce
the various differences between positive and negative offsets. However,
we attempted to fit globally the observations and overall to use a
similar cloud description for the N2H+
and C18O line models. Though the 13CO
data are too difficult to reproduce with the
1D Monte Carlo code, we attempted to fit them as
well, at least to obtain some estimate of the physical
conditions in the outer parts to help explain the observations. From
the C18O and N2H+
data, we find that the cloud rotational axis could also be slightly
offset along the PRONAOS cut (about +12
and because the 13CO line is optically thick
and far more extended, it is difficult to develop a simple
1D model to reproduce and constrain the 30-m 13CO
observations (the POM-1 data are both too coarse and noisy for
this purpose). More generally, the cloud is not symmetrical and
therefore our 1D Monte Carlo model cannot reproduce
the various differences between positive and negative offsets. However,
we attempted to fit globally the observations and overall to use a
similar cloud description for the N2H+
and C18O line models. Though the 13CO
data are too difficult to reproduce with the
1D Monte Carlo code, we attempted to fit them as
well, at least to obtain some estimate of the physical
conditions in the outer parts to help explain the observations. From
the C18O and N2H+
data, we find that the cloud rotational axis could also be slightly
offset along the PRONAOS cut (about +12
![]() )
with respect to our reference position (which was defined somewhat
arbitrarily). The peak N2H+
integrated intensity is even farther away from the reference
position (+37.5
)
with respect to our reference position (which was defined somewhat
arbitrarily). The peak N2H+
integrated intensity is even farther away from the reference
position (+37.5
![]() )
but assuming the rotational axis to be this far does not fit with the
overall velocity profile. Despite the cloud extension on the positive
offset side being smaller than on the negative offset side, the fit is
relatively good, especially towards the centre of the cloud.
As mentioned above, we attempted to adjust the density profile
finding a solution that is close to the formula of Tafalla et al. (2002)
for the N2H+ - C18O
region
)
but assuming the rotational axis to be this far does not fit with the
overall velocity profile. Despite the cloud extension on the positive
offset side being smaller than on the negative offset side, the fit is
relatively good, especially towards the centre of the cloud.
As mentioned above, we attempted to adjust the density profile
finding a solution that is close to the formula of Tafalla et al. (2002)
for the N2H+ - C18O
region
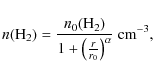
|
(1) |
where n0(H2) = 5
The CO+N2H+ model that we present here is by no means unique but represents a family of possible solutions. This family has remarkable features that are common to all solutions:
- 1.
- A peak column density of N(H2)
 2
2  1022 cm-2,
which is equivalent to
1022 cm-2,
which is equivalent to  20 mag (following Bohlin
et al. 1978). This is low compared to most other
cases with similar strong C18O depletion but
slightly higher than in L1498, which has a peak column density of N(H2)
1.3 1022 cm-2
(Shirley et al.
2005).
20 mag (following Bohlin
et al. 1978). This is low compared to most other
cases with similar strong C18O depletion but
slightly higher than in L1498, which has a peak column density of N(H2)
1.3 1022 cm-2
(Shirley et al.
2005).
- 2.
- A strong central depletion (
 30) of C18O.
- 3.
- C18O depletion that begins at a
density between 1.5 and 2 104 cm-3.
- 4.
- For both C18O lines (towards the
positive offsets) and the N2H+
line (for all offsets), the linewidth is so narrow that the
turbulence contribution to the width is negligible and defined to be

 68 m s-1. To our
knowledge, this has been the lowest turbulence reported for C18O lines.
The line width is mostly dominated by the thermal width and the
enlargement caused by macroscopic kinematics (rotation and infall).
68 m s-1. To our
knowledge, this has been the lowest turbulence reported for C18O lines.
The line width is mostly dominated by the thermal width and the
enlargement caused by macroscopic kinematics (rotation and infall).
- 5.
- The radial velocity is strongly constrained in the C18O envelope but not so much in the N2H+ internal part. However, a constant infall around 0.1 km s-1 is compatible with the data. No infall is not.
- 6.
- The rotational velocity decreases with increasing radius.
Solid rotation is therefore excluded and velocity dependences of the
type V

 with
with  provide good solutions.
- 7.
- The temperature pattern is indicative of a slightly higher
temperature in the N2H+
inner core (
 10 K)
than in the C18O outer core (8 K).
If correct this would resemble to the B68 case (Bergin et al. 2006).
10 K)
than in the C18O outer core (8 K).
If correct this would resemble to the B68 case (Bergin et al. 2006).
The modeling of the N2D+
(J:1-0) line implies a column density of 4
to 8 ![]() 1011 cm-2
depending on the chosen N2D+
abundance profile, which we are unable to constrain with only one
observation. The peak N2H+
column density is
1011 cm-2
depending on the chosen N2D+
abundance profile, which we are unable to constrain with only one
observation. The peak N2H+
column density is ![]() 2
2 ![]() 1013 cm-2
and therefore the deuterium enrichment is 2-4%. Compared to L183 (Pagani
et al. 2009b,2007), we identify a
similar deuteration level at similar densities indicating that the
evolutionary speed of the deuterium enrichment is probably similar and
therefore can be used to determine the age of the core.
1013 cm-2
and therefore the deuterium enrichment is 2-4%. Compared to L183 (Pagani
et al. 2009b,2007), we identify a
similar deuteration level at similar densities indicating that the
evolutionary speed of the deuterium enrichment is probably similar and
therefore can be used to determine the age of the core.
Beyond the core characterized by C18O
narrow lines, the envelope, as traced by 13CO,
is most accurately described by an almost constant density
(in the range 200-1000 cm-3)
and a large amount of turbulence (
![]() = 0.4 km s-1).
To follow its macroscopic velocity drift, we had to introduce
a counter-rotating pattern in the external layers of a constant
velocity of -0.3 km s-1.
We do not claim that the 13CO is indeed
rotating but this is the only way to approach the velocity profile of
this line with our model. Similarly, to reproduce the redshifted peak,
we had to introduce an expansion velocity
of 90 m s-1, which is
comparable in amplitude to the infall velocity of the core. The fit is
not perfect inasmuch as we were unable to centre the peak emission in
our model on the same position as in the observed position-velocity
diagram (Fig. 7)
but the fit bears some ressemblance to reality as shown in
Fig. 11.
The derived parameters are therefore reasonably close to the true
situation and this envelope is clearly decoupled from the core in terms
of density profile as much as in terms of turbulence and large-scale
motions. This region also has a very high abundance of 13CO
(6
= 0.4 km s-1).
To follow its macroscopic velocity drift, we had to introduce
a counter-rotating pattern in the external layers of a constant
velocity of -0.3 km s-1.
We do not claim that the 13CO is indeed
rotating but this is the only way to approach the velocity profile of
this line with our model. Similarly, to reproduce the redshifted peak,
we had to introduce an expansion velocity
of 90 m s-1, which is
comparable in amplitude to the infall velocity of the core. The fit is
not perfect inasmuch as we were unable to centre the peak emission in
our model on the same position as in the observed position-velocity
diagram (Fig. 7)
but the fit bears some ressemblance to reality as shown in
Fig. 11.
The derived parameters are therefore reasonably close to the true
situation and this envelope is clearly decoupled from the core in terms
of density profile as much as in terms of turbulence and large-scale
motions. This region also has a very high abundance of 13CO
(6 ![]() 10-6)
and an absence of C18O (<5
10-6)
and an absence of C18O (<5 ![]() 10-9,
an abundance of 1
10-9,
an abundance of 1 ![]() 10-8
is marginally consistant with the observations). The density is not
well constrained in the external envelope but since the 13CO abundance
is already high (its standard value is 1-2
10-8
is marginally consistant with the observations). The density is not
well constrained in the external envelope but since the 13CO abundance
is already high (its standard value is 1-2 ![]() 10-6,
i.e., 3 to 6 times less), the density cannot be lower
than we have assumed here since a lower density would produce an even
greater increase in the 13CO abundance.
In contrast, we could increase the density to lower the
abundance of 13CO, but it would become
higher than the density in the outermost C18O layers.
In the absence of any additional 13CO transitions,
it is difficult to correctly constrain the density and
abundance in these last, turbulent layers.
10-6,
i.e., 3 to 6 times less), the density cannot be lower
than we have assumed here since a lower density would produce an even
greater increase in the 13CO abundance.
In contrast, we could increase the density to lower the
abundance of 13CO, but it would become
higher than the density in the outermost C18O layers.
In the absence of any additional 13CO transitions,
it is difficult to correctly constrain the density and
abundance in these last, turbulent layers.
The collapsing core has a size of ![]() 3
3 ![]() 104 AU
in radius and contains a mass of
104 AU
in radius and contains a mass of ![]() 4
4 ![]() .
This size is larger than that of L1498, which was shown to be
the largest by 50% of the nearby prestellar cores mentioned in
the study by Shirley
et al. (2005). Our mass estimate is somewhat
approximate as the density of the N2H+
region is possibly overestimated but on the other hand, the core could
be slightly more extended than a sphere, and closer to a cylinder. The
estimate derived from the dust observations is similar but more poorly
constrained because of our lack of knowledge about the dust emissivity
and temperature in the core on scales smaller than the
PRONAOS resolution. The 13CO low
density filament contains at least 20
.
This size is larger than that of L1498, which was shown to be
the largest by 50% of the nearby prestellar cores mentioned in
the study by Shirley
et al. (2005). Our mass estimate is somewhat
approximate as the density of the N2H+
region is possibly overestimated but on the other hand, the core could
be slightly more extended than a sphere, and closer to a cylinder. The
estimate derived from the dust observations is similar but more poorly
constrained because of our lack of knowledge about the dust emissivity
and temperature in the core on scales smaller than the
PRONAOS resolution. The 13CO low
density filament contains at least 20 ![]() accounting only for the part along its main axis that covers the core.
Its diameter is 250 000 AU
or 1.25 pc.
accounting only for the part along its main axis that covers the core.
Its diameter is 250 000 AU
or 1.25 pc.
5 Discussion
Several properties of this area of the L1506 filament are remarkable and presently difficult to explain. The expanding and counter-drifting external envelope is one of them. One partially similar case has however been reported: Young et al. (1981) showed that the L1506 core as traced by C18O had a position/velocity profile gradient that had an opposite sense to the 12CO one, which they interpreted as a counter-rotating core (but they did not discuss the radial component). Contemporary theoretical work (Mouschovias & Paleologou 1979; Gillis et al. 1979) was invoked to explain this situation: a radial, frozen-in magnetic field perpendicular to the rotation axis could slow down the rotation of the cloud, but because the field remains anchored to the external regions, the magnetic torques do not vanish immediately and counter-rotation is induced in the core, which would be able to oscillate several times before coming to a halt. Whether this is truly the case here is unclear because 1) we are uncertain that the 13CO itself traces rotation; 2) the expansion of the 13CO envelope is not predicted by the model; and 3) we know nothing about the magnetic field inside this core (external parts have however been mapped, Moneti et al. 1984; Heiles 2000).
The strong and abrupt depletion of C18O
at relatively low density is another remarkable property. This is
similar to the L1498 case but in stark contrast to other very young
cores, such as L1495B, L1521B, and L1521E, which
exhibit no depletion despite a density that is typically
5 times higher (and possibly 10 times if He-N2H+
collisional coefficients indeed over-estimate the true density in
L1506C or if we compare to the L1498 peak density derived by Shirley et al. 2005).
Based mainly on this absence of depletion, these cores have been judged
to be young but it is unusual that after recently acquiring their
present density state, they show no kinematical sign of contraction. It
is thus conceivable that they are older than assumed and that the
absence of depletion could be due to another mechanism, such as strong
desorption, an ill-understood mechanism (Roberts et al. 2007).
It is understood that energetic cosmic ray impacts can desorb the most
volatile ices such as CO (Hasegawa & Herbst 1993;
Bringa
& Johnson 2004; Leger et al. 1985;
Roberts
et al. 2007). The desorption efficiency is inversely
correlated with the size of the grains because smaller grains are
easier to warm up. Therefore, the question arises of whether
or not cores such as L1495B have smaller grains than L1506C or
not and what the difference in size of these grains should be to allow
or prevent an efficient desorption of CO. As explained by Roberts et al. (2007),
all desorption mechanisms remain poorly known and it is presently
difficult to go further. However, if this explanation proves to be
valid, then one has yet to understand why grains coagulate in some
sources and not in others. Turbulence could be one of the main key
parameters involved in this differentiation between cores. Based on the
analyses of Chokshi
et al. (1993) and Poppe
& Blum (1997) works, Flower et al. (2005)
demonstrate that dust coagulation efficiency reaches a maximum for
turbulent velocities in the range 10-80 m s-1
(see their Fig. A.1), a condition that is hardly achieved even
in the most quiescent prestellar cores but fits the present case. In
contrast, L1521E shows no depletion, while the turbulence is
suprathermal (even for N2H+,
![]() =
0.27 km s-1, Tafalla & Santiago 2004,
a factor of 4 at least larger than
in L1506C). If the size of the grains in L1521E is not known,
large grains have been advocated to explain submillimetre emission in
L1506C. Stepnik
et al. (2003) compiled a model where the very small
grains, emitting at 60
=
0.27 km s-1, Tafalla & Santiago 2004,
a factor of 4 at least larger than
in L1506C). If the size of the grains in L1521E is not known,
large grains have been advocated to explain submillimetre emission in
L1506C. Stepnik
et al. (2003) compiled a model where the very small
grains, emitting at 60 ![]() m, disappear for offsets lower than r0=4
m, disappear for offsets lower than r0=4![]() from the centre, while the submm emissivity increases by a factor
of 3.4 because of the formation of fluffy aggregates. Their
observations were taken with an angular resolution of 2-3.5',
so the value of r0
could be lower and fit the extent (
from the centre, while the submm emissivity increases by a factor
of 3.4 because of the formation of fluffy aggregates. Their
observations were taken with an angular resolution of 2-3.5',
so the value of r0
could be lower and fit the extent (![]() 200
200
![]() )
of the low turbulence region in L1506C. Grain growth,
depletion, and desorption are certainly not completely understood at
the moment.
)
of the low turbulence region in L1506C. Grain growth,
depletion, and desorption are certainly not completely understood at
the moment.
The absence of C18O across 5/6th of the external envelope width as traced by the POM-1 13CO observations is another puzzle. The 13CO abundance itself seems to be higher than usual so that the 13CO/C18O ratio reaches 600-1200 over a large region. Although 13CO fractionation does exist, it is weak and does not seem to be able to explain this difference. More observations of the envelope (including 13CO (J:1-0) and (J:2-1) and very low noise C18O transitions) are needed to address this issue.
Clear traces of collapse among prestellar cores was found in a few cases. Lee et al. (1999,2004) observed a large number of asymmetrically blue profiles towards a sample of starless cores but they traced the CS kinematics with respect to N2H+ or DCO+ and, since CS is depleted inside the N2H+ region, they traced the inward motion of the envelope only. A few prestellar cores are indeed modeled with a collapsing core, the most well studied being L1506 (e.g., van der Tak et al. 2005; Williams et al. 1999; Tafalla et al. 2002), which was reported to clearly undergo a collapse from line profile fitting. Tafalla et al. (2004) also invoke the possibility of infall from the observations of two other cores, L1506 and L1506 despite the absence of a clear velocity gradient and Williams et al. (2006) found that L1506 has a profile reminiscent of L1544, which is also indicative of probable infall. This was confirmed by Lee et al. (2007) who also reported the infall of L1506. Here the amplitude of the inward motion of N2H+ is not strongly constrained but is clearly necessary to reproduce the velocity-profile plot: no infall at all is clearly the wrong result but the details of the radial velocity profile are uncertain. The inward motion is also clearly indicated by the C18O and C17O lines. It is the first time to our knowledge that these lines trace the collapse of a core. We understand that this is possible here because several favorable factors are met:
- 1.
- No CO isotopologues are present in the central part of the core, which clearly separates the front and rear moving layers as indicated by C17O.
- 2.
- No C18O in the extended envelope, which would have either hidden or blurred the faint variation in intensity between the blue and red emission that enable us to differentiate between expansion and contraction.
- 3.
- Low C18O velocity dispersion, which
increases the line opacity near unity (
 = 0.56,
  = 0.91).
Combined with the outwardly decreasing excitation temperature,
it allows for weak but measurable differential absorption
between the blue and red components.
= 0.91).
Combined with the outwardly decreasing excitation temperature,
it allows for weak but measurable differential absorption
between the blue and red components.
6 Conclusions
The large size of L1506C and its low density clearly indicate that it is not yet a prestellar core but its inward motion and its kinematical decoupling from the outer envelope are signs that it is in the process of turning into one. It is the first time that a low density core is clearly observed to collapse to form a prestellar core, both the kinematical and density status of L1498 being somewhat unclear. Two different evolutionary paths from normal clouds to prestellar cores seem to exist: one that begins with density enhancement first much before any depletion occurs and one that begins with depletion first. Two questions arise: what is the reason for this differentiation (turbulence via its action on grain growth, itself limiting the desorption capability of cosmic rays) and do both paths really produce standard prestellar cores? Coming observations with the Herschel Space Observatory will help us to address these questions and the nature of the dust inside this object.
We want to thank an anonymous referee for her/his fruitful comments which helped to improve the manuscript and P.F. Goldsmith for fruitful discussions. This research has made use of the SIMBAD database, operated at CDS, Strasbourg, France.
References
- Abergel, A., Boulanger, F., Mizuno, A., & Fukui, Y. 1994, ApJ, 423, L59 [NASA ADS] [CrossRef] [Google Scholar]
- Bergin, E. A., & Langer, W. D. 1997, ApJ, 486, 316 [NASA ADS] [CrossRef] [Google Scholar]
- Bergin, E. A., Maret, S., van der Tak, F. F. S., et al. 2006, ApJ, 645, 369 [NASA ADS] [CrossRef] [MathSciNet] [Google Scholar]
- Bernard, J. P., Boulanger, F., Desert, F. X., & Puget, J. L. 1992, A&A, 263, 258 [NASA ADS] [Google Scholar]
- Bernes, C. 1979, A&A, 73, 67 [NASA ADS] [Google Scholar]
- Bohlin, R. C., Savage, B. D., & Drake, J. F. 1978, ApJ, 224, 132 [NASA ADS] [CrossRef] [Google Scholar]
- Bringa, E. M., & Johnson, R. E. 2004, ApJ, 603, 159 [NASA ADS] [CrossRef] [Google Scholar]
- Caselli, P. 2002, Planet. Space Sci., 50, 1133 [NASA ADS] [CrossRef] [Google Scholar]
- Chokshi, A., Tielens, A. G. G. M., & Hollenbach, D. 1993, ApJ, 407, 806 [Google Scholar]
- Daniel, F., Dubernet, M.-L., Meuwly, M., Cernicharo, J., & Pagani, L. 2005, MNRAS, 363, 1083 [NASA ADS] [CrossRef] [Google Scholar]
- Dupac, X., & Giard, M. 2002, MNRAS, 330, 497 [NASA ADS] [CrossRef] [Google Scholar]
- Elias, J. H. 1978, ApJ, 224, 857 [NASA ADS] [CrossRef] [Google Scholar]
- Flower, D. R., Pineau Des Forêts, G., & Walmsley, C. M. 2005, A&A, 436, 933 [NASA ADS] [CrossRef] [EDP Sciences] [Google Scholar]
- Gillis, J., Mestel, L., & Paris, R. B. 1979, MNRAS, 187, 311 [NASA ADS] [Google Scholar]
- Hasegawa, T. I., & Herbst, E. 1993, MNRAS, 261, 83 [NASA ADS] [CrossRef] [Google Scholar]
- Heiles, C. 2000, AJ, 119, 923 [NASA ADS] [CrossRef] [Google Scholar]
- Hirota, T., Ito, T., & Yamamoto, S. 2002, ApJ, 565, 359 [NASA ADS] [CrossRef] [Google Scholar]
- Hirota, T., Maezawa, H., & Yamamoto, S. 2004, ApJ, 617, 399 [NASA ADS] [CrossRef] [Google Scholar]
- Kenyon, S. J., Dobrzycka, D., & Hartmann, L. 1994, AJ, 108, 1872 [Google Scholar]
- Keto, E., & Caselli, P. 2008, ApJ, 683, 238 [NASA ADS] [CrossRef] [Google Scholar]
- Klapper, G., Surin, L., Lewen, F., et al. 2003, ApJ, 582, 262 [NASA ADS] [CrossRef] [Google Scholar]
- Lada, C. J., Huard, T. L., Crews, L. J., & Alves, J. F. 2004, ApJ, 610, 303 [NASA ADS] [CrossRef] [Google Scholar]
- Lee, C. W., & Myers, P. C. 1999, ApJS, 123, 233 [NASA ADS] [CrossRef] [Google Scholar]
- Lee, C. W., Myers, P. C., & Tafalla, M. 1999, ApJ, 526, 788 [NASA ADS] [CrossRef] [Google Scholar]
- Lee, C. W., Myers, P. C., & Plume, R. 2004, ApJS, 153, 523 [NASA ADS] [CrossRef] [Google Scholar]
- Lee, S. H., Park, Y.-S., Sohn, J., Lee, C. W., & Lee, H. M. 2007, ApJ, 660, 1326 [NASA ADS] [CrossRef] [Google Scholar]
- Leger, A., Jura, M., & Omont, A. 1985, A&A, 144, 147 [NASA ADS] [Google Scholar]
- Maret, S., Bergin, E. A., & Lada, C. J. 2007, ApJ, 670, L25 [Google Scholar]
- Moneti, A., Pipher, J. L., Helfer, H. L., McMillan, R. S., & Perry, M. L. 1984, ApJ, 282, 508 [NASA ADS] [CrossRef] [Google Scholar]
- Mouschovias, T. C., & Paleologou, E. V. 1979, ApJ, 230, 204 [NASA ADS] [CrossRef] [Google Scholar]
- Myers, P. C., Mardones, D., Tafalla, M., Williams, J. P., & Wilner, D. J. 1996, ApJ, 465, L133+ [NASA ADS] [CrossRef] [Google Scholar]
- Nercessian, E., Castets, A., Benayoun, J. J., & Cernicharo, J. 1988, A&A, 189, 207 [NASA ADS] [Google Scholar]
- Onishi, T., Mizuno, A., Kawamura, A., Ogawa, H., & Fukui, Y. 1996, ApJ, 465, 815 [NASA ADS] [CrossRef] [Google Scholar]
- Ossenkopf, V., & Henning, T. 1994, A&A, 291, 943 [NASA ADS] [Google Scholar]
- Pagani, L., & Breart de Boisanger, C. 1996, A&A, 312, 989 [NASA ADS] [Google Scholar]
- Pagani, L., Bacmann, A., Motte, F., et al. 2004, A&A, 417, 605 [NASA ADS] [CrossRef] [EDP Sciences] [Google Scholar]
- Pagani, L., Pardo, J.-R., Apponi, A. J., Bacmann, A., & Cabrit, S. 2005, A&A, 429, 181 [NASA ADS] [CrossRef] [EDP Sciences] [Google Scholar]
- Pagani, L., Bacmann, A., Cabrit, S., & Vastel, C. 2007, A&A, 467, 179 [NASA ADS] [CrossRef] [EDP Sciences] [Google Scholar]
- Pagani, L., Daniel, F., & Dubernet, M.-L. 2009a, A&A, 494, 719 [NASA ADS] [CrossRef] [EDP Sciences] [Google Scholar]
- Pagani, L., Vastel, C., Hugo, E., et al. 2009b, A&A, 494, 623 [NASA ADS] [CrossRef] [EDP Sciences] [Google Scholar]
- Poppe, T., & Blum, J. 1997, Adv. Space Res., 20, 1595 [NASA ADS] [CrossRef] [Google Scholar]
- Roberts, J. F., Rawlings, J. M. C., Viti, S., & Williams, D. A. 2007, MNRAS, 382, 733 [NASA ADS] [CrossRef] [Google Scholar]
- Shirley, Y. L., Nordhaus, M. K., Grcevich, J. M., et al. 2005, ApJ, 632, 982 [NASA ADS] [CrossRef] [Google Scholar]
- Stepnik, B., Abergel, A., Bernard, J.-P., et al. 2003, A&A, 398, 551 [NASA ADS] [CrossRef] [EDP Sciences] [Google Scholar]
- Tafalla, M., & Santiago, J. 2004, A&A, 414, L53 [Google Scholar]
- Tafalla, M., Myers, P. C., Caselli, P., Walmsley, C. M., & Comito, C. 2002, ApJ, 569, 815 [NASA ADS] [CrossRef] [Google Scholar]
- Tafalla, M., Myers, P. C., Caselli, P., & Walmsley, C. M. 2004, A&A, 416, 191 [NASA ADS] [CrossRef] [EDP Sciences] [Google Scholar]
- van der Tak, F. F. S., Caselli, P., & Ceccarelli, C. 2005, A&A, 439, 195 [NASA ADS] [CrossRef] [EDP Sciences] [Google Scholar]
- Willacy, K., Langer, W. D., & Velusamy, T. 1998, ApJ, 507, L171 [NASA ADS] [CrossRef] [Google Scholar]
- Williams, J. P., Myers, P. C., Wilner, D. J., & di Francesco, J. 1999, ApJ, 513, L61 [NASA ADS] [CrossRef] [Google Scholar]
- Williams, J. P., Lee, C. W., & Myers, P. C. 2006, ApJ, 636, 952 [Google Scholar]
- Young, J. S., Goldsmith, P. F., Langer, W. D., & Wilson, R. W. 1981, ApJ, 251, L81 [NASA ADS] [CrossRef] [Google Scholar]
- Zucconi, A., Walmsley, C. M., & Galli, D. 2001, A&A, 376, 650 [NASA ADS] [CrossRef] [EDP Sciences] [Google Scholar]
Footnotes
- ... making
- Based on observations made with the IRAM-30 m. IRAM is supported by INSU/CNRS (France), MPG (Germany), and IGN (Spain).
- ... DIRBE
- Diffuse Infra Red Background Experiment, http://lambda.gsfc.nasa.gov
- ... IRAS
- Infra Red Astronomical Satellite, http://lambda.gsfc.nasa.gov
- ... PRONAOS
- PROgramme NAtional d'Observations Submillimétriques.
- ... telescope
- http://www.iram-institute.org/
- ... SIMBAD
- http://simbad.u-strasbg.fr/sim-fid.pl
- ... MAMBO
- MAx-Planck-Millimeter-BOlometer, see IRAM website.
- ... VESPA
- VErsatile Spectroscopic and Polarimetric Analyzer, see IRAM website.
- ... HERA
- HEterodyne Receiver Array, see IRAM website.
- ... POM-1
- Petite Opération Millimétrique.
- ... expanding
- There exists the alternative possibility that the blue peak is
stronger than the red peak because of a difference in column densities
between front and rear parts of the cloud. If this were the case in
such a manner that it would hide the cloud expansion, the difference in
column density between the two components would be 40%
in the optically thin limit (and even more with growing opacity).
Indeed, since the intensity difference is about 20% towards the
(0, 0) position in C18O (J:1-0),
it would have to be compensated twice to go from a stronger red
component (due to expansion combined with differential excitation)
to a weaker red component (as observed) and the effect would be
more pronounced for the (J:2-1) component. This possibility
seems therefore quite unlikely and even if the two sides of the cloud
have different column densities, contraction remains the most probable
explanation.
- ...option
- http://www.iram.fr/IRAMFR/GILDAS/
- ...(Shirley et al. 2005)
- In terms of the total dust amount and the peak density of L1498, note that Shirley et al. (2005) disagree with Tafalla et al. (2004). If we were to assume that the results of the latter authors be true, L1498 would be closer to a normal prestellar core than to a simple core. The discrepancy has been only partly explained by Shirley et al. (2005).
All Tables
Table 1: Telescope settings.
Table 2: The Monte Carlo cloud model used to fit the spectra (Figs. 7 and 9-12).
All Figures
|
|
Figure 1:
Dust emission at 1.2 mm as measured by MAMBO II. Resolution
was degraded to 30
|
| Open with DEXTER | |
| In the text | |
|
|
Figure 2:
Left: low resolution 13CO
(J:1-0) integrated intensity map of the
L1506 Taurus cloud filament (original data from Nercessian et al. 1988).
Contour levels are 0.5
to 4.5 K km s-1
in steps of 1 K km s-1.
The POM-1 2.5-m dish has a 4.5 |
| Open with DEXTER | |
| In the text | |
|
|
Figure 3: Spectra taken along the PRONAOS cut (see Fig. 2). The upper row shows the 13CO (J:1-0) spectra. The middle row shows the C18O (J:1-0) spectra. The lower row shows the N2H+ (J:1-0) spectra. The velocity scale is 6.5 to 8 km s-1 for 13CO and C18O, and 5.5 to 9 km s-1 for N2H+. Offsets increase from North-West to South-East. |
| Open with DEXTER | |
| In the text | |
|
|
Figure 4:
Integrated intensity of C18O and N2H+
(J:1-0) compared to the dust emission as measured by
MAMBO along the PRONAOS cut. MAMBO data are smoothed
to 40
|
| Open with DEXTER | |
| In the text | |
|
|
Figure 5:
Spectra of 13CO (dotted lines), C17O,
and C18O taken at 3 different positions
along the PRONAOS strip: in the middle and close to each side peak C18O
emission. The full width at half maximum is indicated for some
remarkably narrow lines. Only the C17O |
| Open with DEXTER | |
| In the text | |
|
|
Figure 6:
C18O (J:1-0) ( top)
and (J:2-1) ( bottom) spectra
(histogram plot) taken 25
|
| Open with DEXTER | |
| In the text | |
|
|
Figure 7:
Position-velocity plots along the PRONAOS cut. For each line, we show
the observations on the left and the model on the right with the same
contour levels. For N2H+,
we reproduce only the 3 inner hyperfine components. The dashed
line indicates the systemic velocity of the cloud. For 13CO
and C18O observations, the dotted contours
delineate interpolated data (data is missing for
offsets |
| Open with DEXTER | |
| In the text | |
|
|
Figure 8:
Spectrum of N2D+ taken at
offset +25
|
| Open with DEXTER | |
| In the text | |
|
|
Figure 9: Fit of the individual C18O (J:1-0) spectra along the PRONAOS cut. The histogram plot represents the data, the thick continuous curve, the model. A FWHM turbulent velocity of 0.11 km s-1 was used throughout the cut, which explains why the model lines are larger than the observations for the positive offsets. Offsets along the PRONAOS cut in arcseconds are given in the upper right corner of each spectrum. |
| Open with DEXTER | |
| In the text | |
|
|
Figure 10: Same as Fig. 9 for C18O (J:2-1) spectra. |
| Open with DEXTER | |
| In the text | |
|
|
Figure 11: Fit of the individual 13CO (J:1-0) spectra along the PRONAOS cut. The histogram plot represents the data, the thick continuous curve, the model. |
| Open with DEXTER | |
| In the text | |
|
|
Figure 12: Fit of the individual N2H+ (J:1-0) spectra along the PRONAOS cut. The histogram plot represents the data, the thick continuous curve, the model. Only the 3 central hyperfine structure components are displayed. A turbulent velocity of 0.068 km s-1 has been used. |
| Open with DEXTER | |
| In the text | |
![\begin{figure}
\par\includegraphics[angle=-90,width=8.8cm,clip]{12859f13.eps}
\end{figure}](/articles/aa/full_html/2010/04/aa12859-09/img57.png)
|
Figure
13: H2 density and molecular abundance (relative to H2) as a function of radius. |
| In the text | |
Copyright ESO 2010
Current usage metrics show cumulative count of Article Views (full-text article views including HTML views, PDF and ePub downloads, according to the available data) and Abstracts Views on Vision4Press platform.
Data correspond to usage on the plateform after 2015. The current usage metrics is available 48-96 hours after online publication and is updated daily on week days.
Initial download of the metrics may take a while.