| Issue |
A&A
Volume 512, March-April 2010
|
|
|---|---|---|
| Article Number | A82 | |
| Number of page(s) | 14 | |
| Section | Interstellar and circumstellar matter | |
| DOI | https://doi.org/10.1051/0004-6361/200912633 | |
| Published online | 09 April 2010 | |
Large scale magnetic fields in viscous resistive accretion disks
I. Ejection from weakly magnetized disks
G. C. Murphy1 - J. Ferreira2 - C. Zanni3
1 - Dublin Institute for Advanced Studies, 31 Fitzwilliam Place, Dublin 2, Ireland
2 -
Laboratoire d'Astrophysique de Grenoble, CNRS, Université Joseph Fourier, BP 53, 38041 Grenoble, France
3 -
INAF - Osservatorio Astronomico di Torino, Strada Osservatorio 20, Pino Torinese, Italy
Received 4 June 2009 / Accepted 21 January 2010
Abstract
Context. Cold steady-state disk wind theory from near
Keplerian accretion disks requires a large scale magnetic field at near
equipartition strength. However the minimum magnetization has never
been tested with time dependent simulations. We investigate the time
evolution of a Shakura-Sunyaev accretion disk threaded by a weak
vertical magnetic field. The strength of the field is such that the
disk magnetization falls off rapidly with radius.
Aims. Four 2.5D numerical simulations of viscous resistive
accretion disk are performed using the magnetohydrodynamic code PLUTO.
In these simulations, a mean field approach is used and turbulence is
assumed to give rise to anomalous transport coefficients (alpha
prescription).
Methods. The large scale magnetic field introduces only a small
perturbation to the disk structure, with accretion driven by the
dominant viscous torque. However, a super fast magnetosonic jet is
observed to be launched from the innermost regions and remains
stationary over more than 953 Keplerian orbits. This is the longest
accretion-ejection simulation ever carried out. The self-confined jet
is launched from a finite radial zone in the disk which remains
constant over time. Ejection is made possible because the magnetization
reaches unity at the disk surface, due to the steep density decrease.
However, no ejection is reported when the midplane magnetization
becomes too small. The asymptotic jet velocity remains nevertheless too
low to explain observed jets. This is because of the negligible power
carried away by the jet.
Results. Astrophysical disks with superheated surface layers
could drive analogous outflows even if their midplane magnetization is
low. Sufficient angular momentum would be extracted by the turbulent
viscosity to allow the accretion process to continue. The magnetized
outflows would be no more than byproducts, rather than a fundamental
driver of accretion. However, if the midplane magnetization increases
towards the center, a natural transition to an inner jet dominated disk
could be achieved.
Key words: accretion, accretion disks - magnetohydrodynamics (MHD) - stars: formation - ISM: jets and outflows - galaxies: nuclei - galaxies: jets
1 Introduction
Accretion disks are commonly found in young stars, active galactic nuclei, cataclysmic variables and microquasars. In order to allow material to accrete onto a central object, it is necessary to lose some angular momentum in an efficient way. This is possible in a disk in one of two ways, either by radial outward transport in a disk by turbulent transport (Lynden-Bell & Pringle 1974; Shakura & Sunyaev 1973) or spiral waves (Tagger & Pellat 1999), or vertical transport upwards out of the disk in a jet (Blandford & Payne 1982).
Two extreme possible disk structures can then be identified, corresponding to each of these two processes of angular momentum removal.
The Jet Emitting Disk (hereafter JED) is threaded by a large
scale magnetic field of bipolar topology driving a jet (defined here as
super-fast magnetosonic flow). The dominant torque in the JED
is magnetic, due to the large braking lever arm of the jet, defined by
a length scale equivalent to the Alfvén radius (Pelletier & Pudritz 1992).
The pioneering jet model by Blandford & Payne (1982)
establishes a relationship between the mass loading and the magnetic
lever arm of magnetocentrifugally driven outflows. But the magnetic
field strength was left unconstrained, so in principal any
magnetization at the disk surface could drive a low-enthalpy outflow.
The reason lies in the fact that an ideal MHD jet model assumes the
mass
loss and does not compute it as function of the disk parameters. This
was precisely the goal of semi-analytical studies done by e.g. Ferreira & Pelletier (1995) and Ferreira (1997), where
the disk structure has been consistently computed: these authors showed that steady-state cold
jets can be produced only with a vertical field close to equipartition.
A few numerical experiments tested the accretion-ejection connection in
a consistent way: axisymmetric magneto-hydrodynamic (MHD) simulations
of resistive
accretion disks reporting the production of self-confined, quasi-steady
super-fast jets (Casse & Keppens 2002; Zanni et al. 2007; Tzeferacos et al. 2009; Casse & Keppens 2004)
confirmed most of the results obtained with semi-analytical models. They were however done with a large disk magnetization![]() , in the range
, in the range
![]() .
The inner regions of the disk from whence jets are observed to be
emitted are expected to be JED-like. In the specific case of outflows
from young stars, extrapolation of slitless images of Class II jets
have constrained the launching region to be confined to a zone of
radial extent
.
The inner regions of the disk from whence jets are observed to be
emitted are expected to be JED-like. In the specific case of outflows
from young stars, extrapolation of slitless images of Class II jets
have constrained the launching region to be confined to a zone of
radial extent ![]() a few AU close to the centre of the disk (Hartigan et al. 2004; Cabrit 2007).
a few AU close to the centre of the disk (Hartigan et al. 2004; Cabrit 2007).
The outer regions are expected to behave more like the well studied standard accretion disk, hereafter SAD (Frank et al. 2002; Shakura & Sunyaev 1973). Here the characteristic lengthscale over
which the viscous torque is exerted is of the order of
![]() ,
where
,
where
![]() measures the level of the turbulence. Such a turbulence is assumed to arise from the development of magnetic
instabilities that are triggered in the disk whenever a magnetic field is present (Balbus & Hawley 1991). This field must however be below equipartition strength (namely
measures the level of the turbulence. Such a turbulence is assumed to arise from the development of magnetic
instabilities that are triggered in the disk whenever a magnetic field is present (Balbus & Hawley 1991). This field must however be below equipartition strength (namely
![]() )
to
avoid the stabilizing effect of the magnetic tension. Therefore, the
high magnetization required by a JED impedes the development of disk
turbulence which is however required to support
a steady launching: that would leave only a very tiny parameter space
for stationary ejection to take place.
The SAD-JED structure has been put forward in several papers, e.g. Ferreira et al. (2006); Combet & Ferreira (2008); Ferreira (2008).
)
to
avoid the stabilizing effect of the magnetic tension. Therefore, the
high magnetization required by a JED impedes the development of disk
turbulence which is however required to support
a steady launching: that would leave only a very tiny parameter space
for stationary ejection to take place.
The SAD-JED structure has been put forward in several papers, e.g. Ferreira et al. (2006); Combet & Ferreira (2008); Ferreira (2008).
The study of low magnetization accretion regimes has been attempted making use of fully 3D global simulations of accretion disks, threaded by a weak large scale magnetic field. MRI sets in and accretion is quickly established (Hawley & Balbus 2002). The remarkable result is that outflows are also produced (Igumenshchev et al. 2003), especially when the imposed field is of bipolar topology (Beckwith et al. 2009). However, many questions remain open: What controls the mass loss in these simulations? Will the outflowing plasma become a self-confined jet? Is grid resolution enough to properly describe the turbulent cascade? The fact is that it is still impossible to properly follow turbulence while solving for the long term evolution of large scale systems.
As a consequence, the question of super-fast magnetosonic jet
formation from weakly magnetized disks is still open. In this paper we
address this issue using 2.5D numerical MHD simulations
based on a mean field approximation. We explore the accretion-ejection
processes from a quasi-standard accretion disk where the magnetization
is very low (smaller than 10-3).
Since the magnetic field is low, we assume that turbulence triggered by
the MRI is indeed present but that it provides mainly anomalous
transport coefficients: a viscosity
![]() and a magnetic
diffusivity
and a magnetic
diffusivity
![]() .
On the other hand, we do not expect to observe any MRI feature (such as
channel flows for instance) in our simulation because of the presence
of explicit viscosity and magnetic diffusivity effects. While
measurements of the turbulent viscosity in MRI induced turbulence have
been extensively reported in the literature, it is only very recently
that such a work has been done for the turbulent magnetic diffusivity (Guan & Gammie 2009; Lesur & Longaretti 2009). In particular Lesur & Longaretti (2009) showed that the turbulent magnetic diffusion scales like a resistivity tensor with dominant diagonal
terms. Also, as a first approximation, an isotropic value can be safely used. Finally, the effective Prandtl number
.
On the other hand, we do not expect to observe any MRI feature (such as
channel flows for instance) in our simulation because of the presence
of explicit viscosity and magnetic diffusivity effects. While
measurements of the turbulent viscosity in MRI induced turbulence have
been extensively reported in the literature, it is only very recently
that such a work has been done for the turbulent magnetic diffusivity (Guan & Gammie 2009; Lesur & Longaretti 2009). In particular Lesur & Longaretti (2009) showed that the turbulent magnetic diffusion scales like a resistivity tensor with dominant diagonal
terms. Also, as a first approximation, an isotropic value can be safely used. Finally, the effective Prandtl number
![]() ,
given by the ratio of turbulent viscosity and diffusivity,
has been found to be of order unity.
The mean field approximation has been successfully employed in a number of semi-analytical (e.g. Rothstein & Lovelace 2008; Li 1995; Casse & Ferreira 2000a; Ferreira & Pelletier 1995; Ogilvie & Livio 2001) and numerical applications (e.g. von Rekowski et al. 2003; Meliani et al. 2006; Casse & Keppens 2002; Romanova et al. 2009; Zanni et al. 2007; Küker et al. 2003)
related to the study of magnetized accretion-ejection flows. Beside
having a precise control of the diffusive and transport phenomena, the
numerical experiments based on this approach provide laminar flow
solutions which can be compared to semi-analytical models.
,
given by the ratio of turbulent viscosity and diffusivity,
has been found to be of order unity.
The mean field approximation has been successfully employed in a number of semi-analytical (e.g. Rothstein & Lovelace 2008; Li 1995; Casse & Ferreira 2000a; Ferreira & Pelletier 1995; Ogilvie & Livio 2001) and numerical applications (e.g. von Rekowski et al. 2003; Meliani et al. 2006; Casse & Keppens 2002; Romanova et al. 2009; Zanni et al. 2007; Küker et al. 2003)
related to the study of magnetized accretion-ejection flows. Beside
having a precise control of the diffusive and transport phenomena, the
numerical experiments based on this approach provide laminar flow
solutions which can be compared to semi-analytical models.
In Sect. 2, we describe the numerical method used, the boundary and initial conditions. Section 3 is devoted to the description and discussion of the results obtained. Surprisingly, super-fast jets are indeed obtained from a finite disk region and remain stable for a time span never previously achieved in the literature. Section 4 summarizes our findings and, in a companion paper (Murphy et al., in prep), we will examine the long standing issue of the magnetic field redistribution within the disk on long (accretion) time scales.
2 Numerical method
The full visco-resistive MHD equations in axial symmetry are evolved in time using the publicly available numerical code PLUTO (Mignone et al. 2007).
The solved equations are: the continuity equation
|
(1) |
the conservation of momentum equation
![\begin{displaymath}\frac{\partial}{\partial t}\left( \rho \vec u \right) +\nabla...
...verline{\vec T}}} \right] + \rho \vec \nabla \Phi_{\rm G} =0 ;
\end{displaymath}](/articles/aa/full_html/2010/04/aa12633-09/img31.png)
|
(2) |
the induction equation
|
(3) |
the conservation of energy equation
![\begin{displaymath}\frac{\partial E}{\partial t} +\nabla \cdot \left[ \left( E +...
... - \vec{u} \cdot {\overline
{\overline{\vec T}}} \right] = S ,
\end{displaymath}](/articles/aa/full_html/2010/04/aa12633-09/img33.png)
|
(4) |
where
|
(5) |
and the total pressure (thermal and magnetic) is

|
(6) |
The equations are written and solved in dimensionless form, thus without
![\begin{displaymath}{\overline {\overline {\vec T}}} = \eta_{\rm v} \left[ \left(...
...- \frac{2}{3}\left(\nabla\cdot\vec{u}\right) \vec{I} \right] ,
\end{displaymath}](/articles/aa/full_html/2010/04/aa12633-09/img46.png)
|
(7) |
where
As stressed above, we follow a mean field approach where the
turbulence is crudely modeled by mere transport coefficients: a
viscosity
![]() and a magnetic diffusivity
and a magnetic diffusivity
![]() .
Consistently with this approximation, a Shakura & Sunyaev (1973) alpha prescription is then employed. This assumes that the viscosity is proportional to the heightscale of
the disk, h, and some characteristic velocity, in this case the sound speed,
.
Consistently with this approximation, a Shakura & Sunyaev (1973) alpha prescription is then employed. This assumes that the viscosity is proportional to the heightscale of
the disk, h, and some characteristic velocity, in this case the sound speed, ![]() ,
namely
,
namely

|
(8) |
We assume that the disk is not flat, but will have initially a constant aspect ratio
Consistently with the recent Lesur & Longaretti (2009) results, we assume that the effective magnetic Prandtl number
![]() is of
order unity: for simplicity we set
is of
order unity: for simplicity we set
![]() in all simulations. Again, we stress that this is a strong
simplification of highly complex phenomena but also an
unavoidable price to pay if one seeks for long term evolution of global
systems, such as accretion disks and their related jets. With a
constant
in all simulations. Again, we stress that this is a strong
simplification of highly complex phenomena but also an
unavoidable price to pay if one seeks for long term evolution of global
systems, such as accretion disks and their related jets. With a
constant
![]() ,
the viscosity and resistivity will follow the same radial and vertical
profiles. They decrease smoothly with height until they become
negligible, allowing a transition to
a magnetized ``corona'' in ideal MHD regime. Since MRI induced
turbulence is quenched when the magnetic field becomes close to
equipartition (Balbus & Hawley 1991), there will be a height where
the accretion flow cannot be turbulent anymore (Rothstein & Lovelace 2008). For simplicity, we assume that it corresponds to the disk surface (see Appendix A). We thus follow
Casse & Keppens (2002,2004) and Zanni et al. (2007) in neglecting the turbulent viscosity and turbulent resistivity in the highly magnetised corona.
,
the viscosity and resistivity will follow the same radial and vertical
profiles. They decrease smoothly with height until they become
negligible, allowing a transition to
a magnetized ``corona'' in ideal MHD regime. Since MRI induced
turbulence is quenched when the magnetic field becomes close to
equipartition (Balbus & Hawley 1991), there will be a height where
the accretion flow cannot be turbulent anymore (Rothstein & Lovelace 2008). For simplicity, we assume that it corresponds to the disk surface (see Appendix A). We thus follow
Casse & Keppens (2002,2004) and Zanni et al. (2007) in neglecting the turbulent viscosity and turbulent resistivity in the highly magnetised corona.
In a real accretion disk, the local heating due to turbulence (here
crudely modeled by alpha prescriptions for resistivity and viscosity)
would be balanced by both turbulent transport and
radiative cooling. While the former cooling term needs full 3D
calculations, the latter can be done in 2D but requires radiative
transfer. Both effects are far beyond the scope of the present
work. Hence, by including a ``cooling'' function ![]() such that
such that
![\begin{displaymath}L_{\rm c} = \nu_{\rm m} J^2 + \frac{1}{2\eta_{\rm v}} \left[ ...
..._{\phi\phi}^2+ 2 (T_{rz}^2+T_{r\phi}^2+T_{z\phi}^2 ) \right] ,
\end{displaymath}](/articles/aa/full_html/2010/04/aa12633-09/img56.png)
|
(9) |
we can exactly balance both resistive and viscous heating terms. Our disk evolution is therefore adiabatic despite the presence of transport coefficients within the disk. This is certainly a caveat, shared by most today MHD simulations, and deserves further investigation. On the other hand, it allows to avoid in a simple way the otherwise unavoidable (and unphysical) vertical expansion of the disk when heating is present without any kind of cooling. A static atmosphere in pressure equilibrium is set above the disk and a large scale magnetic field is superimposed in the whole domain.
To set the initial magnetic field, we use the magnetic flux function ![]() such that
such that
![]() .
We take the particular form
.
We take the particular form
|
(10) |
where
![\begin{figure}
\par\includegraphics[width=11.7cm,clip]{12633c01.eps}
\end{figure}](/articles/aa/full_html/2010/04/aa12633-09/img65.png)
|
Figure 1:
Log of mass density at times a)
|
| Open with DEXTER | |
The MHD system of equations has been solved numerically exploiting the
MHD module provided with PLUTO. The code has been
configured to perform second-order piecewise linear reconstruction of
primitive variables, with a Van Leer limiter for the density and
magnetic field components and a minmod limiter for the thermal pressure
and velocity components. To compute the intercell fluxes, a HLL Riemann
solver has been employed (Harten et al. 1983),
while second order in time has been achieved using a Runge-Kutta scheme.
The solenoidal condition,
![]() ,
is preserved using the constrained transport method (Evans & Hawley 1988).
The viscous and resistive terms have been treated explicitly, using a
second-order finite difference approximation for the dissipative fluxes
and checking the diffusive timestep.
,
is preserved using the constrained transport method (Evans & Hawley 1988).
The viscous and resistive terms have been treated explicitly, using a
second-order finite difference approximation for the dissipative fluxes
and checking the diffusive timestep.
A uniform resolution grid of 512 by 1536 cells is used. This describes a domain of 40r0 by 120r0, where r0 is the inner radius of the disk. An outer, stretched grid is extended for a further 512 cells in the radial direction and 1536 in the vertical direction, thus describing in total a region 280r0 by 840r0. To examine the effects of a higher resolution (see Sect. 3.5), the same grid is used again but this time only describing a region of 5r0 by 15r0, with a logarithmically stretched grid outside this region 35r0 by 105r0. A disadvantage of higher resolution is that the number of timesteps to reach accretion timescales becomes prohibitive.
The boundary conditions are axial symmetry on the rotation axis and equatorial symmetry for the disk midplane. The upper r and z boundaries border on a logarithmically stretched grid which ensures
that the magnetized outflow never reaches the boundaries. The ghost cells at the upper r and z
boundaries are set to equal the values inside the domain (the numerical
approximation to an
``outflow'' boundary condition). The gravitational potential has a
singularity at the origin, so a rectangular portion of the simulation
close to the origin is excluded, as in
Casse & Keppens (2002). The
right boundary of the rectangular region is a sink and the upper
boundary injects a small amount of material into the grid at the escape
velocity (with density 1.1
times the local initial density). This keeps the axis sufficiently
dense to ensure that unphysically low densities are not produced on the
axis by the Lorentz force. For the poloidal magnetic field
the boundary condition can be expressed in terms of the toroidal
electric field, ![]() .
Assuming flux is not advected into the central object, we impose
.
Assuming flux is not advected into the central object, we impose ![]() .
.
Throughout the paper the distances are expressed in units of r0, which is the inner disk radius in the simulation. Velocities have been normalized on the Keplerian speed at r0,
![]() .
Densities are expressed in units of
.
Densities are expressed in units of
![]() ,
the initial disk density at its inner radius. The times are in units of the Keplerian orbital period
,
the initial disk density at its inner radius. The times are in units of the Keplerian orbital period
![]() .
Pressures are given in units of
.
Pressures are given in units of
![]() while the magnetic field is expressed in units of
while the magnetic field is expressed in units of
![]() .
.
For ease of reproducibility, the C subroutines defining initial conditions and boundary conditions are available from the authors on request. The numerical code PLUTO is publicly available from the URL http://plutocode.to.astro.it.
3 Ejection from weakly magnetized disks
3.1 Global description
![\begin{figure}
\par\includegraphics[width=9cm,clip]{12633f02.eps}
\end{figure}](/articles/aa/full_html/2010/04/aa12633-09/img74.png)
|
Figure 2:
Poloidal cross section showing various zones at a time
|
| Open with DEXTER | |
When the simulations starts in the first visible phenomenon is the triggering of the familiar vertical torsional Alfvén wave (Mouschovias & Paleologou 1980; Ouyed & Pudritz 1997). It is due to the differential rotation between the Keplerian disk and the initially non rotating atmosphere. But after a few inner disk rotations, a proper MHD outflow is launched from the disk, developing a bow shock and compressing the ambient material and the preceding torsional flow. Figure 1 shows a plot of the jet density in the poloidal plane together with the fast and Alfvén surfaces and magnetic field lines. A superfast jet is launched within a relatively narrow region at the disk surface up to r=5. Matter launched from this region crosses the slow and Alfvén surfaces close to the disk surface and is accelerated up to the fast magnetosonic surface.
Along the z direction, the numerical simulation can be
characterised as divided into two main zones, a resistive zone, where
resistive effects are important (the disk), and an ideal MHD zone,
where ideal MHD is strictly enforced (the jet and atmosphere). The disk
surface could be defined as the altitude where all transport
coefficients vanish. We choose rather to define the disk surface as the
altitude where the radial velocity component vanishes, marking
therefore a clear transition between underlying accreting layers (ur<0) and outflowing upper layers (ur>0).
Figure 2 shows these various surfaces at the final time
![]() .
Note however that they do not evolve much over time as it can be seen in Fig. 1.
.
Note however that they do not evolve much over time as it can be seen in Fig. 1.
This result is unexpected since the normal requirement for a steady cold MHD disk wind is a near equipartition midplane magnetization (Ferreira & Pelletier 1995). A second surprising feature is that the outflow is launched from a clearly defined region centrally located in the disk that does not evolve from the entire disk region, even after 953 disk rotations. This is in contrast to the previous results of Zanni et al. (2007) where, as the simulation evolves in time, the outflowing region moves outward on the Keplerian timescale. In fact, the global accretion-ejection configuration exhibits three distinct zones in the the radial direction. zone I corresponds to the innermost radii where anchored field lines give rise to a super-fast jet, namely from r=1 to r= 5. Then an intermediate zone gives birth to a sub-fast but still super-Alfvénic outflow. zone II goes from r= 5 to r= 13. Such a zone is expected to be unsteady as any FM wave can travel upstream. Finally, the last zone goes from r=13 up to the outermost radius and corresponds to negligible outflowing material that remains always sub-Alfvénic.
This is the longest accretion disk simulation ever done so far (953 inner periods) where the jet remains steady. Figure 3 shows the accretion (measured on one half disk thickness) and
ejection (in one jet) rates as well as their ratio plotted over time.
![]() is computed at the disk surface, defined by the height where the poloidal velocity reaches zero, and from a radius
r=1.4 to r=5.0.
As can be seen from the figure, the ejection to accretion mass loss is
approximately 7%. While smaller than that obtained for a disk with a
larger magnetization, this mass loss is by no means negligible. We also
inject a small amount of mass
is computed at the disk surface, defined by the height where the poloidal velocity reaches zero, and from a radius
r=1.4 to r=5.0.
As can be seen from the figure, the ejection to accretion mass loss is
approximately 7%. While smaller than that obtained for a disk with a
larger magnetization, this mass loss is by no means negligible. We also
inject a small amount of mass
![]() at the surface of the internal boundary which is of the order of 1% of
at the surface of the internal boundary which is of the order of 1% of
![]() and thus negligible when compared to
and thus negligible when compared to
![]() .
.
![\begin{figure}
\par\includegraphics[width=8cm,clip]{12633f03.eps}
\end{figure}](/articles/aa/full_html/2010/04/aa12633-09/img77.png)
|
Figure 3:
Time evolution of the ejection rate ( top), calculated by integrating the mass flux over the super-fast region only, half disk accretion rate ( middle) measured at the inner radius and the ejection to accretion rate ratio ( down). After an initial transient phase that lasted up to 200
|
| Open with DEXTER | |
The accretion power is computed as the difference between the flux of mostly mechanical energy
![]() entering the disk at its outer edge
and leaving it at its inner edge, namely
entering the disk at its outer edge
and leaving it at its inner edge, namely
|
(11) |
where the integration is performed on a vertical section of the disk. The jet power is calculated as the sum of all energy fluxes (mechanical and Poynting) leaving the disk,
|
(12) |
where
|
(13) |
|
(14) |
Here, the integration has been made in a control volume defined by the inner radius
The theoretical global energy budget should then be
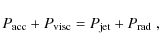
|
(15) |
where
Table 1: Viscous, accretion, mechanical, kinetic powers and MHD Poynting flux.
![\begin{figure}
\par\includegraphics[width=7.8cm,clip]{12633f04.eps}
\end{figure}](/articles/aa/full_html/2010/04/aa12633-09/img96.png)
|
Figure 4:
Poloidal velocity normalized to the Keplerian velocity at the footpoint along a magnetic field surface. The time is 953.3
|
| Open with DEXTER | |
The jet becomes super-SM very soon, almost at the disk surface and reaches the Alfvén speed at an altitude ![]() significantly smaller than the corresponding Alfvén radius
significantly smaller than the corresponding Alfvén radius ![]() (Fig.
2). This is again in strong contrast with self-similar cold jet solutions where
(Fig.
2). This is again in strong contrast with self-similar cold jet solutions where
![]() (Ferreira 1997). The flow then reaches its asymptotic velocity soon after
the fast magnetosonic surface, which is a maximum of about
(Ferreira 1997). The flow then reaches its asymptotic velocity soon after
the fast magnetosonic surface, which is a maximum of about ![]() 1.2 times the Keplerian value at the disk midplane (see Fig. 4).
Thus the type of jet produced here cannot be
responsible for very high velocity Herbig-Haro jets for example. The
maximum asymptotic velocity of a cold super-Alfvénic outflow anchored
at r0 is
1.2 times the Keplerian value at the disk midplane (see Fig. 4).
Thus the type of jet produced here cannot be
responsible for very high velocity Herbig-Haro jets for example. The
maximum asymptotic velocity of a cold super-Alfvénic outflow anchored
at r0 is
![]() ,
where
,
where
![]() is the magnetic lever arm parameter. It is possible to estimate
is the magnetic lever arm parameter. It is possible to estimate ![]() using the ratio:
using the ratio:
|
(16) |
In our case we derive a
3.2 The SAD structure
Despite the presence of an outflow (be it a super-FM self-confined jet or only super-A flow), the disk structure strongly resembles that of a standard accretion disk.
Most of the released power is radiated away: this implies that
the main dominant torque is the viscous one. Accretion proceeds
therefore throughout the disk with a Reynolds number of order unity.
The
value of the accretion Mach number
![]() at z=0 is a good test as its fiducial value in a SAD should be of the order of
at z=0 is a good test as its fiducial value in a SAD should be of the order of
![]() (Rózyczka et al. 1994). Figure
5 shows the radial profile of
(Rózyczka et al. 1994). Figure
5 shows the radial profile of
![]() at a time =953
at a time =953
![]() .
The theoretical approximation is very close to the simulated one, up to
a factor of about two. This is
very reasonable given the fact that the actual expression of the torque
involves radial derivatives. The action of the jet is therefore totally
negligible on midplane accretion.
.
The theoretical approximation is very close to the simulated one, up to
a factor of about two. This is
very reasonable given the fact that the actual expression of the torque
involves radial derivatives. The action of the jet is therefore totally
negligible on midplane accretion.
| Figure 5:
Ratio of midplane radial accretion sonic Mach number |
|
| Open with DEXTER | |
![\begin{figure}
\par\includegraphics[width=8.5cm,clip]{12633f06.eps}
\end{figure}](/articles/aa/full_html/2010/04/aa12633-09/img109.png)
|
Figure 6:
Vertical density profiles at r=2.4,5.5, and r=14.1,
normalized to their midplane value. At the inner radius, the initial
steep gradient has been flattened out. This is a signature of mass loss
from the disk. The time is at 953
|
| Open with DEXTER | |
Now, let ![]() be
the ratio of the magnetic (jet) to the viscous torque averaged over the
disk thickness. Since most of the available power is stored into
rotation in a thin accretion disk, the
fact that the jet carries a tiny fraction of the accretion power is
directly related to a negligible torque on the bulk of the disk mass.
Analytically, this may be written
be
the ratio of the magnetic (jet) to the viscous torque averaged over the
disk thickness. Since most of the available power is stored into
rotation in a thin accretion disk, the
fact that the jet carries a tiny fraction of the accretion power is
directly related to a negligible torque on the bulk of the disk mass.
Analytically, this may be written
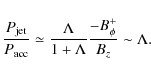
|
(17) |
At each radius within zone I, we vertically integrate the torques and obtain thereby a distribution
Although the action of the jet is negligible on the equatorial accretion motion, it has some impact on the disk vertical structure. This is illustrated for instance in Fig. 6 where the density profile is shown at different radii. The profiles have been normalized to the midplane density and plotted against z/h(r) where h(r) is the local thermal heightscale. Clearly, the profile located at r=2.4, that is within the ejecting region, becomes flatter than that from r=14.1 (outside the ejecting zone), has a result of the mass loss. Notice also the dramatic decrease in density of about four decades at the disk surface. We shall come back to this feature later on.
3.3 Electric currents
Understanding the behavior of electric currents is the key point in accretion-ejection theory. Figure 7 shows a zoom of the ejecting regions I and II at
![]() .
The Alfvén
(dashed) and Fast (dotted line) critical surfaces are shown along with the poloidal electric current lines
.
The Alfvén
(dashed) and Fast (dotted line) critical surfaces are shown along with the poloidal electric current lines
![]() (blue). Globally, some current enters the disk at its inner edge (Jz
<0) and flows
outwardly within the disk. In zones I and II where ejection takes
place, current lines are closed within the jet. The crossing of this
poloidal current through poloidal field lines results in jet
confinement and acceleration. In zone III where there is no jet,
thus much less plasma, there is almost no current flowing there.
(blue). Globally, some current enters the disk at its inner edge (Jz
<0) and flows
outwardly within the disk. In zones I and II where ejection takes
place, current lines are closed within the jet. The crossing of this
poloidal current through poloidal field lines results in jet
confinement and acceleration. In zone III where there is no jet,
thus much less plasma, there is almost no current flowing there.
![\begin{figure}
\par\includegraphics[width=8.5cm,clip]{12633c07.eps}\vspace*{-1mm}
\end{figure}](/articles/aa/full_html/2010/04/aa12633-09/img115.png)
|
Figure 7:
Snapshot at
|
| Open with DEXTER | |
Let us have a look at the vertical profiles of the magnetic field components and electric current density at three radii located within the three previously defined zones (Fig. 8 ). In all three zones, the disk surface can be easily detected as it is the locus where (i) the radial component undergoes a huge increase and (ii) the toroidal field abruptly changes its behaviour.
Throughout all the disk, the dominant toroidal current density ![]() is located at the disk surface not at the disk midplane as assumed in the infinitely thin disk approximation. This is
easy to understand from Ohm's law in resistive MHD. Indeed, neglecting the contribution of the vertical velocity one gets
is located at the disk surface not at the disk midplane as assumed in the infinitely thin disk approximation. This is
easy to understand from Ohm's law in resistive MHD. Indeed, neglecting the contribution of the vertical velocity one gets
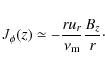
|
(18) |
Unless the vertical profile of ur strictly follows that of the magnetic diffusivity, the vertical decrease of
The vertical profile of the toroidal field ![]() is controlled by the radial current density Jr. The profile Jr(z) is very interesting: contrary to self-similar solutions, most of the
poloidal current is flowing at the disk surface and not at the disk midplane. Because of the small value of Bz,
the unipolar induction effect is small and so is the induced radial
current. However,
that current becomes much larger towards the disk surface, mostly
because of the vertical decrease of the resistivity. This results in a
magnetic shear
is controlled by the radial current density Jr. The profile Jr(z) is very interesting: contrary to self-similar solutions, most of the
poloidal current is flowing at the disk surface and not at the disk midplane. Because of the small value of Bz,
the unipolar induction effect is small and so is the induced radial
current. However,
that current becomes much larger towards the disk surface, mostly
because of the vertical decrease of the resistivity. This results in a
magnetic shear
![]() that goes from 2.25 (zone I)
to 6.7 (zone II) or even more (>16 in zone III). A magnetic shear of
that goes from 2.25 (zone I)
to 6.7 (zone II) or even more (>16 in zone III). A magnetic shear of ![]() 2
is a typical value already met in previous simulations and in
self-similar models. It results from the interplay between
the disk and the jet and leads to a steady-state. Self-similar models
have shown that a larger value will result in unsteady disk and wind
configurations
(Wardle & Königl 1993; Ferreira 1997).
Remarkably, zone III exhibits an even larger value that still
increases with height. There is no jet in this zone but only a
torsional Alfvén wave
leading to a (negligible) magnetic braking of the underlying disk. In
this zone, the magnetic field is so small that the shear can be very
large with no actual damage on the disk structure.
2
is a typical value already met in previous simulations and in
self-similar models. It results from the interplay between
the disk and the jet and leads to a steady-state. Self-similar models
have shown that a larger value will result in unsteady disk and wind
configurations
(Wardle & Königl 1993; Ferreira 1997).
Remarkably, zone III exhibits an even larger value that still
increases with height. There is no jet in this zone but only a
torsional Alfvén wave
leading to a (negligible) magnetic braking of the underlying disk. In
this zone, the magnetic field is so small that the shear can be very
large with no actual damage on the disk structure.
In zones I and II, where ejection takes place, the radial
current density decreases vertically and becomes eventually negative.
In fact a close examination of Fig. 7 reveals the
following pattern. The poloidal current enters the disk at its surface (Jz+<0) between r=1 and
![]() and then flows inside the disk with Jr >0. From r=2.5 to about r=13 it exits
the disk (Jz+
>0). This is the usual behavior expected in the jet accelerating
region, with a typical butterfly shape for the electric poloidal
current density (see Fig. 13 in Ferreira 1997).
This is not the case anymore in zone III where no jet is launched.
There, most of the radial current remains confined within the disk,
with Jr+ vanishingly small.
This is clearly seen in Fig. 7: current lines remain within the disk giving rise to a current
and then flows inside the disk with Jr >0. From r=2.5 to about r=13 it exits
the disk (Jz+
>0). This is the usual behavior expected in the jet accelerating
region, with a typical butterfly shape for the electric poloidal
current density (see Fig. 13 in Ferreira 1997).
This is not the case anymore in zone III where no jet is launched.
There, most of the radial current remains confined within the disk,
with Jr+ vanishingly small.
This is clearly seen in Fig. 7: current lines remain within the disk giving rise to a current
![]() roughly constant with the radius (thus
roughly constant with the radius (thus
![]() ). Such
a radial profile of the toroidal field will be discussed in a companion paper.
). Such
a radial profile of the toroidal field will be discussed in a companion paper.
![\begin{figure}
\par\includegraphics[width=15cm,clip]{12633f08.eps}
\end{figure}](/articles/aa/full_html/2010/04/aa12633-09/img123.png)
|
Figure 8:
Vertical profiles of the components of the magnetic field ( left) and electric current density ( right), in zones I (r=2.4), II (r=7.9) and III (r=31.3), plotted at a time 953
|
| Open with DEXTER | |
3.4 The self-confined jet
Here we focus on the dynamics of the super-Fast Magnetosonic outflow referred to as the jet. Such a structure established on a dynamical time scale, namely the local Keplerian time, up to r=5. This is also approximately the time scale for FM waves propagating upstream from the FM surface and reaching the disk surface. As a consequence, the Keplerian time is also the good time scale for establishing a steady-state. Indeed, we observe that after roughly 30 Keplerian orbits there is no relevant modification of the inner jet structure, corresponding to a few times the orbital period at r=5.
![\begin{figure}
\par\includegraphics[width=11.5cm,clip]{12633f09.eps}\vspace*{-1.5mm}
\end{figure}](/articles/aa/full_html/2010/04/aa12633-09/img124.png)
|
Figure 9:
The five quantities which are considered invariant under ideal MHD: the mass flux to magnetic flux ratio k; the specific angular momentum l; the magnetic surface rotation rate |
| Open with DEXTER | |
In order to assess whether or not our magnetized adiabatic outflow
reached a steady-state, the best way is to compute the five following
quantities, namely the mass flux to magnetic flux ratio:

|
(19) |
the specific angular momentum:

where

|
(21) |
the entropy:
|
(22) |
and the specific energy or Bernoulli invariant:
According to steady state jet theory these quantities should be invariants, namely constant both in time and along each magnetic surface. They are shown along several field lines in Fig. 9 as a function of the altitude z at a time 953
The specific energy or Bernoulli invariant is separated into its
kinetic, enthalpy, magnetic and gravitational components (Eq. (23)). These are plotted along a single magnetic surface anchored
at r=2.4 in Fig. 10. The vertical line at
![]() shows the Slow-Magnetosonic point whereas the second line at
shows the Slow-Magnetosonic point whereas the second line at ![]() is the Alfvén point. The vertical line at
is the Alfvén point. The vertical line at
![]() shows the altitude where the resistivity has been set to zero, marking
thereby the transition between the underlying resistive layers and the
ideal MHD flow above. Several important aspects can
be drawn from this plot. First, the enthalpy (solid line) is
negligible: we are therefore contemplating a ``cold'' outflow as
defined by Blandford & Payne (1982).
The large bending of the magnetic
field at the disk surface is thereby enough to drive a
magneto-centrifugal outflow. It can be moreover seen that the dominant
contribution in E
is indeed the magnetic one (+ symbol), as it should be
in such a case. This magnetic energy is then converted into poloidal
kinetic energy, but still retains a sizable fraction of its initial
value at z=100. This limited efficiency of the energy
transfer will be discussed elsewhere.
shows the altitude where the resistivity has been set to zero, marking
thereby the transition between the underlying resistive layers and the
ideal MHD flow above. Several important aspects can
be drawn from this plot. First, the enthalpy (solid line) is
negligible: we are therefore contemplating a ``cold'' outflow as
defined by Blandford & Payne (1982).
The large bending of the magnetic
field at the disk surface is thereby enough to drive a
magneto-centrifugal outflow. It can be moreover seen that the dominant
contribution in E
is indeed the magnetic one (+ symbol), as it should be
in such a case. This magnetic energy is then converted into poloidal
kinetic energy, but still retains a sizable fraction of its initial
value at z=100. This limited efficiency of the energy
transfer will be discussed elsewhere.
![\begin{figure}
\par\includegraphics[width=8cm,clip]{12633f10.eps}
\end{figure}](/articles/aa/full_html/2010/04/aa12633-09/img134.png)
|
Figure 10: Components of the specific energy E along a magnetic surface anchored at r=2.4: magnetic, kinetic (poloidal and toroidal), gravitational and enthalpy. Vertical thick lines indicate the heights at which the slow magnetosonic (SM), Alfvén (A) and fast magnetosonic points (FM) are reached. Notice how negligible is the enthalpy compared with other components. |
| Open with DEXTER | |
It is noteworthy that the specific energy E is an invariant only after roughly ![]() :
in all the trans-SM zone, it still increases. This is not due to the enthalpy as it remains always
negligible despite the huge increase in entropy at the disk-jet interface (see Fig. 9). This increase in E can be traced back to the increase in the magnetic component at that same
location (see the increase in l in Fig. 9). This is actually due to a decrease of the mass to magnetic flux ratio k in the ideal MHD zone. How can this be understood in a well
tested code where the conservation of quantities such us mass and total energy is assured up to numerical accuracy?
:
in all the trans-SM zone, it still increases. This is not due to the enthalpy as it remains always
negligible despite the huge increase in entropy at the disk-jet interface (see Fig. 9). This increase in E can be traced back to the increase in the magnetic component at that same
location (see the increase in l in Fig. 9). This is actually due to a decrease of the mass to magnetic flux ratio k in the ideal MHD zone. How can this be understood in a well
tested code where the conservation of quantities such us mass and total energy is assured up to numerical accuracy?
A numerical algorithm such as the one that we employed for our experiments adds to the ``ideal'' flux a diffusive part
![]() roughly proportional to the local gradient of the corresponding
conserved variable, as in the case of the HLL Riemann solver used in
our simulations. For instance, it can be shown that, in a stationary
situation,
roughly proportional to the local gradient of the corresponding
conserved variable, as in the case of the HLL Riemann solver used in
our simulations. For instance, it can be shown that, in a stationary
situation,
![]() is proportional to the
divergence of a numerical diffusive flux
is proportional to the
divergence of a numerical diffusive flux
![]() that follows the gradient of the density. As a consequence, our estimator of k
is a constant only whenever numerical diffusion is
really negligible. This is clearly not verified at the disk surface
where the steepest gradient is present. But as we move upwards, the
numerical contribution vanishes and our estimator converges
(decreases) towards the real value of k. This points out however to a possible numerical bias in our MHD simulation.
that follows the gradient of the density. As a consequence, our estimator of k
is a constant only whenever numerical diffusion is
really negligible. This is clearly not verified at the disk surface
where the steepest gradient is present. But as we move upwards, the
numerical contribution vanishes and our estimator converges
(decreases) towards the real value of k. This points out however to a possible numerical bias in our MHD simulation.
![\begin{figure}
\par\includegraphics[width=9cm,clip]{12633f11.eps}\vspace*{1mm}
\end{figure}](/articles/aa/full_html/2010/04/aa12633-09/img139.png)
|
Figure 11:
Forces projected along a poloidal magnetic surface anchored at r=2.4, plotted against the altitude above the disk midplane at 953
|
| Open with DEXTER | |
Another numerical bias can be related to irreversible numerical
heating, clearly visible in the entropy profiles shown in Fig. 9
to test this suspicion, let us have a look at the forces that
actually drive the poloidal outflow. It is convenient to compute the
projection of all forces along a given magnetic surface (Fig. 11).
![]() is the parallel component of the kinetic pressure gradient
is the parallel component of the kinetic pressure gradient
|
(24) |
|
(25) |
where
|
(26) |
and, finally,
|
(27) |
Notice that the centrifugal term contained in
What is known from analytical studies is that it is mainly the vertical
component of the plasma pressure gradient that lifts the disk material
upwards in the resistive MHD layers![]() (Ferreira 1997; Ferreira & Pelletier 1995).
But this effect works only in a small
vertical extent around the disk surface. This is the region where both
the radial and vertical velocity components of the plasma switch from
negative (accretion) to positive (ejection). Once this
outward movement has been initiated within the resistive layers,
magnetic and centrifugal forces become both dominant and the usual
understanding in ideal MHD then applies. The critical issue of mass
loading, namely the amount of mass that is actually ejected from the
disk (measured by k), is therefore directly related to the delicate interplay of forces in this layer.
(Ferreira 1997; Ferreira & Pelletier 1995).
But this effect works only in a small
vertical extent around the disk surface. This is the region where both
the radial and vertical velocity components of the plasma switch from
negative (accretion) to positive (ejection). Once this
outward movement has been initiated within the resistive layers,
magnetic and centrifugal forces become both dominant and the usual
understanding in ideal MHD then applies. The critical issue of mass
loading, namely the amount of mass that is actually ejected from the
disk (measured by k), is therefore directly related to the delicate interplay of forces in this layer.
This picture is globally confirmed by our numerical simulation (Fig. 11). Inside the disk the viscous stress transports momentum upwards but it reduces to zero at the disk surface (see
Appendix A
for the definition). The projection of the Lorentz force is initially
negative, showing that the magnetic force within the disk and up to its
surface is hindering ejection,
not helping it. The same holds for the effective force, where gravity
overcomes the centrifugal term even up to after the Alfvén point. It is
indeed the plasma pressure term that makes the
difference by providing a super-SM ejection. Before the Alfvén point
however, it becomes negligible and the dominant force is the magnetic
one ![]() .
.
This enhanced pressure gradient is likely to be related to the numerical heating visible in Fig. 9. On the other hand, when looking at the Bernoulli invariant, the enthalpy remains always negligible: we argue that, due to the enhanced mass flux related to the diffusive effects discussed before, the numerical heating per unit volume does not correspond to a significant temperature and enthalpy increase.
3.5 Mass loading in numerical simulations
The side effect of using finite difference methods to solve fluid equations is that it introduces numerical biases that play the role of a magnetic diffusivity, heat conductivity and viscosity. Although such a numerical diffusion is limited so far as is possible, it is unavoidable and plays a role wherever a steep gradient sets in in any quantity. This is clearly the case for the density profile (Fig. 6) at the resistive-ideal MHD zone where the critical issues of mass loading and initial jet acceleration take place. See Zanni et al. (2007) for a discussion of this point. Thus, if present, such a numerical diffusion is actually an extra force term that will appear in particular in the vertical equation and should be present in any numerical simulation published so far.The previous clues that some numerical diffusion of mass is taking place (the bump in the k ``invariant'' seen in Fig. 9) can be tested by repeating the simulation at higher resolution. We
therefore performed two more simulations, one with a resolution twice and another with a resolution 8 times higher (Fig. 13).
The physical parameters, boundary and initial conditions
remained unchanged, but the physical extent of the simulation was
reduced. Additionally the simulations were only carried out for ![]() 17 inner disk orbital periods.
17 inner disk orbital periods.
We obtained the following results : (i) whereas a super-FM jet is still
launched in a steady-state; (ii) the radial extent of the ejecting
zone is narrower up to ![]() only. We will come to back
to this later. Figure 14 shows the various quantities that should remain invariant, to be compared with Fig. 9 with the lowest resolution. The anchoring radii are the same as
in Fig. 9. Clearly, the invariants are flatter as numerical diffusion is reduced. Also, the bump in k has now almost vanished and the transition from resistive to ideal MHD is much
better caught. Moreover, the entropy profiles clearly shows that the numerical heating is strongly reduced.
only. We will come to back
to this later. Figure 14 shows the various quantities that should remain invariant, to be compared with Fig. 9 with the lowest resolution. The anchoring radii are the same as
in Fig. 9. Clearly, the invariants are flatter as numerical diffusion is reduced. Also, the bump in k has now almost vanished and the transition from resistive to ideal MHD is much
better caught. Moreover, the entropy profiles clearly shows that the numerical heating is strongly reduced.
![\begin{figure}
\par\includegraphics[width=9cm,clip]{12633f12.eps} \vspace*{1.5mm}
\end{figure}](/articles/aa/full_html/2010/04/aa12633-09/img149.png)
|
Figure 12:
Same as Fig. 11 but with a resolution eight times higher. Although the time is now only 15.9
|
| Open with DEXTER | |
Figure 12 shows the parallel forces along a given field line anchored at the same radius as in the lowest resolution case. The general trend remains the same although the effect of the thermal push is now dramatically reduced. It is still the dominant force allowing a trans-SM flow but its importance decreases more rapidly. Of course, only magnetic forces provide a super-Alfvénic flow. The reduction of the ejection efficiency with increasing resolution confirms our suspicion: numerical diffusion is indeed at work at the disk surface in the inner regions of the grid. This effect naturally explains the mass loading, initial push and thereby increase in the specific energy E.
3.6 The role of the disk magnetization
So far we understood the initial mass loading and driving mechanisms of the jet. However, what determines its radial extent has remained unexplored. In previous simulations of that kind the extent of the ejecting zone was increasing in time with a Keplerian scalingIn steady-state jet theory, the Bernoulli invariant must be positive at
all magnetic surfaces. Neglecting enthalpy (as Fig. 10 suggests), Eq. (23) provides
|
(28) |
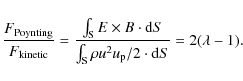
where
|
(29) |
is the ratio of the MHD Poynting flux to the kinetic energy flux measured at the disk surface. This quantity is sometimes referred to as the (initial) jet magnetization. A cold jet requires therefore
![\begin{figure}
\par\mbox{\includegraphics[width=7.2cm,clip]{12633c13.eps}\hspace...
...
\includegraphics[width=7.2cm,clip]{12633d13.eps} }
\vspace*{3mm}
\end{figure}](/articles/aa/full_html/2010/04/aa12633-09/img154.png)
|
Figure 13: Two simulations done at different resolutions: two times ( left panel) and eight times ( right panel) our reference simulation. The colormap is the log of gas density with overplotted magnetic field lines at footpoints r = 2, 3, 4, 5, 6. The overlaid critical surfaces are the Alfvén surface (dashed line)and the fast magnetosonic surface (dotted line). |
| Open with DEXTER | |
![\begin{figure}
\par\includegraphics[width=11.5cm,clip]{12633f14.eps}
\end{figure}](/articles/aa/full_html/2010/04/aa12633-09/img155.png)
|
Figure 14:
The same as Fig. 9
but for a resolution eight times higher. The invariants are flatter and
the bump in the mass loading is reduced. A steady-state super-FM jet is
still present but from a smaller radial extent. The measurements are at
time 17.5
|
| Open with DEXTER | |
Another way to write the initial jet magnetization is
|
(30) |
where
In fact, analytical calculations done within the self-similar
framework already pointed out the importance of the disk magnetization ![]() for launching super-FM jets. It was shown that isothermal
(Ferreira 1997; Ferreira & Pelletier 1995) or adiabatic (Casse & Ferreira 2000a) magnetic surfaces require a field close to equipartition, namely
for launching super-FM jets. It was shown that isothermal
(Ferreira 1997; Ferreira & Pelletier 1995) or adiabatic (Casse & Ferreira 2000a) magnetic surfaces require a field close to equipartition, namely ![]() smaller but around unity. Our own
results suggest that it is the disk magnetization that actually defines the ejecting zones. Beyond r=5, the magnetic field would be too small to allow a proper jet to be launched.
smaller but around unity. Our own
results suggest that it is the disk magnetization that actually defines the ejecting zones. Beyond r=5, the magnetic field would be too small to allow a proper jet to be launched.
Let us make a very crude approach by assuming a Bz
component almost constant in the vertical direction and an isothermal
hydrostatic density profile. In that case, one would have
![]() where
where ![]() is the disk magnetization at the disk midplane. It seems therefore dubious that
is the disk magnetization at the disk midplane. It seems therefore dubious that ![]() ,
reaching a value 10 to 100 times
,
reaching a value 10 to 100 times ![]() at a few scale height, could ever reach a
value of order unity if
at a few scale height, could ever reach a
value of order unity if ![]() is too small. So, even in the presence of a numerical diffusion, no
jets should be produced if the disk magnetization is too low.
is too small. So, even in the presence of a numerical diffusion, no
jets should be produced if the disk magnetization is too low.
In order to test this conjecture, we performed another numerical simulation with ![]() decreased by one order of magnitude (namely starting at
decreased by one order of magnitude (namely starting at
![]() at
the disk inner radius). The other
physical parameters, boundary and initial conditions, as well as the
numerical resolution were otherwise identical to the reference
simulation. We found that, in this case the super-Alfvénic
material was extremely sporadic and fragmented in the domain, and no
super-fast-magnetosonic jet was observed. See Fig. 16.
at
the disk inner radius). The other
physical parameters, boundary and initial conditions, as well as the
numerical resolution were otherwise identical to the reference
simulation. We found that, in this case the super-Alfvénic
material was extremely sporadic and fragmented in the domain, and no
super-fast-magnetosonic jet was observed. See Fig. 16.
In our view, this clearly confirms that the disk magnetization must be
high enough in order to launch self-confined (super-FM) jets. This
result goes in the same direction as those obtained with
self-similar solutions. However, the latter claimed that only ![]() smaller but close to unity (namely a field close to equipartition)
allows the launching of magnetized jets. The physical argument is
the following. For a jet to be launched, the lifted mass must cross the
SM point around the disk surface. In a cold environment the only force
able to do this is the magnetic one. It turns out
however, that it is much easier to do it if the accretion velocity is
already not too far from the sound speed. This is the reason why
isothermal or adiabatic jets require fields close to
equipartition (Ferreira & Casse 2009, submitted).
smaller but close to unity (namely a field close to equipartition)
allows the launching of magnetized jets. The physical argument is
the following. For a jet to be launched, the lifted mass must cross the
SM point around the disk surface. In a cold environment the only force
able to do this is the magnetic one. It turns out
however, that it is much easier to do it if the accretion velocity is
already not too far from the sound speed. This is the reason why
isothermal or adiabatic jets require fields close to
equipartition (Ferreira & Casse 2009, submitted).
Apparently, this is in contradiction with our own result since we do obtain jets with ![]() of the order of a few 10-3.
The reason for this discrepancy lies in the fact that the analytical
models
were obtained under the assumption of either isothermal or adiabatic
magnetic surfaces. Here, as we showed, there is a numerical diffusion
that allowed mass to leak from the disk to the open, rotating
field lines. This extra effect has been mimicked for instance in Casse & Ferreira (2000b)
with the presence of a heating term at the disk surface. New solutions,
called ``warm'' in contrast to the
previous ``cold'' ones, were found with an enhanced mass flux. But
these authors did not recognize that the required disk magnetization
of the order of a few 10-3.
The reason for this discrepancy lies in the fact that the analytical
models
were obtained under the assumption of either isothermal or adiabatic
magnetic surfaces. Here, as we showed, there is a numerical diffusion
that allowed mass to leak from the disk to the open, rotating
field lines. This extra effect has been mimicked for instance in Casse & Ferreira (2000b)
with the presence of a heating term at the disk surface. New solutions,
called ``warm'' in contrast to the
previous ``cold'' ones, were found with an enhanced mass flux. But
these authors did not recognize that the required disk magnetization ![]() was indeed smaller than for cold jets. We report here
that it is indeed the case, with some of the ``warm'' self-similar solutions found with
was indeed smaller than for cold jets. We report here
that it is indeed the case, with some of the ``warm'' self-similar solutions found with ![]() .
.
![\begin{figure}
\par\includegraphics[width=9cm,clip]{12633f15.eps} \vspace*{1.5mm}
\end{figure}](/articles/aa/full_html/2010/04/aa12633-09/img162.png)
|
Figure 15:
Upper panel: initial jet magnetization |
| Open with DEXTER | |
![\begin{figure}
\par\includegraphics[width=8cm,clip]{12633c16.eps}
\end{figure}](/articles/aa/full_html/2010/04/aa12633-09/img163.png)
|
Figure 16:
The colourmap shows the logarithm of gas density in the weak magnetic field simulation at time
|
| Open with DEXTER | |
4 Concluding remarks
In this paper, we performed four 2.5D numerical MHD simulations of a resistive viscous accretion disk threaded by a weak magnetic field. The initial magnetic field distribution was chosen so that the disk magnetizationIt is shown that the disk structure resembles that of a standard Shakura & Sunyaev disk with accretion controlled by the turbulent (alpha) viscous torque only. However, a super fast magnetosonic, self-confined jet is observed to be launched from the inner disk regions. It is first time that (i) steady-state super-FM jets are produced from a weakly magnetized disk and (ii) from a finite disk region that remained constant over time. The power carried away by these jets is tiny and directly related to the negligible torque on the disk. The dynamics of the jet and its propagation into the medium will be studied in a forthcoming paper. Here, we focused on the jet acceleration region where the flow crossed the three MHD critical surfaces (Slow Magnetosonic, Alfvén and Fast Magnetosonic).
The critical issues of mass loading and initial jet acceleration (the crossing of the SM surface) are shown to be strongly affected by the unavoidable steep decrease of the density profile at the disk surface. Such an effect has been underestimated in previous simulations. It is the quality of the grid resolution at the disk surface that ultimately determines the amount of ejected mass. One way to solve this problem is to use either an enhanced resolution at the disk surface, a less diffusive algorithm, a higher order method or an adaptive grid which refines on the density gradient.
We argue however that this feature might mimic some additional heat input at the disk surface, as explored for instance by Ogilvie & Livio (1998), Ogilvie & Livio (2001), Casse & Ferreira (2000b). This aspect is extremely promising as most astrophysical accretion disks do probably have superheated layers due to irradiation by the central object (young stars, cataclysmic variables) and/or some X-ray source (e.g. around black holes). As a consequence, ``cold'' (e.g. isothermal or adiabatic) ejection is probably never achieved in Nature.
This allows also to relax the constraint of equipartition fields needed for driving jets as our jets were obtained from a very low magnetized disk (but not too low). This opens a new fascinating topic: the magnetic history of any given object. One might indeed consider accretion disks displaying a whole continuum in ejection efficiency, from jets carrying a sizable fraction (if not most) of the released accretion power to jets that are a mere epiphenomenon of accretion. For any given object, the key parameter would be the disk magnetization. This clearly deserves further investigation.
AcknowledgementsThis work has been supported by the ANR-05-JC42835 project funded by the ``Agence National de la Recherche'' and through the Marie Curie Research Training Network JETSET (Jet Simulations, Experiments and Theory) under contract MRTN-CT-2004-005592. The authors wish to acknowledge the SFI/HEA Irish Centre for High-End Computing (ICHEC) for the provision of computational facilities and support.
Appendix A: Additional numerical conditions
As an initial condition for the simulation the perturbative solution of the steady-state MHD equations is taken. The disk pressure and density are computed by solving the hydrostatic vertical equilibrium, the toroidal speed is determined by the radial equilibrium, whereas the radial velocity is given by the angular momentum conservation equation. We assumed a thermal disk heightscale![\begin{displaymath}\rho_{\rm d} = \rho_{\rm d0} \left\{\frac{2}{5\epsilon^2}\lef...
...rac{5\epsilon^2}{2}\right)\frac{r_0}{r}\right]\right\}^{3/2} ,
\end{displaymath}](/articles/aa/full_html/2010/04/aa12633-09/img170.png)
|
(A.1) |
and the thermal pressure by:
|
(A.2) |
where
![\begin{displaymath}u_{r{\rm d}} = -\alpha_{\rm v}\epsilon^2\left[10-\frac{32}{3}...
...-\frac{z^2}{\epsilon^2r^2}\right)\right] \sqrt{\frac{GM}{r}} ,
\end{displaymath}](/articles/aa/full_html/2010/04/aa12633-09/img173.png)
|
(A.3) |

|
(A.4) |
The toroidal speed is:
![\begin{displaymath}u_{\phi{\rm d}} = \left[ \sqrt{1-\frac{5\epsilon^2}{2}}+\frac...
...ac{6z^2}{5\epsilon^2r^2} \right) \right] \sqrt{\frac{GM}{r}} ,
\end{displaymath}](/articles/aa/full_html/2010/04/aa12633-09/img175.png)
|
(A.5) |
with
For viscosity and resistivity, the expression used by Zanni & Ferreira (2009) is employed:
![\begin{displaymath}\nu_{\rm v} = \frac{2}{3}\alpha_{\rm v} \left[ \left. c^2_{\r...
...\frac{GM}{R}-\frac{GM}{r}\right)\right]\sqrt{\frac{r^3}{GM}} ,
\end{displaymath}](/articles/aa/full_html/2010/04/aa12633-09/img177.png)
|
(A.6) |
where the isothermal soundspeed calculated on the disk midplane
For the atmosphere above disk all velocities are set to zero,
![]() ,
and a hydrostatic, spherically symmetric atmosphere is prescribed:
,
and a hydrostatic, spherically symmetric atmosphere is prescribed:

|
(A.7) |
|
(A.8) |
A density contrast
The components of the viscous stress tensor
![]() used in PLUTO are:
used in PLUTO are:
|
(A.9) |
|
(A.10) |
|
(A.11) |
|
(A.12) |

|
(A.13) |
|
(A.14) |
where the bulk viscosity
References
- Balbus, S. A., & Hawley, J. F. 1991, ApJ, 376, 214 [NASA ADS] [CrossRef] [Google Scholar]
- Beckwith, K., Hawley, J. F., & Krolik, J. H. 2009, ApJ, 707, 428 [NASA ADS] [CrossRef] [Google Scholar]
- Blandford, R. D., & Payne, D. G. 1982, MNRAS, 199, 883 [NASA ADS] [CrossRef] [Google Scholar]
- Cabrit, S. 2007, in LNP, ed. Ferreira, Dougados, & Whelan (Springer), 723, 21 [Google Scholar]
- Casse, F., & Ferreira, J. 2000a, A&A, 353, 1115 [NASA ADS] [Google Scholar]
- Casse, F., & Ferreira, J. 2000b, A&A, 361, 1178 [NASA ADS] [Google Scholar]
- Casse, F., & Keppens, R. 2002, ApJ, 581, 988 [NASA ADS] [CrossRef] [Google Scholar]
- Casse, F., & Keppens, R. 2004, ApJ, 601, 90 [NASA ADS] [CrossRef] [Google Scholar]
- Combet, C., & Ferreira, J. 2008, A&A, 479, 481 [NASA ADS] [CrossRef] [EDP Sciences] [Google Scholar]
- Evans, C. R., & Hawley, J. F. 1988, ApJ, 332, 659 [Google Scholar]
- Ferreira, J. 1997, A&A, 319, 340 [NASA ADS] [Google Scholar]
- Ferreira, J. 2008, New Astron. Rev., 52, 42 [NASA ADS] [CrossRef] [Google Scholar]
- Ferreira, J., & Pelletier, G. 1995, A&A, 295, 807 [NASA ADS] [Google Scholar]
- Ferreira, J., Petrucci, P.-O., Henri, G., Saugé, L., & Pelletier, G. 2006, A&A, 447, 813 [NASA ADS] [CrossRef] [EDP Sciences] [Google Scholar]
- Frank, J., King, A., & Raine, D. J. 2002, Accretion Power in Astrophysics: Third edn. (Cambridge, UK: Cambridge University Press) [Google Scholar]
- Guan, X., & Gammie, C. F. 2009, ApJ, 697, 1901 [NASA ADS] [CrossRef] [Google Scholar]
- Harten, A., Lax, P. D., & van Leer, B. 1983, SIAM Rev., 25, 35 [Google Scholar]
- Hartigan, P., Edwards, S., & Pierson, R. 2004, ApJ, 609, 261 [NASA ADS] [CrossRef] [Google Scholar]
- Hawley, J. F., & Balbus, S. A. 2002, ApJ, 573, 738 [NASA ADS] [CrossRef] [Google Scholar]
- Igumenshchev, I. V., Narayan, R., & Abramowicz, M. A. 2003, ApJ, 592, 1042 [NASA ADS] [CrossRef] [Google Scholar]
- Küker, M., Henning, T., & Rüdiger, G. 2003, ApJ, 589, 397 [NASA ADS] [CrossRef] [Google Scholar]
- Lesur, G., & Longaretti, P. 2009, A&A, 504, 309 [NASA ADS] [CrossRef] [EDP Sciences] [Google Scholar]
- Li, Z. 1995, ApJ, 444, 848 [NASA ADS] [CrossRef] [Google Scholar]
- Lynden-Bell, D., & Pringle, J. E. 1974, MNRAS, 168, 603 [NASA ADS] [CrossRef] [Google Scholar]
- Meliani, Z., Casse, F., & Sauty, C. 2006, A&A, 460, 1 [NASA ADS] [CrossRef] [EDP Sciences] [Google Scholar]
- Mignone, A., Bodo, G., Massaglia, S., et al. 2007, ApJS, 170, 228 [Google Scholar]
- Mouschovias, T. C., & Paleologou, E. V. 1980, ApJ, 237, 877 [NASA ADS] [CrossRef] [Google Scholar]
- Ogilvie, G. I., & Livio, M. 1998, ApJ, 499, 329 [NASA ADS] [CrossRef] [Google Scholar]
- Ogilvie, G. I., & Livio, M. 2001, ApJ, 553, 158 [NASA ADS] [CrossRef] [Google Scholar]
- Ouyed, R., & Pudritz, R. E. 1997, ApJ, 482, 712 [NASA ADS] [CrossRef] [Google Scholar]
- Pelletier, G., & Pudritz, R. E. 1992, ApJ, 394, 117 [NASA ADS] [CrossRef] [Google Scholar]
- Romanova, M. M., Ustyugova, G. V., Koldoba, A. V., & Lovelace, R. V. E. 2009, MNRAS, 399, 1802 [NASA ADS] [CrossRef] [Google Scholar]
- Rothstein, D. M., & Lovelace, R. V. E. 2008, ApJ, 677, 1221 [NASA ADS] [CrossRef] [Google Scholar]
- Rózyczka, M., Bodenheimer, P., & Bell, K. R. 1994, ApJ, 423, 736 [NASA ADS] [CrossRef] [Google Scholar]
- Shakura, N. I., & Sunyaev, R. A. 1973, A&A, 24, 337 [NASA ADS] [Google Scholar]
- Tagger, M., & Pellat, R. 1999, A&A, 349, 1003 [NASA ADS] [Google Scholar]
- Tzeferacos, P., Ferrari, A., Mignone, A., et al. 2009, MNRAS, 400, 820 [NASA ADS] [CrossRef] [Google Scholar]
- Urpin, V. A. 1984, Soviet Astronomy, 28, 50 [Google Scholar]
- von Rekowski, B., Brandenburg, A., Dobler, W., & Shukurov, A. 2003, A&A, 398, 825 [NASA ADS] [CrossRef] [EDP Sciences] [Google Scholar]
- Wardle, M., & Königl, A. 1993, ApJ, 410, 218 [NASA ADS] [CrossRef] [Google Scholar]
- Zanni, C., & Ferreira, J. 2009, A&A, 508, 1117 [NASA ADS] [CrossRef] [EDP Sciences] [Google Scholar]
- Zanni, C., Ferrari, A., Rosner, R., Bodo, G., & Massaglia, S. 2007, A&A, 469, 811 [NASA ADS] [CrossRef] [EDP Sciences] [Google Scholar]
Footnotes
- ... magnetization
![[*]](/icons/foot_motif.png)
- The magnetization is related to the usual plasma beta by
 in gas pressure supported disks. It is however a more general concept as s it is defined with the total pressure
 .
.
- ...

- This value might be seen too large when compared to the small mean field used in the disk.
However, note that the main effect of a large
 is to reduce the accretion time scale, while still maintaining it well below the Keplerian one.
- ... layers
- In the zone
where Jz+<0, namely where the current enters the disk surface (from r=1 to
 ), the toroidal magnetic pressure provides also an upward push (
 ). But in the
zone where Jz+>0 (from
to r=5), the magnetic contribution is only a vertical pinch.
). But in the
zone where Jz+>0 (from
to r=5), the magnetic contribution is only a vertical pinch.
All Tables
Table 1: Viscous, accretion, mechanical, kinetic powers and MHD Poynting flux.
All Figures
|
|
Figure 1:
Log of mass density at times a)
|
| Open with DEXTER | |
| In the text | |
|
|
Figure 2:
Poloidal cross section showing various zones at a time
|
| Open with DEXTER | |
| In the text | |
|
|
Figure 3:
Time evolution of the ejection rate ( top), calculated by integrating the mass flux over the super-fast region only, half disk accretion rate ( middle) measured at the inner radius and the ejection to accretion rate ratio ( down). After an initial transient phase that lasted up to 200
|
| Open with DEXTER | |
| In the text | |
|
|
Figure 4:
Poloidal velocity normalized to the Keplerian velocity at the footpoint along a magnetic field surface. The time is 953.3
|
| Open with DEXTER | |
| In the text | |
| |
Figure 5:
Ratio of midplane radial accretion sonic Mach number |
| Open with DEXTER | |
| In the text | |
|
|
Figure 6:
Vertical density profiles at r=2.4,5.5, and r=14.1,
normalized to their midplane value. At the inner radius, the initial
steep gradient has been flattened out. This is a signature of mass loss
from the disk. The time is at 953
|
| Open with DEXTER | |
| In the text | |
|
|
Figure 7:
Snapshot at
|
| Open with DEXTER | |
| In the text | |
|
|
Figure 8:
Vertical profiles of the components of the magnetic field ( left) and electric current density ( right), in zones I (r=2.4), II (r=7.9) and III (r=31.3), plotted at a time 953
|
| Open with DEXTER | |
| In the text | |
|
|
Figure 9:
The five quantities which are considered invariant under ideal MHD: the mass flux to magnetic flux ratio k; the specific angular momentum l; the magnetic surface rotation rate |
| Open with DEXTER | |
| In the text | |
|
|
Figure 10: Components of the specific energy E along a magnetic surface anchored at r=2.4: magnetic, kinetic (poloidal and toroidal), gravitational and enthalpy. Vertical thick lines indicate the heights at which the slow magnetosonic (SM), Alfvén (A) and fast magnetosonic points (FM) are reached. Notice how negligible is the enthalpy compared with other components. |
| Open with DEXTER | |
| In the text | |
|
|
Figure 11:
Forces projected along a poloidal magnetic surface anchored at r=2.4, plotted against the altitude above the disk midplane at 953
|
| Open with DEXTER | |
| In the text | |
|
|
Figure 12:
Same as Fig. 11 but with a resolution eight times higher. Although the time is now only 15.9
|
| Open with DEXTER | |
| In the text | |
|
|
Figure 13: Two simulations done at different resolutions: two times ( left panel) and eight times ( right panel) our reference simulation. The colormap is the log of gas density with overplotted magnetic field lines at footpoints r = 2, 3, 4, 5, 6. The overlaid critical surfaces are the Alfvén surface (dashed line)and the fast magnetosonic surface (dotted line). |
| Open with DEXTER | |
| In the text | |
|
|
Figure 14:
The same as Fig. 9
but for a resolution eight times higher. The invariants are flatter and
the bump in the mass loading is reduced. A steady-state super-FM jet is
still present but from a smaller radial extent. The measurements are at
time 17.5
|
| Open with DEXTER | |
| In the text | |
|
|
Figure 15:
Upper panel: initial jet magnetization |
| Open with DEXTER | |
| In the text | |
|
|
Figure 16:
The colourmap shows the logarithm of gas density in the weak magnetic field simulation at time
|
| Open with DEXTER | |
| In the text | |
Copyright ESO 2010
Current usage metrics show cumulative count of Article Views (full-text article views including HTML views, PDF and ePub downloads, according to the available data) and Abstracts Views on Vision4Press platform.
Data correspond to usage on the plateform after 2015. The current usage metrics is available 48-96 hours after online publication and is updated daily on week days.
Initial download of the metrics may take a while.